Research Articles

Spatial and temporal coordinated development research on ecosystem services and human well-being in the typical pastoral area of the Qinghai-Tibet Plateau

  • REN Siyu , 1 ,
  • JING Haichao 2 ,
  • QIAN Xuexue 1 ,
  • LIU Yinghui , 1, *
Expand
  • 1. State Key Laboratory of Earth Surface Processes and Resource Ecology, Faculty of Geographical Science, Beijing Normal University, Beijing 100875, China
  • 2. Shenzhen Nanshan Foreign Language School, Shenzhen 518063, Guangdong, China
*Liu Yinghui (1976-), Associate Professor, specialized in natural resources. E-mail:

Ren Siyu (2000-), Master, specialized in natural resources. E-mail:

Received date: 2023-05-04

  Accepted date: 2023-11-08

  Online published: 2024-02-06

Supported by

The Second Tibetan Plateau Scientific Expedition and Research Program (STEP)(2019QZKK0608)

Abstract

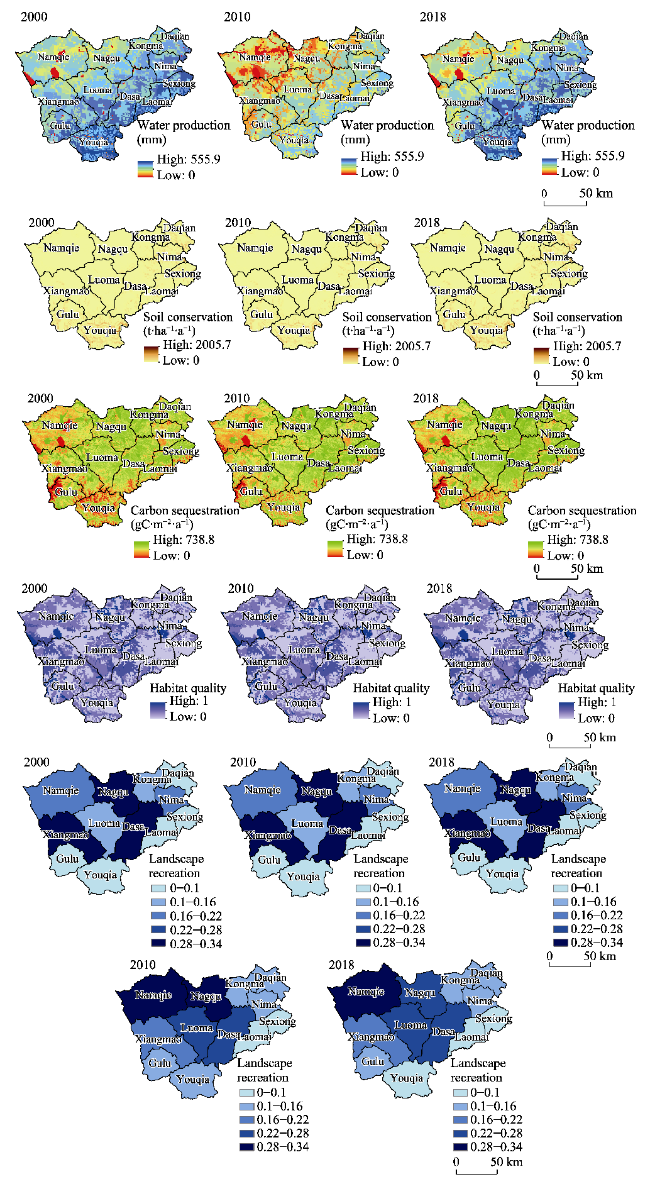
In this study, the interplay between ecosystem services and human well-being in Seni district, which is a pastoral region of Nagqu city on the Qinghai-Tibet Plateau, is investigated. Employing the improved InVEST model, CASA model, coupling coordination model, and hierarchical clustering method, we analyze the spatiotemporal patterns of ecosystem services, the levels of resident well-being levels, and the interrelationships between these factors over the period from 2000 to 2018. Our findings reveal significant changes in six ecosystem services, with water production decreasing by 7.1% and carbon sequestration and soil conservation services increasing by approximately 6.3% and 14.6%, respectively. Both the habitat quality and landscape recreation services remained stable. Spatially, the towns in the eastern and southern areas exhibited higher water production and soil conservation services, while those in the central area exhibited greater carbon sequestration services. The coupling and coordination relationship between ecosystem services and human well-being improved significantly over the study period, evolving from low-level coupling to coordinated coupling. Hierarchical clustering was used to classify the 12 town-level units into five categories. Low subjective well-being townships had lower livestock breeding services, while high subjective well-being townships had higher supply, regulation, and support ecosystem services. Good transportation conditions were associated with higher subjective well-being in townships with low supply services. We recommend addressing the identified transportation disparities and enhancing key regulatory and livestock breeding services to promote regional sustainability and improve the quality of life for Seni district residents, thus catering to the diverse needs of both herdsmen and citizens.

Cite this article

REN Siyu , JING Haichao , QIAN Xuexue , LIU Yinghui . Spatial and temporal coordinated development research on ecosystem services and human well-being in the typical pastoral area of the Qinghai-Tibet Plateau[J]. Journal of Geographical Sciences, 2024 , 34(2) : 252 -288 . DOI: 10.1007/s11442-024-2204-4

1 Introduction

Since the initiation of the Millennium Ecosystem Assessment (MA) project in 2001 (Reid et al., 2005), ecosystem services have garnered significant attention. Studies indicate that more than half of the essential ecosystem services are undergoing continuous degradation, resulting in poverty in some regions due to the insufficiency of environmental resources (Yan et al., 2017). Concurrently, the growing demands of economic, health, and quality of life needs are exerting increased pressure on the ecological environment (Kosanic et al., 2020). Factors such as economic status, health status, and quality of life contribute to human well-being. Consequently, investigating ecosystem services has become increasingly intertwined with human well-being, emerging as a critical scientific issue for sustainable development (Mauser et al., 2013; Wu, 2013; Wang et al., 2017; Qiu et al., 2022). In recent years, scholars have focused on assessing and quantifying the various services that regional ecosystems provide to humans, elevating the quantification of different ecosystem services into a research hotspot (Logsdon and Chaubey, 2013; Zhang et al., 2019b; Kang et al., 2020; Zhong et al., 2020; Raji et al., 2021). By evaluating and quantifying the multiple ecosystem services in a region and analyzing the spatiotemporal patterns and main causes underlying their formation, quantitative, scientific, and comparable ecological environment data can be provided for use in local planning and environmental protection decision-making to ensure accurate policy formulation and implementation (Li et al., 2021; Wang et al., 2021b; Liu et al., 2023; Ma et al., 2023).
Ecosystem services refer to the natural environmental conditions and utilities sustained by ecosystems and ecological processes, which are crucial for human survival. The current methods for quantifying and evaluating ecosystem services include value-based, material-based, and emergy-based approaches. The emergy-based method is used to quantify the various services and materials encompassed in a unified emergy energy value. Zhang et al. (2016) conducted a study on the national grain production service, quantified various types of major national grain production using emergy, and assessed the changes in China’s multi-year crop production services. Wu et al. (2013) used the emergy method to evaluate the service value brought by a large hydropower station to the region, including such aspects as flood storage and landscape tourism. Zhan et al. (2019) chose a specific region and quantified the value of various ecosystem services within the region using the emergy method. However, this method cannot accurately reflect the spatial pattern of ecosystem services. The analysis process requires determining the conversion rates for each service or resource to energy value, which is complex and highly uncertain. The value assessment method is used to measure the products and services provided by the ecosystem from the natural environment and the benefit to humans of various services in terms of monetary value. A common means used to achieve this is the equivalence method, which is used to quantify the ideal values of various ecosystem services provided by different land types or ecosystems based on precise land use spatial data or ecosystem classification data through the use of value equivalence factors. This method was first proposed by Costanza et al. (1997), and scholars have corrected the equivalence factors proposed by Costanza et al. (1997) for different environmental characteristics and conducted a large number of studies on the methods of calculating ecosystem service values (Zhang et al., 2021; Chen et al., 2022b). The equivalence factor method is easy to operate and convenient for displaying evaluation results on a spatial scale. However, the definition of its numerical values is relatively subjective. Moreover, due to the significant differences between the same ecosystems in different regions, a unified equivalence factor can be used to smooth out the differences between ecosystems on a large scale to some extent, thus resulting in a high degree of uncertainty in the evaluation results.
The material-based assessment method is focused on the intrinsic mechanisms of various services provided by ecosystems, employing ecological mechanism models and utilizing large-scale spatial data to objectively and accurately quantify ecosystem services. This method is used to evaluate the spatiotemporal changes in ecosystem services through material quantity changes, and it can better facilitate an analysis of the sustainability of ecosystem services. The established ecological mechanism models include the InVEST model and the CASA model. The InVEST model is used to evaluate services such as water yield, soil conservation, habitat quality, carbon storage, and pollination (Yang et al., 2019; Marques et al., 2021; Song et al., 2021; Li et al., 2022a; Wang et al., 2022b), and its primary advantage is the spatial visualization of assessment results. The CASA model is used to assess the spatiotemporal patterns of ecosystem carbon storage, coupling ecosystem productivity with soil carbon and nitrogen fluxes, and is often used to evaluate carbon sequestration services (Wei et al., 2017; Qi et al., 2021).
Human well-being refers to people’s happiness and satisfaction from various perspectives, such as those of society, the economy, culture, and the environment (Clark, 2014). Breslow et al. (2016) defined human well-being as a state of interaction with others and the environment that occurs when human needs are met, enabling individuals and communities to meaningfully pursue their goals and enjoy a satisfactory quality of life. As human well-being consists of multiple factors, its assessment requires a comprehensive indicator system leveraging input from various indicators. The existing indicator systems used for measuring human well-being can be divided into three categories: subjective indicators, objective indicators, and a combination of both (King et al., 2014; Voukelatou et al., 2021). The specific indicator settings and choice of indicator system types should be determined based on the actual context in the study area. Objective human well-being indicators often come from statistical data that reflects resident well-being in a certain area, such as per capita net income or per capita GDP used to represent income well-being and life expectancy used to represent overall health well-being (Celentano et al., 2012). Widely used indices include the Human Development Index (HDI), Human Sustainable Development Index (HSDI) (Bravo, 2015), and Sustainable Society Index (SSI) (Van De Kerk et al., 2008). The HDI is an index that measures key dimensions of human development, including income, education, and life expectancy (Qadir, 2015). The HSDI adds an environmental dimension to the HDI. The SSI is an index used to measure the level of sustainability of a country or region, and it covers the broad meaning of sustainability, which includes human well-being, environmental well-being, and economic well-being (Van De Kerk, 2014). However, these systems do not account for regional differences, and data collection relies on the statistical data from various departments, making the research subject to statistical scale limitations. Some scholars have constructed their own indicator systems based on the survey area or population characteristics, such as Salti et al. (2021), who focused on young Palestinian refugees living in Lebanon. Although the use of objective indicators makes quantifying human well-being more concise and accurate, a sole reliance on these indicators cannot quantify residents’ true sense of happiness. Subjective indicators, which truly reflect respondent satisfaction levels in various well-being areas, typically rely on field questionnaires or interviews for data collection. Subjective indicator collection is not subject to statistical scale limitations and is suitable for areas with limited statistical data (Wang et al., 2017; Wei et al., 2018; Li et al., 2022b). The combined subjective-objective indicator system has higher data collection requirements, and objective indicators still rely on statistical data, which is subject to statistical data limitations, making it difficult to quantify well-being differences in small-scale spaces. Many scholars use this type of indicator system (Sandhu and Sandhu, 2014; Yang et al., 2015; Liu et al., 2022a); however, the response quality in these studies is closely related to the respondents’ levels of subjective willingness.
Human well-being is intricately linked to ecosystems, with the diversity and provision of ecosystem services serving as its foundation (Kosanic et al., 2020). While habitat diversity and species richness have been shown to be positively correlated with physical and mental health (Haahtela et al., 2013; Bernstein, 2014), the provision of ecosystem services also contributes to the quality of human life and socioeconomic development, while human well-being can contribute to the health of ecosystems (Mcgregor et al., 2009; Zhang et al., 2017). Regarding research methods, scholars both at home and abroad have been continuously attempting to quantify ecosystem services and human well-being in various ways and exploring the quantitative relationship between them (Wang et al., 2021a; 2023). Various studies have explored this relationship based on field surveys, questionnaire construction, and semistructured interviews (Kosanic et al., 2020). For instance, Adams et al. (2020) conducted a survey in the Khulna and Barisal districts of Bangladesh involving 1,586 local households. The survey covered topics such as the poverty situation of each household, life satisfaction, and household dependence on ecosystem services. The results revealed that the provision of ecosystem services to local residents reduces the incidence of poverty and minimizes the dissatisfaction with living standards. Ma et al. (2021) collected 618 questionnaires from the areas surrounding the Qinling Mountains. Through multiple linear regression, they found that more vegetation, cleaner water sources, and better air quality exert positive impacts on well-being. Rodrigues et al. (2022) conducted a questionnaire survey among local residents and tourists in a marine protected area in northern Spain. Factor analysis results showed that the nonmaterial services provided by the marine protected area, such as landscape-related services, have a positive impact on well-being. Clarifying the relationship between ecosystem services and human well-being is the basis for implementing control measures to achieve regional economic development and sustainable environmental development. In addition to incorporating ecosystem services into human well-being research through the construction of indicator systems, the quantitative study of the relationship between ecosystem services and human well-being remains in the exploratory stage. Yang et al. (2015) proposed a new factor analysis method that combines theoretical design and data mining techniques and uses structural equation modeling to construct a single indicator that represents multiple dimensions and enables flexible weight settings. Yang et al. (2021a) and Liu et al. (2018) used the Human Development Index and ecosystem service value to represent regional well-being and the value of services, respectively, and explored the relationship between ecosystem services and residents’ well-being through the use of geographically weighted regression and correlation analysis. Other studies have used carbon and nitrogen flow continuous ecosystem services and human well-being (Xu et al., 2019; Dong et al., 2021) to quantify regional ecosystem services and human well-being through carbon and nitrogen elements in an attempt to explain their complex relationship through correlation and change contribution methods. Wang et al. (2017) conducted a spatial partitioning of the combinations of ecosystem services and human well-being through cluster analysis and evaluated and discussed the characteristics of each partition in detail.
Although the above studies have quantitatively studied the relationship between ecosystem services and human well-being, they are still in the exploratory stage and use relatively simple statistical methods, primarily including regression and correlation analyses, and they are strongly subjectivity, lacking in objective data support. Moreover, there is still a lack of research on determining the causal relationships and trade-offs between ecosystem services and the well-being of different social groups or stakeholders. Outeiro and Villasante (2013) used statistical analysis to conclude that different service trade-offs have different impacts on regional human well-being, and the same services have different impacts on the well-being of different groups, so studying the impact of ecosystem services on the well-being of different groups in the same region is of great importance. In terms of spatial scale, most of the research on ecosystems and human well-being has been focused on the national and sub-national levels, while studies at the urban and township scales are relatively scarce (Liu et al., 2022b). In terms of application, ecosystem services and human well-being have been used in the related research on sustainable development and management (Wood and Declerck, 2015). Human adaptability, natural system vulnerability, and resilience are crucial elements for sustainable development. Strengthening the research into the multi-dimensional well-being and ecosystem service relationships in typical regions, such as ecologically vulnerable areas, ecological poverty alleviation development areas, and characteristic agriculture and animal husbandry advantage areas, is of practical significance for promoting regional spatial optimization, adjustment, and sustainable management (Wood et al., 2018; Fu, 2020). Some studies have already incorporated ecosystem services into regional development planning (Wang et al., 2017; Che et al., 2021; Chen et al., 2021). Examples of this include establishing an ecological compensation mechanism based on the value of ecosystem services (Zheng et al., 2013), or combining expert suggestions with the supply of ecosystem services to formulate regional planning (Bai et al., 2018). However, most of the existing regional planning cases only consider the supply of ecosystem services or the well-being of residents, while few consider the supply and demand of ecosystem services and the simultaneous well-being of different groups in the region, thus failing to enable the harmonious relationship among ecosystem services, human well-being and the well-being of multiple groups, especially in small-scale studies. The relationship between the supply of ecosystem services and the needs of different groups and regions is critical for understanding the interaction between ecosystem services and human well-being. We chose to conduct research in a typical area with a good combination of both animal husbandry and ecological advantages. For this study, field surveys were conducted to obtain objective data from various statistical yearbooks in the study area and a large number of questionnaires were collected from different townships and groups. A coupled coordination model and hierarchical clustering analysis were used to examine Seni district and its township regions, increasing the reliability of the results. Conducting an in-depth analysis of different partitions leads to more practical results, which can provide better support for local decision-making departments at all levels in formulating more targeted policies and plans for ecological protection and livelihood improvement.
The Qinghai-Tibet Plateau, which is situated in southwestern China, is a vital component of China’s ecological security barrier. The plateau plays a significant role in water conservation, regional biodiversity protection, carbon sequestration, and oxygen release (Chen et al., 2022a; Zhang et al., 2022a). However, its unique environmental conditions render it ecologically fragile, and it exhibits a slow recovery rate after damage (Zhao et al., 2020; Shen et al., 2022). It is one of the most climate-sensitive regions in the world studies indicate that the Qinghai-Tibet Plateau’s total population has grown rapidly, with the populations of Qinghai and Tibet provinces increasing nearly five times and nearly three times, respectively, compared to those numbers at the country’s founding (Qi et al., 2020). This rapid population growth and sharp increase in economic activities have led to a sharp increase in environmental pressure. Thus, integrating ecosystem services and the human well-being of the Qinghai-Tibet Plateau with sustainable development management is crucial for maintaining the stability of ecologically vulnerable areas (Liu et al., 2022c). The Seni district of Nagqu city, which is located in the central area of the Qinghai-Tibet Plateau, is a key ecologically vulnerable region that has managed to strike a balance between pastoralism and ecology, making it an ideal representative area in Tibet for poverty alleviation and livestock development. With an extremely high average altitude, Seni district is an ecologically fragile traditional Tibetan area. Currently, there are no research cases focused on local ecosystem services and resident well-being. This study takes Seni district as the research subject, thus emphasizing the development of high-altitude pastoral areas in the Qinghai-Tibet Plateau that can be used to maintain both ecological health and human well-being. In the future, Seni district must continue to improve resident lives while protecting the ecology and fulfilling the mission of ecological conservation areas.
This study is focused on Seni district as the research area, and is aimed at quantitatively assessing the region’s overall ecosystem services and both objective and subjective human well-being while exploring the developmental relationship between them. Furthermore, a zoning assessment of the relationship between ecosystem services and human well-being is conducted at the township scale in Seni district. The research is aimed at providing targeted support for the formulation of ecological protection and livelihood improvement policies and planning by decision-making departments at all levels in Seni district.

2 Study area and data

2.1 Overview of the study area

Seni district, situated in the eastern part of Nagqu city on the Tibetan Plateau (30°30′- 31°50′N, 91°10′-93°00′E), contains 3 towns and 9 townships. It serves as the political, economic, cultural, transportation, information, and communication center of Nagqu city. The elevation in Seni district ranges from 4118 m to 6615 m, with relatively flat terrain in the northern part, such as that of Namqie township, and high mountains in the southern part, including Gulu, Youqia, and Sexiong townships. Although the water and heat conditions of Seni are not as good as those of Jiali county in the east, they are better than those of all the counties in the western part of Nagqu. The average annual temperature is approximately -2℃, and the annual precipitation is above 400 mm. Extensive grasslands, predominantly alpine meadows, cover approximately 73% of the region. As it is unsuitable for agricultural development (Hua et al., 2013), Seni district is a purely pastoral area known as the hometown of Chinese yaks. On December 31, 2019, the district was selected as a national rural innovation and entrepreneurship model county exhibiting rapid and healthy economic and social development, and it was incorporated into the “Lhasa 3-hour Economic Circle.” Due to the high altitude of the southern townships of Seni, the high-quality pastures are concentrated in the central and northern townships, such as Nagqu, Luoma, and Namqie. The district has convenient transportation, with access to the Qinghai-Tibet Railway, G317 National Highway, G109 National Highway, and S302 Provincial Highway. In 2021, the total road mileage increased to 1,710.73 kilometers, the levels of road accessibility, village connectivity, and smoothness rates in townships steadily improved. Simultaneously, Seni district has a relatively large urban population and herder population, primarily comprising Tibetans, which is conducive to conducting field research. With consideration placed on transportation and data acquisition requirements, this study is focused on the quantitative assessment of ecosystem services and human well-being in Seni district (Figure 1).
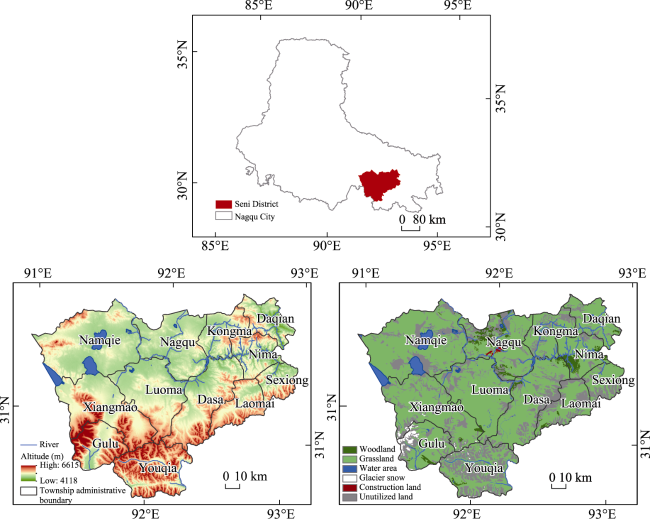
Figure 1 Location of Seni district within Nagqu city and the elevation and land use types in Seni district

2.2 Data sources

The data used in this study primarily include environmental factor data, questionnaire survey data, and socioeconomic statistical data taken from Seni district. Environmental factor data comprise land use data using a 30 m resolution for the years of 2000, 2010, and 2018, soil type data, and administrative division data for Seni district, which were all obtained from the Chinese Academy of Sciences Resource and Environment Data Center (http://www.resdc.cn/). The temperature and precipitation data taken from the China Meteorological Administration’s CN05.1 gridded observation dataset were used for various years (Wu and Gao, 2013). The sunshine duration data were obtained from the China Meteorological Science Data Sharing Service Network (http://data.cma.cn/). The soil texture, soil organic matter content, and soil bulk density data were acquired from the Food and Agriculture Organization (FAO) World Soil Database and the National Qinghai-Tibet Plateau Scientific Data Center (http://data.tpdc.ac.cn) (Dai and Shangguan, 2019). The elevation data were obtained from the Geospatial Data Cloud (www.gscloud.cn/), road data from the National Basic Geographic Information Center’s Open Street Map database (https://www.webmap.cn/), and the NDVI data were taken from the MOD13Q1 dataset provided by the US Geological Survey (USGS) Land Processes Distributed Data Archive Center (http://lpdaac.usgs.gov/). Other basic data and their detailed sources can be found in Table 1. The questionnaire survey data were derived from a field survey conducted in Seni district, Nagqu city, in July 2021, during which grassroots communities, townships, villages, and residential areas in Seni district were visited in depth. The socioeconomic statistical data mainly come from the “2019 Nagqu Regional Statistical Yearbook”, and a large number of long-time series statistical data reflecting the actual well-being of Seni district were obtained from various major departments in Nagqu city during field research.
Table 1 Detailed sources and data overview of the basic data used in this paper
Data type Specific data Data source Available
time series
Resolution
Land use Land use data Resources and Environmental Science Data Center, CAS
(http://www.resdc.cn/)
2000, 2010, 2018 30 m
Soil type Soil type spatial distribution data 1:1 million Soil Map of the People’s Republic of China
(http://www.resdc.cn/)
1995 1000 m
Soil properties Soil sand, silt, clay content, organic carbon content, soil depth data Chinese soil dataset based on the World Soil Database
(http://data.tpdc.ac.cn)
2009 1000 m
Administrative divisions City, county, township-level administrative division data Resources and Environmental Science Data Center, CAS
(http://www.resdc.cn/)
2015 Shapefile
Meteorology Temperature, precipitation data China Meteorological Administration CN05.1 Gridded Observation Dataset 1961-2020 0.25°
Sunshine hours data Meteorological station data (http://data.cma.cn/) 1951-present Station data
Elevation Elevation data Geospatial Data Cloud
(www.gscloud.cn/)
2011 30 m
NDVI MOD13Q1 data U.S. Geological Survey (USGS) Land Processes Distributed Data Active Center (http://lpdaac.usgs.gov/) 2000-present 250 m
Roads, rivers, lakes National and provincial roads, railways, rivers, lakes data Open Street Map dataset (https://www.openstreetmap.org) 2014-present Shapefile
Population Population density data WorldPop’s population density dataset (https://www.worldpop.org/) 2000-present 100 m
GDP GDP spatial distribution data Resources and Environmental Science Data Center, CAS
(http://www.resdc.cn/)
2000, 2005, 2010, 2015, 2019 1 km

3 Methods

3.1 Construction and evaluation of the human well-being indicator system

To more accurately assess the well-being of residents in Seni district, the local conditions of Seni district and the Millennium Ecosystem Assessment (MA) classification of human well-being (Reid et al., 2005) are combined and used as the basis of this study. Multiple ecological environment-related specific indicators have been added to form Seni District Human Well-being Indicator System for Nagqu city. This system is divided into two parts, namely, objective and subjective indicators. The objective indicators are subdivided into 10 specific indicators based on three major areas: basic material needs, safety and health needs, and freedom of choice and action (Table 2). The subjective indicators are measured in the form of satisfaction, including income satisfaction, food acquisition satisfaction, living condition satisfaction, and transportation convenience satisfaction. Considering the relative difficulty in water use and extraction found during the field research, two subjective well-being indicators, namely, water accessibility satisfaction and water quality satisfaction (Table 3), were added for this study.
Table 2 Objective HW indicators for Seni district
Objective well-being domain Objective well-being indicator Data source
Income and consumption Per capita disposable income Seni District Statistics Bureau
Per capita GDP Nagqu Regional Statistical Yearbook
Consumer Price Index National Bureau of Statistics
Total agricultural and pastoral output value Nagqu Regional Statistical Yearbook
Basic needs Livestock mortality rate Nagqu Regional Statistical Yearbook
Per capita meat and dairy production Seni District Agriculture and Pasture Bureau
Per capita living area Tibet Statistical Yearbook
Per capita number of cars at the end of the year Nagqu City Statistics Bureau
Per capita telecommunications volume Nagqu City Statistics Bureau
Per capita liquefied petroleum gas supply in
urban areas
National Bureau of Statistics
Ecological safety Forest and grassland coverage rate Second calculation of Seni district land use data
Disaster-affected area ratio National Bureau of Statistics
Physical health Life expectancy China Population and Employment Statistical Yearbook
Number of hospital beds per 10,000 people Seni District Statistics Bureau
Population mortality rate Nagqu Regional Statistical Yearbook
Freedom of choice
and action
Number of primary and secondary school
students
Seni District Statistics Bureau
Proportion of employees with stable jobs Nagqu City Statistics Bureau
Urban registered unemployment rate National Bureau of Statistics
Social relations Proportion of urban employees participating in pension insurance National Bureau of Statistics
Divorce rate National Bureau of Statistics
Civil case closure rate Seni District Statistics Bureau
Table 3 Subjective HW indicators for Seni district
Subjective well-being domain Subjective well-being indicator Data source
Material needs Income satisfaction Questionnaire
Water accessibility satisfaction Questionnaire
Food acquisition satisfaction Questionnaire
Living condition satisfaction Questionnaire
Information acquisition satisfaction Questionnaire
Transportation convenience satisfaction Questionnaire
Safety and health Water quality satisfaction Questionnaire
Air quality satisfaction Questionnaire
Soil quality satisfaction Questionnaire
Public security satisfaction Questionnaire
Physical health satisfaction Questionnaire
Medical facilities satisfaction Questionnaire
Freedom of choice and action Education rights satisfaction Questionnaire
Job selection satisfaction Questionnaire
Social relations Satisfaction with harmonious relationships among family members and neighbors Questionnaire
The subjective questionnaire collected the satisfaction levels of Seni district residents for each well-being indicator, which each had five response options: very dissatisfied, dissatisfied, neutral, satisfied, and very satisfied. The Likert method was employed to quantify the satisfaction scores, assigning 1 point for very dissatisfied, 2 points for dissatisfied, 3 points for neutral, 4 points for satisfied, and 5 points for very satisfied. Field research was conducted in 3 randomly selected natural villages in each of the 12 town-level units (Nagqu town, Namqie town, Youqia township, Xiangmao township, Gulu town, Luoma town, Dasa township, Laomai township, Daqian township, Nima township, Sexiong township, and Kongma township), for a total of 36 villages. A total of 501 high-quality paper questionnaires and 119 high-quality electronic questionnaires were collected, including responses from both urban residents and herders in Seni district. The distribution of questionnaire survey locations in Seni district and the basic information of the respondents can be found in Figure 2 and Table 4.
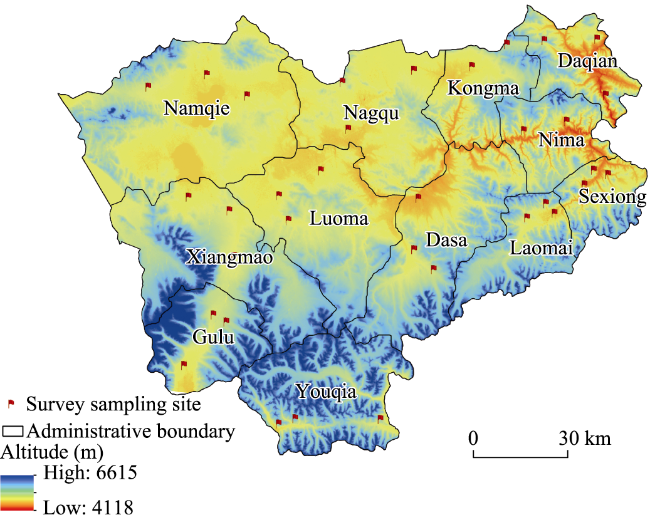
Figure 2 Distribution of field questionnaire survey locations in Seni district
Table 4 Comparison of characteristics of respondents in Seni district with official data
Characteristic Category Number Percentage Official data Official data source
Gender Male 433 69.84% 50.34% 2019 Nagqu Regional Statistical Yearbook
Female 187 30.16% 49.66% 2020 Nagqu Regional Statistical Yearbook
Age 15-59 580 93.50% 59.18% Nagqu City 7th National Population Census Main Data Bulletin
60-64 21 0.34% 1.96% Nagqu City 7th National Population Census Main Data Bulletin
≥65 17 2.74% 4.69% Nagqu City 7th National Population Census Main Data Bulletin
Ethnicity Tibetan 603 97.30% 96.25% Nagqu City 7th National Population Census Main Data Bulletin
Han 16 2.60% 3.10% Nagqu City 7th National Population Census Main Data Bulletin
Other 1 0.20% 0.65% Nagqu City 7th National Population Census Main Data Bulletin
Education level Primary school and below 327 52.74% 55.57% Nagqu City 7th National Population Census Main Data Bulletin
Junior high school 121 19.52% 22.80% Nagqu City 7th National Population Census Main Data Bulletin
High school or vocational high school 93 15.00% 6.83% Nagqu City 7th National Population Census Main Data Bulletin
College and above 69 12.74% 14.80% Nagqu City 7th National Population Census Main Data Bulletin
Family population ≤2 31 5% 47.45% 2021 China Statistical Yearbook
3-5 349 56.40% 32.66% 2022 China Statistical Yearbook
≥6 240 38.71% 19.89% 2023 China Statistical Yearbook
The overall characteristics of the respondents are generally consistent with the overall characteristics of the residents in Seni district (Table 4). In terms of the gender ratio, among the 620 valid questionnaires, 433 were completed by males, which accounted for 69.84% of the total interviews. Official statistics show that there are 56,500 males in Seni district, accounting for 50.34% of the total population. In regard to age groups, the respondents are mainly between 15-59 years old, which is an age range that includes the largest proportion of residents according to the Nagqu city population census data. In terms of education level, 34.52% of the respondents had junior high school, high school, and vocational high school education levels, which is similar to the 29.63% that is recorded in the official population census. From an ethnic perspective, Tibetans accounted for 97.30% of the total number of respondents, and the official data show that the proportion of Tibetan residents in the area accounts for 96.25% of the total population, which is similar to the percentage of Tibetan survey respondents.

3.2 Ecosystem services assessment

Considering the actual situation of Seni district in Nagqu city, the importance of different categories of ecosystem services in Seni district, and the availability of data, a quantitative analysis of six ecosystem services in Seni district is conducted for this study. These services include livestock breeding services, soil conservation services, water production services, carbon sequestration services, habitat quality, and landscape recreation services. Livestock breeding is particularly important in the Qinghai-Tibet Plateau pastoral area (Zhan et al., 2023). The Seni district has a large area of alpine meadows and alpine steppes, and animal husbandry and livestock serve as the primary source of meat, milk, and other foods for local residents. Livestock and their by-products bring significant income to local residents. Seni district experiences high precipitation during the summer season, leading to an insufficient number of deep-rooted plants to result in soil stabilization. Deep roots are pivotal to many ecosystem services, such as pedogenesis, groundwater and streamflow regulation, soil carbon sequestration, and moisture content in the lower troposphere (Pierret et al., 2016). These services play different roles in regard to the major biochemical cycles that rely on their position within the soil profile. In regions characterized by significant topographical variations and steep slopes, the soil is particularly susceptible to erosion. Nagqu, where Seni district is located, is the source of many large rivers and tributaries in China and is an essential water source area (Yang et al., 2021b). Therefore, water production services were selected as an important indicator in this study. The large area of grassland in Seni district absorbs and fixes carbon in the atmosphere, thus playing a crucial role in the carbon cycle of the surrounding areas. The high-altitude terrain and cold climate nurture alpine grasslands and other ecosystems, providing the necessary habitats for a large number of species. The carbon sequestration service reflects vegetation growth, but it can also reflect the ability of vegetation in Seni district to fix carbon and release oxygen (Wei et al., 2021). The ecological environment of Seni district can serve as a landscape recreation service for tourists and residents. The specific evaluation model for each ecosystem service is developed based on relevant literature, data availability, and the unique characteristics of Seni district. This comprehensive assessment provides valuable insights into the ecosystem services of Seni district and contributes to the sustainable development of the region.
(1) Water production services
The water production services are calculated using the water yield module of the InVEST model, which is based on the Budyko water-heat coupling balance assumption. This model accounts for factors such as evapotranspiration, precipitation, and plant root depth to calculate the water yield of each grid. The formula is as follows:
$Y_{e}=\left(1-\frac{AET_{e}}{P_{e}}\right)\times P_{e}$
$\frac{AET_e}{P_e}=1+\frac{PET_e}{P_e}-\left[1+\left(\frac{PET_e}{P_e}\right)^{W_e}\right]^{\frac1{W_e}}$
where Ye represents the annual total water yield depth (mm) of grid e. AETe stands for the annual evapotranspiration (mm) of grid e. Pe denotes the annual precipitation (mm) of grid e. PETe refers to the annual potential evapotranspiration (mm) of grid e. Finally, we is an empirical parameter (Donohue et al., 2012) used to characterize the environment in which the grid is located.
$PET_e=K_r\left(l_e\right){\times}ET_{0_e}$
$w_e=Z\times\left(\min(Root.depth,Rest.layer.depth)\times PAWC_e\right)/P_e+1.25$
where ET0e represents the annual reference crop evapotranspiration of grid e, which is obtained through the Modified-Hargreaves method. Kr(le) is the evapotranspiration coefficient for different vegetation and land use types (Sharp et al., 2020). Root.depth denotes the vegetation root depth of each grid e (Canadell et al., 1996). Z is an empirical constant. PAWCe characterizes the available water content of vegetation in grid e. The calculation formula is based on the related research of Jing et al. (2022).
(2) Soil conservation services
Soil conservation services use the soil conservation module of InVEST. This module is used to calculate the final soil conservation of each grid unit in the study area based on factors such as topography, precipitation, and soil erodibility. The formula is as follows:
$SD_{s}=RKLS_{s}-USLE_{s}=R_{s}\times K_{s}\times LS_{s}\times\left(1-C_{s}\times P_{s}\right)$
where SDe represents the actual soil conservation of grid e (t·ha-1). RKLSe and USLEe are the potential and actual annual soil erosion of grid e (t·ha-1), respectively. Re and Ke denote the rainfall erosivity (MJ mm ha-1 h-1) and soil erodibility (t hah ha-1 MJ-1 mm-1) of grid e, respectively. Re is calculated based on the formula of Wischmeier and Smith (1978), and Ke is calculated based on the EPIC (Williams et al., 1983) formula and locally corrected using the modified formula. LSe is the slope and slope length factor of grid e (Sharp et al., 2020). Ce, which is the vegetation cover factor, is obtained by calculating the NDVI in accordance with previous research (Jing et al., 2022). Pe represents the soil and water conservation factor of grid e. The value determination process is based on previous studies (Chen et al., 2012; Fang et al., 2015).
(3) Carbon sequestration services
The CASA model is a commonly used method for evaluating regional net primary productivity (NPP) (Potter et al., 1993). In this study, the carbon sequestration services in the study area are simulated based on the improved CASA model of Zhu et al. (2005). This model is used to calculate the NPP of each grid point through data such as solar radiation, temperature, precipitation, and light energy utilization rate for each grid point. The formula is as follows:
$NPP_{s}=0.5\times R_{s}\times FPAR\times f_{1}\times f_{2}\times W\times e_{max}$
where NPPe represents the net primary productivity of vegetation at grid unit e (gC·m-2). Rs denotes the solar radiation received at grid unit s (MJ·m-2), which is calculated from sunshine hours. Rs multiplied by the empirical constant 0.5 approximately represents the solar radiation available to vegetation. FPAR stands for the proportion of photosynthetically active radiation that is converted by plants. f1 and f2 represent the effects of low temperature and high temperature on the plant light energy utilization rate, respectively. W is the water limitation factor, which accounts for the impact of water availability on plant growth and productivity. emax refers to the maximum light energy utilization rate of vegetation. The assigned values are based on the research findings of Zhu et al. (2006).
(4) Habitat quality
The InVEST habitat quality module is used to calculate habitat quality scores for each grid point in the study area based on land cover, threatened land use, and other factors. The scores range from 0 to 1, with larger values indicating better habitat quality (Sharp et al., 2020). Finally, based on the characteristics of the study area, major threats to habitat quality were selected, including national highways, various types of construction land, and unused land such as bare land, railways, and cultivated land. The formula is as follows:
$Q_{e r}=H_{r}\left[1-\frac{D_{e r}^{z}}{D_{e r}^{z}+k^{z}}\right]$
$D_{e r}=\sum_{t=1}^{T} \sum_{p=1}^{P_{t}}\left(\frac{w_{t}}{\sum_{t=1}^{R} w_{t}}\right) r_{p} i_{t e p} S_{r t}$
where Qer represents the habitat quality of grid e. Hr denotes the habitat suitability of land use type r. Der stands for the degree of habitat degradation in grid e. T and Pt are the number of threat factors and the total number of grid points, respectively. wt indicates the threat weight of each threat factor. itep refers to the threat degree that the threat capacity rp of the threat factor will cause to grid e. Srt is the response sensitivity of land use type r to the impact of individual threat Factor t. The determination of each parameter takes into account expert opinions, as well as the habitat quality module manual and parameter settings for similar research areas (Shui et al., 2018; Zhang et al., 2020; Zhu et al., 2020).
(5) Landscape recreation services
There have been many studies that have estimated the landscape recreational service values of agricultural fields, wetlands, rivers, urban green spaces, and forests (Hermy et al., 2008; Van Berkel and Verburg, 2014; Gandarillas et al., 2016; Rall et al., 2019; Yang and Cao, 2022). Further, the grasslands and rivers in the study area can serve as landscape recreation services for tourists and residents. The quantification of landscape recreation services in the study area is based on township-level administrative division data combined with the high-resolution land use data of 2000, 2010, and 2018. Forests, high-coverage grasslands, rivers, and lakes are considered the main landscapes. The proportion of landscape land use within each administrative unit is calculated to quantify the landscape recreation services in the study area at the township scale.
(6) Livestock Breeding Services
Seni district is one of the main pastoral areas on the Qinghai-Tibet Plateau. Large livestock serve as the main source of meat, milk and other food for the residents of Seni district, Nagqu city. Moreover, local residents mainly rely on the sale of agricultural and livestock products to make a living. The quantification of livestock breeding services is accomplished through the use of administrative division data and statistical data. The collected data on the livestock breeding situation in various towns and villages of Seni district in 2000, 2010, and 2018 are overlaid with the township-level administrative divisions of Seni district to obtain the livestock breeding volume for each town and village in the corresponding years, which is used to characterize the livestock breeding services in the region. The largest number of livestock raised locally in Seni district is yaks, followed by a certain number of sheep, goats, and a small number of horses. To facilitate standardized calculations, according to the “Calculation Standards for Reasonable Livestock Carrying Capacity of Natural Grasslands,” the number of various types of livestock in Seni district is converted into the same unit through conversion coefficients. That is, one yak is equivalent to four sheep, five goats, and two-thirds of a horse. In this article, the number of livestock raised in each administrative unit of Seni district is measured in terms of yaks.

3.3 Synergistic development model of ecosystem services and human well-being

3.3.1 Analytic hierarchy process for weight assignment

The analytic hierarchy process (AHP) can be used to calculate the weight of indicators through a combination of qualitative and quantitative analysis, making it a method combining both subjective and objective perspectives. Therefore, based on the actual situation of Seni district, the importance of different categories of ecosystem services in Seni district, as well as the availability of data, is comprehensively considered in this study, and an indicator system is constructed using the objective well-being indicators and ecosystem service indicators for Seni district in 2000, 2010, and 2018. In the objective well-being indicators, aside from livestock mortality rate, disaster-affected area ratio, population mortality rate, urban registered unemployment rate, and divorce rate, the objective well-being indicators and ecosystem service indicators are all positive. The higher that their values are, the stronger the level of human well-being and ecosystem service functions in Seni district. To eliminate the impact of different dimensions, the interquartile range normalization method is used for processing, and the weights of each indicator are obtained as shown in Tables 5 and 6:
Table 5 Indicator system for evaluating the HW of residents in Seni district
Indicator Unit Attribute Weight
Per capita disposable income yuan/person Positive 0.1787
Per capita GDP yuan/person Positive 0.0770
Consumer Price Index Base year = 100 Positive 0.0290
Total output value of agriculture and animal husbandry 10,000 yuan Positive 0.0184
Livestock mortality rate % Negative 0.0156
Per capita total production of meat and dairy tons/10,000 people Positive 0.0392
Per capita living area m2/person Positive 0.1605
Per capita actual number of cars at year-end Vehicles/10,000 people Positive 0.0341
Per capita telecommunications business volume yuan/person Positive 0.0217
Urban per capita supply of liquefied petroleum gas 10,000 tons/10,000 people Positive 0.0144
Forest and grassland coverage rate % Positive 0.0188
Disaster-affected area ratio % Negative 0.0203
Life expectancy Years Positive 0.0766
Number of hospital beds per 10,000 people Beds/10,000 people Positive 0.0701
Population mortality rate % Negative 0.0303
Number of primary and secondary school students People Positive 0.0190
Proportion of workers with stable jobs % Positive 0.0638
Urban registered unemployment rate % Negative 0.0625
Proportion of urban employees participating in pension insurance % Positive 0.0055
Divorce rate % Negative 0.0191
Civil case closure rate % Positive 0.0255
Table 6 Indicator system for evaluating ES in Seni district
Indicator Unit Attribute Weight
Soil conservation service t·ha Positive 0.2143
Water yield service mm Positive 0.1163
Carbon sequestration service gC·m2 Positive 0.0968
Habitat quality Positive 0.1066
Livestock breeding service 10,000 heads Positive 0.2561
Landscape recreation service % Positive 0.2099
After obtaining the weights of each indicator, we can calculate the comprehensive evaluation value. Multiply the weight value of each evaluation indicator by the indicator quantity and sum them to obtain the comprehensive evaluation value. The formula is as follows:
$U_{j}=\sum_{i=1}^{n} Q_{i j} r_{i j}, j=1,2, \cdots, m$
where Uj represents the comprehensive evaluation value of the j-th subsystem, Qij is the weight of the i-th indicator in the j-th subsystem, and rij is the normalized value of the i-th indicator in the j-th subsystem.

3.3.2 Calculation of the coupling coordination degree

The Coupling Coordination Degree model involves the calculation of three values, namely, the Coupling Degree value C, the Comprehensive Evaluation Index (Coordination Index) value T, and the Coupling Coordination Degree value D.
The Coupling Degree value C is an important numerical value for characterizing the degree of interaction between systems, with larger values indicating stronger interaction and mutual influence between the systems. Given n≥2 systems, with $U_{j} \in[0,1]$ denoting the standardized comprehensive evaluation value of the j-th system, the calculation formula is as follows:
$C=n \times\left[\frac{U_{1} U_{2}-U_{n}}{\left(U_{1}+U_{2}+\ldots+U_{n}\right)^{n}}\right]^{\frac{1}{n}}$
While the Coupling Degree effectively represents the interaction level between systems, it fails to distinguish whether these systems are mutually beneficial at high levels or mutually restrictive at low levels. To address this, we introduce the Coupling Coordination Degree value D to calculate the level of coordinated development between the systems. The calculation formula is provided in Equation (11), where αi denotes the weight coefficient for the i-th subsystem, and $U_{j} \in[0,1]$ signifies the standardized comprehensive evaluation value for the j-th system. In this study, n=2, and based on expert input, both systems are deemed equally significant, resulting in $\alpha_{1}=\alpha_{2}=0.5$.
$D=\sqrt{C \times T}, T=\alpha_{1} U_{1}+\alpha_{2} U_{2}+\cdots+\alpha_{n} U_{n}, \alpha_{1}+\alpha_{2}+\cdots+\alpha_{n}=1$
In terms of coupling coordination classification, this study draws from prior research and categorizes the Coupling Coordination Degree D between ecosystem services and human well-being into 10 levels. By referencing the three primary categories of coupling, we formulate the classification criteria for coupling and coordination levels (Table 7).
Table 7 Classification criteria for coupling and coordination levels
Coupling coordination degree (D) value interval Coordination level Coupling coordination degree
(0.0-0.1) 1 Extremely uncoordinated
[0.1-0.2) 2 Severely uncoordinated
[0.2-0.3) 3 Moderately uncoordinated
[0.3-0.4) 4 Mildly uncoordinated
[0.4-0.5) 5 Borderline uncoordinated
[0.5-0.6) 6 Barely coordinated
[0.6-0.7) 7 Elementary coordinated
[0.7-0.8) 8 Intermediate coordinated
[0.8-0.9) 9 Well coordinated
[0.9-1.0) 10 High-quality coordinated

3.4 Spatial clustering analysis of ecosystem services and human well-being

Considering the diverse impacts of different survey indicators on human well-being, questionnaire surveys are employed to acquire the importance scores for each well-being item from the respondents in this study, which are then used to calculate the weights. The final weight results are depicted in Figure 3, from which the ultimate weighted score of human well-being is determined. The subjective well-being indicator weight assignment used in this study relies on the questionnaire content. Respondents are asked to rate the importance of each well-being indicator listed in Table 3 on a scale of 1-10, with higher scores indicating greater levels of importance attributed to that particular well-being item. The final weight results are derived by aggregating the respondent scores. The human well-being assessed in this study encompasses various aspects of residents’ lives and represents a multi-indicator comprehensive evaluation. Consequently, the well-being evaluation employs a comprehensive assessment method involving the multiplication of the satisfaction level of each well-being item by its weight and then summing them to obtain the overall well-being level. The final well-being score is calculated using the following formula:
$Q=\sum_{d-1}^{h} W_{d} Q_{d}$
where Wd represents the weight of the d-th well-being indicator; Qd denotes the score of the d-th well-being indicator; h corresponds to the number of indicators; and Q signifies the final well-being score.
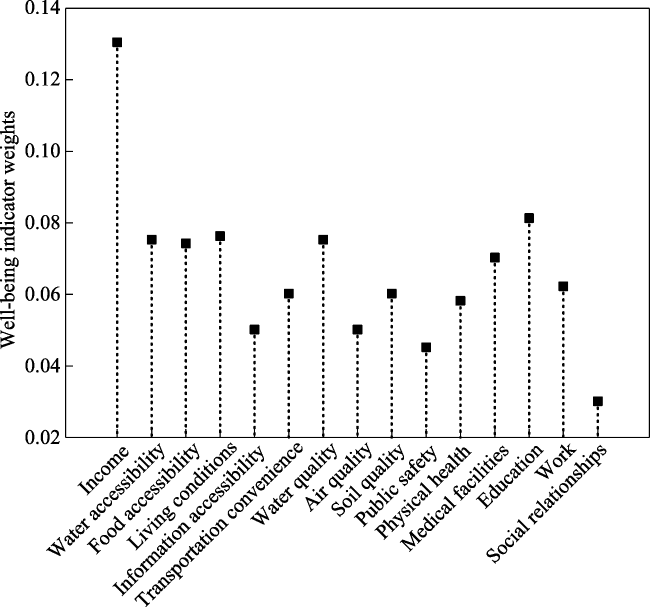
Figure 3 Weights of HW indicators in Seni district
Using townships as units, we apply extreme difference normalization to the levels of various ecosystem services and comprehensive human well-being in the townships of Seni district in 2018. We subsequently conduct hierarchical clustering analysis on the levels of diverse ecosystem services and comprehensive human well-being across the 12 town-level units in Seni district. The clustering distance between the data points is calculated using Euclidean distance. The clustering outcomes are illustrated through a dendrogram that was created with Origin 2021 software. Additionally, the characteristics of ecosystem services in each region are depicted using radar charts, while the features of comprehensive human well-being in each region are demonstrated using box plots. The classification and distribution of the regions within Seni district are presented using ArcGIS 10.3 software.

4 Results and analysis

4.1 Spatiotemporal patterns of ecosystem services in Seni district

Figure 4 displays the spatial distribution patterns of various ecosystem services in Seni district. Throughout the study period, townships in the southeast exhibited a higher concentration of water production services than those in other regions. Soil conservation services with high values were predominantly found in undulating mountainous areas, which are mainly located in the southern and eastern parts of Seni district. Carbon sequestration services were relatively evenly distributed across the region, with the highest levels observed in Nagqu and Luoma towns, which are situated in the central part of the district.
Figure 4 Spatiotemporal patterns of ES in Seni district from 2000 to 2018
The spatial pattern of water production services in Seni district generally exhibits higher levels in the southeast than in the northwest. In 2018, the average water production depth in Seni district was 342.11 mm. Southeastern townships, such as Youqia, Laomai, Sexiong, and Dasa, experienced water production depths in excess of 400 mm, which reached 444.24 mm, 437.21 mm, 415.93 mm, and 404.89 mm, respectively. In contrast, northern townships such as Nagqu and Namqie had lower depths of 288.10 mm and 224.29 mm in 2018. The southeast’s topography is generally lower but features numerous mountains and steep terrains, which block warm, humid air masses from advancing northward in the summer, leading to increased precipitation. The sparse high-altitude vegetation in this area results in reduced evapotranspiration and exerts an impact on other hydrological processes, yielding higher water production. The temporal trends in water production services across Seni district’s townships are consistent, displaying a pattern of an initial decrease followed by an increase.
The high-value areas of soil conservation per unit area in Seni district are mainly concentrated in the river valley areas of the southern and eastern townships, while the low-value areas are mainly concentrated on the hilly plains of the central and northern parts. In 2018, the average soil conservation per unit area in Seni district was 71.11 t·ha-1. Mountainous townships such as Youqia, Gulu, Daqian, and Nima exhibited values much higher values than the district average, reaching 182.67 t·ha-1, 139.01 t·ha-1, 134.83 t·ha-1, and 134.79 t·ha-1, respectively. Conversely, hilly plain areas such as Luoma, Nagqu, and Namqie in the central and northern parts had values of 31.65 t·ha-1, 23.16 t·ha-1, and 18.81 t·ha-1 in 2018, respectively. The temporal trends of soil conservation services across Seni district’s townships remained consistent, following an initially decreasing and subsequently increasing pattern, with the soil conservation per unit area in each township in 2018 being higher than that in 2000.
In 2018, Seni district’s carbon sequestration per unit area reached 455.79 gC·m-2, which was significantly higher than the city average. The low-value areas for carbon sequestration services were mainly concentrated in high mountain areas, with Youqia and Gulu towns having average capacities of 337.80 gC·m-2 and 345.14 gC·m-2 in 2018, respectively, while Nagqu and Luoma towns reached 556.51 gC·m-2 and 525.37 gC·m-2, respectively. The temporal trends of carbon sequestration services across Seni district generally increase, aside from those in Laomai, Youqia, and Sexiong townships, which display a pattern of initial increase followed by a decrease. Overall, carbon sequestration services in Seni district are increasing yearly.
In 2018, Seni district’s habitat quality score was 0.43, which was approximately 16% higher than the city average. The low-value areas for habitat quality are concentrated in Youqia, Sexiong, and Laomai townships, which are characterized by high mountains and complex terrains that limit vegetation growth. These areas lack large, high-quality grasslands, resulting in habitat quality scores of 0.31, 0.29, and 0.27, respectively, for each of the three townships in 2018. Temporal trends in habitat quality across Seni district’s townships are not significant and remain generally stable. However, Nagqu town experienced a noticeable downward trend in habitat quality from 2000 to 2018, which was possibly related to the urban and road construction in Nagqu city in recent years.
Seni district’s landscape recreation services surpass the city average, mainly due to the extensive area of high-quality grasslands with high coverage. These grasslands are concentrated in the high plains and hilly areas of the Seni district. Nagqu, Dasa, and Xiangmao townships had the highest proportions of landscape land use, at 32.43%, 32.02%, and 30.32%, respectively, in 2018. In southern townships, complex terrains and high mountains restrict vegetation growth, making the provision of landscape land for regular recreation challenging. The proportion of landscape land use in Seni district’s townships remained stable from 2000 to 2018 and underwent no significant changes.
In 2018, Seni district’s total livestock count reached approximately 490,300, with high livestock breeding areas concentrated in the central and northwestern parts. Namqie, Nagqu, Dasa, and Luoma towns had livestock populations of 84,300, 70,600, 62,900, and 61,400, respectively, in 2018, while lower livestock populations in Youqia, Sexiong, and Laomai townships had only 17,700, 16,200, and 14,200 livestock, respectively, in 2018. The number of livestock in Seni district’s townships declined from 2010 to 2018, with the total livestock count in the district decreasing by approximately 10.44% compared to that in 2010.

4.2 Differences in well-being levels among different groups in Seni district

In Seni district, the urban population constitutes approximately 1/4 of the total population, while the rural population makes up approximately 3/4. Due to altitude and climate limitations, Seni district is unable to develop agriculture based on crop cultivation. Rural residents primarily depend on animal husbandry and related industries for their livelihoods. Consequently, there is a notable difference in subjective well-being levels between the urban residents and herders in Seni district, as illustrated in Figure 5.
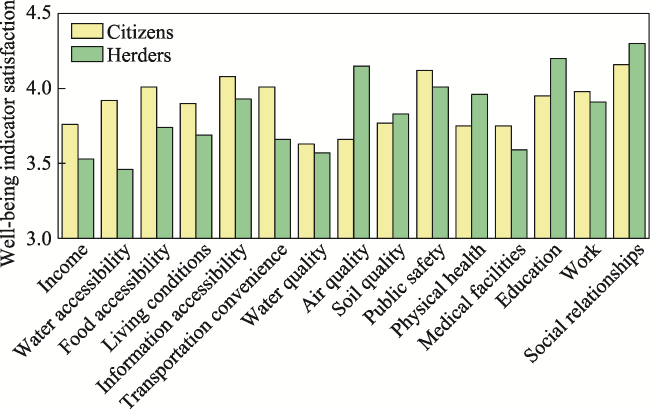
Figure 5 Differences in subjective HW between urban residents and herders in Seni district
As depicted in the figure, urban residents in Seni district exhibit significantly higher satisfaction levels than herders in regard to income, water convenience, food access, living conditions, information access, transportation convenience, and medical facilities. Regarding income, both urban residents and herders have relatively low satisfaction levels. Many urban residents possess stable wage income and some wealth accumulation, while herders’ income is influenced by agricultural product yield and prices, resulting in lower and unstable income levels. Consequently, urban residents’ well-being levels in terms of income are slightly higher than those of herders. In terms of water convenience, Seni district’s urban areas benefit from a convenient tap water supply, while herders mainly rely on wells or rivers, which are greatly affected by climate. This disparity may lead to higher well-being levels for urban residents in this regard. Urban residents have higher satisfaction levels in regard to food access than herders in Seni district, which may be attributed to the same reasons leading to those in regard to water convenience, as urban residents have a clear advantage in their access to fresh vegetables and fruits compared to herders. Concerning living conditions, urban housing predominantly consists of brick-concrete and reinforced concrete structures, while many houses in pastoral areas still use earth and wood materials. The overall living environment of urban housing is significantly better than that of pastoral areas, resulting in higher well-being satisfaction levels for urban residents in this aspect than those for herders. In terms of information access, both urban residents and herders exhibit relatively high satisfaction levels, with urban residents having slightly higher satisfaction levels than herders. Regarding transportation convenience, the well-being satisfaction of urban residents in Seni district is significantly higher than that of herders. Seni district has a vast territory but a sparse population, and herders living in rural areas are relatively far from urban areas and live in more dispersed locations, which is why herders have lower well-being satisfaction levels in this aspect compared to those of urban residents.
In terms of air quality and physical health, herders in Seni district exhibit significantly higher well-being satisfaction levels than urban residents. Concerning air quality, the population concentration in urban areas leads to the accumulation of a large amount of exhaust gas generated from production and daily life, resulting in poorer air quality compared to that of rural areas. Consequently, the well-being of urban residents from this perspective is lower than that of herders. Regarding medical facilities, urban residents have higher satisfaction levels than herders, as urban areas have more medical facilities, equipment, and professional personnel than rural areas. However, in terms of physical health well-being satisfaction, herders have higher satisfaction levels than urban residents. This difference may be attributed to a greater attention of urban residents to their own health issues and a relatively healthier lifestyle of herders in comparison to that of urban residents.
In addition, both urban residents and herders have low satisfaction levels with water quality indicators, with most residents believing that the water quality of their daily life is relatively average. There is not much difference in satisfaction levels between urban residents and herders regarding soil quality. In terms of public safety, both urban residents and herders have relatively high well-being satisfaction levels. Concerning education, both urban residents and herders in Seni district have relatively high satisfaction scores, with herders’ levels being slightly higher than those of urban residents. This difference may be because urban residents have higher expectations for their children’s education and hope that they can receive higher levels of education. In terms of work satisfaction, the urban residents in Seni district have slightly higher levels than herders, which may be due to more job opportunities in urban areas than in rural areas. Seni district’s urban residents and herders have the highest satisfaction levels in terms of good social relations, with scores of 4.16 and 4.30, respectively.

4.3 Coupling and coordinated evolution characteristics of ecosystem services and human well-being in Seni district

The changes in objective well-being in Seni district over the period from 2000 to 2018 are shown in Table 8. Compared to the initial year, the well-being levels of residents in terms of basic material needs, including income and material acquisition, significantly increased in 2018. For instance, the per capita disposable income nearly tripled, increased from 1,801 yuan in 2000 to 6,955.41 yuan in 2018; the per capita meat and dairy consumption increased by 79.96% in 2018 compared to 2000; the per capita living area increased from 23.16 m² in 2000 to 38.58 m² in 2018, representing an increase of 66.58%; the per capita car ownership and per capita telecommunications services increased rapidly in recent years, growing by 898.81% and 3,117.91%, respectively, between 2000 and 2018. These positive changes reflect the long-term, stable improvement of resident economic well-being and basic material needs in the study area in recent years. In terms of safety and health, forest and grassland coverage in the study area remained stable; the population mortality rate decreased by 43.16% from 2000 to 2018; life expectancy and the number of medical and health institution beds per 10,000 people showed an increasing trend, reflecting significant progress in the well-being of residents in regard to the medical and health fields. In the domain of choice and action freedom, the number of students in schools steadily increased from 6,759 in 2000 to 12,647 in 2018, exhibiting an increase of 87.81%, which reflects the growing emphasis on education by residents in the study area and the national focus on education issues in the Tibetan region; the urban registered unemployment rate decreased by 31.71% compared to that in the initial year, and the proportion of people with stable jobs increased from 3.73% in 2000 to 7.79% in 2018, with an increasing number of residents in the study area having a stable wage income. In the domain of good social relations, the civil case closure rate remained above 90% and reached 100% closure; the proportion of urban employees participating in pension insurance increased significantly, with a change rate of 282.66% compared to that in the initial year; at the same time, the divorce rate in the study area steadily decreased, dropping by 34.02%, and social relations tended improve.
Table 8 Changes in objective HW in Seni district from 2000 to 2018
Objective well-
being domain
Objective well-being
indicator
Unit 2000 2010 2018 Change rate (Initial-2018)
Income and consumption Per capita disposable income yuan/person 1,801 3398.12 6955.41 286.20%
Per capita GDP yuan/person 4480.21 20,214.81 51,605 1051.84%
Consumer Price Index Last year=100 99.9 102.2 101.7 1.80%
Total agricultural and pastoral output 10,000 yuan 8873.99 21,544.88 39,012.07 339.62%
Basic needs Livestock mortality rate % 6.13 0.92 1.42 -76.84%
Per capita meat and dairy production tons/10,000 people 1392.98 1947.51 2506.86 79.96%
Per capita living area m2/person 23.16 24.03 38.58 66.58%
Per capita car ownership Vehicles/10,000 people 99.75 498.74 996.34 898.81%
Per capita telecommunications services yuan/person 26.53 729.73 853.56 3117.91%
Urban LPG per capita supply 10,000 tons/10,000 people 11.93 1.53 2.17 -81.81%
Ecological safety Forest and grassland
coverage
% 0.57 0.56 0.67 18.04%
Disaster-affected area percentage % 46.88 43.27 82.47 75.92%
Physical health Life xpectancy Years 64.37 68.17 70.6 9.68%
Number of hospital beds per 10,000 people Beds/10,000 people 5.3 2.86 19.23 262.89%
Population mortality rate % 7.9 4.38 4.49 -43.16%
Choice and
action freedom
Number of students in primary and secondary schools People 6759 12,184 12,647 87.11%
Proportion of workers
with stable jobs
% 3.73 7.33 7.79 108.89%
Urban registered
unemployment rate
% 4.1 4 2.8 -31.71%
Social relations Proportion of urban
employees participating
in pension insurance
% 25.95 30.63 99.3 282.66%
Divorce rate % 18.52 15.38 12.22 -34.02%
Civil case closure rate % 91 99 100 9.89%
Integrating the results of the ecosystem service calculations from Section 4.1, the comprehensive evaluation values of ecosystem services and human well-being in Seni district are displayed in Table 9. According to the coupling and coordination degree calculation results (Figure 6 and Table 10), the coupling and coordination relationship between ecosystem services and resident well-being in Seni district exhibited a significant increase from 2000 to 2018. The average coupling degree (C value) in Seni district increased from 0.623 in 2000 to 0.995 in 2018, representing an increase of 59.71%. This increase indicates that the interaction and mutual influence between ecosystem services and human well-being in Seni district have gradually strengthened. The coordination degree (D value) increased from 0.353 in 2000 to 0.929 in 2018, showing an increase of 163.17% and suggesting that the coordination degree between ecosystem services and human well-being in Seni district has significantly improved, with both moving toward a high-quality coordinated development state. In terms of the change in coupling and coordination levels, the coordination levels of ecosystem services and resident well-being in 2000, 2010, and 2018 were 4, 7, and 10, respectively. The coupling and coordination degree transitioned from a mild imbalance in 2000 to primary coordination in 2010 and evolved into high-quality coordination in 2018, demonstrating an overall significant improvement trend.
Table 9 Comprehensive evaluation value calculation results
Year Ecosystem services comprehensive evaluation value Human well-being comprehensive evaluation value
2000 0.3566 0.0435
2010 0.3351 0.4010
2018 0.7814 0.9518
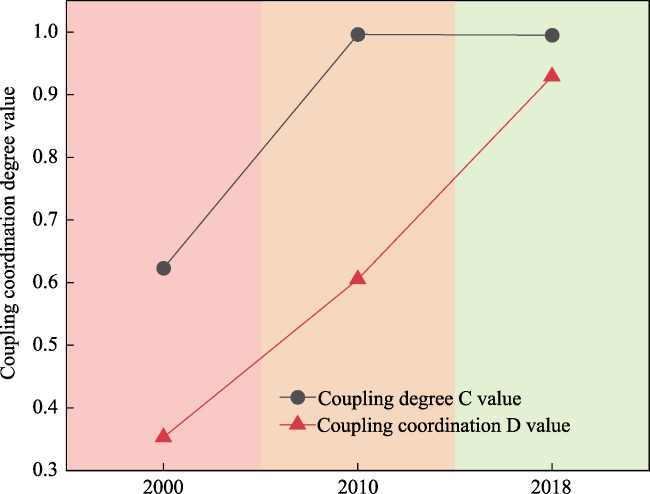
Figure 6 Trends in the coupling and coordination degree of ES and HW in Seni district
Table 10 Coupling coordination degree calculation results
Year Coupling degree
(C value)
Coordination index
(T value)
Coupling coordination degree (D value) Coordination level Coupling coordination status
2000 0.623 0.200 0.353 4 Mildly imbalanced
2010 0.996 0.368 0.605 7 Primary coordination
2018 0.995 0.867 0.929 10 High-quality coordination

4.4 Spatial zoning of ecosystem services and human well-being in Seni district

There are differences in the level of human well-being across the different regions of Seni district. The spatial distribution of subjective well-being satisfaction levels in the different regions of Seni district at the township scale is shown in Figure 7. Xiangmao township in the west has the highest comprehensive score of subjective well-being, at 4.08 points, while eastern Sejong township has the lowest score, at just 3.52 points. The low-value areas of well-being satisfaction comprehensive scores are mainly concentrated in the eastern and southern regions of Seni district. In addition to the lowest, Sejong township, the well-being score levels of the neighboring Laomai and Nima townships are also relatively low, at 3.57 and 3.61 points, respectively. The high-value areas of subjective well-being satisfaction levels are primarily concentrated in the central and western regions of Seni district. Xiangmao township, Luoma town, and Nagqu town have relatively large areas of high-quality pastureland. The development of animal husbandry is significantly better than that in the eastern and southern townships, and the road transportation is more convenient, resulting in a higher overall well-being level.
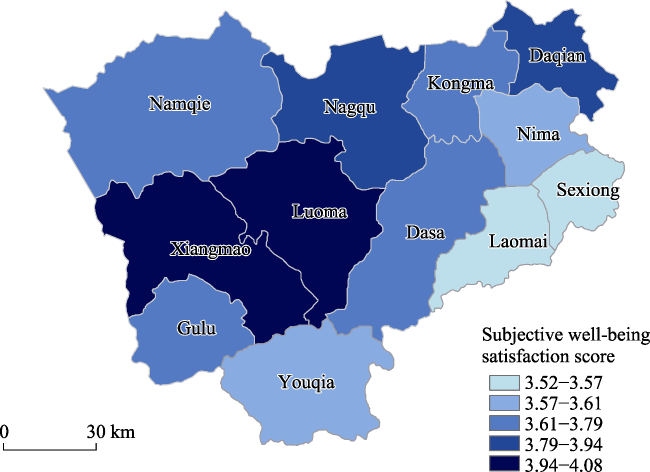
Figure 7 Differences in Subjective HW across different regions in Seni district
Utilizing the comprehensive scores of ecosystem services and subjective well-being in each of the townships of Seni district, we performed hierarchical clustering to categorize the townships at the administrative unit scale. Based on the characteristics of the six ecosystem services and subjective human well-being in each township, the 12 town-level units of Seni district were ultimately divided into five regions (Figure 8). Considering the characteristics of the transportation, topography, and ecological resources in the five clustered regions, the clusters were categorized as the Low Supply Accessible Transportation Area, Low Supply Inaccessible Transportation Area, Low Supply Mountainous Valley Area, High Supply Accessible Transportation Area, and High Supply Plains and Hills Area.
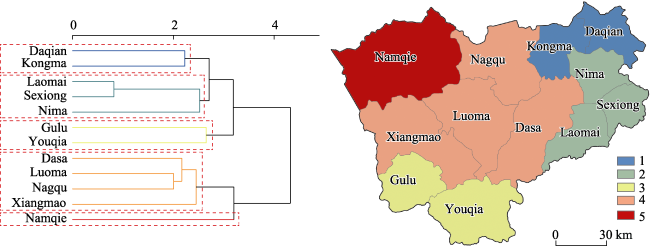
Figure 8 Spatial zoning of ES and HW in Seni district
Daqian and Kongma townships, which are located in the northeastern part of Seni district, belong to the low supply accessible transportation area. As shown in Figure 9, the levels of livestock breeding services and landscape recreation services in this area are slightly lower, while carbon sequestration services are high. The other ecosystem services are generally at a medium level across the region, and the overall human well-being is also at a medium level. Most of this area consists of plateau and hilly terrain, with rivers passing through the center of both Daqian and Kongma townships. The areas along the rivers have higher values for carbon sequestration services and exhibit a certain area of developed grasslands. However, due to topographic constraints, there is limited high-quality pastureland with high vegetation coverage, resulting in lower habitat quality and livestock breeding levels. The area has a convenient transportation network, mainly centered around National Highway 317, which facilitates material transportation and has a positive impact on the well-being of residents. Therefore, although the livestock breeding services in this area are low, the overall human well-being score is at a medium to high level (Figure 10).
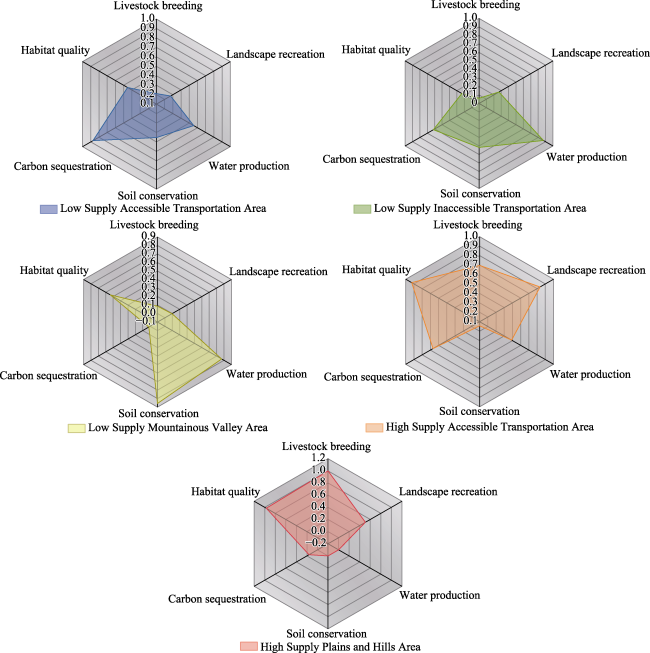
Figure 9 Radar chart of ES in different types of regions in Seni district
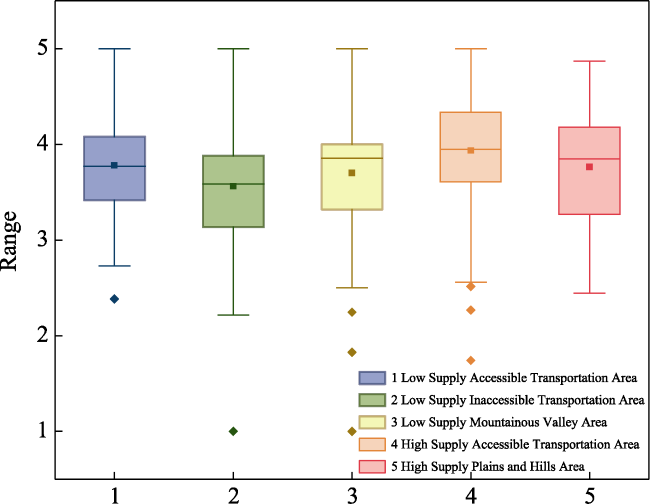
Figure 10 Boxplot of comprehensive HW scores in different types of regions in Seni district
Laomai, Sexiong, and Nima townships are located in the southeastern part of Seni district and belong to the low supply inaccessible transportation area. In this area, the water production services, soil conservation services, and carbon sequestration services are relatively high, while the landscape recreation and livestock breeding services are low. This is the area with the lowest overall human well-being in Seni district (Figures 9 and 10). The region is mainly characterized by hilly terrain, with the branches of the Nyenchen Tanglha Mountains surrounding it from the north and the south. The terrain is rugged, which makes transportation difficult. The population is concentrated in the water areas and nearby regions within the territory, with high-value ecosystem services surrounding the rivers, making the area relatively suitable for habitation and livestock breeding. However, due to topography and limitations in the available grassland area, the livestock breeding levels are low, which affects the well-being of local residents in terms of basic material needs, ultimately leading to a lower overall human well-being level in this area.
Gulu town and Youqia township are located at the southernmost tip of Seni district. In this area, the water production services and soil conservation services are high, while the carbon sequestration services, landscape recreation, and livestock breeding services are low. The overall subjective human well-being level is medium (Figures 9 and 10). The average elevation of this area is nearly 5,000 meters, with the landscape mainly consisting of high mountains and deep valleys. The majority of the area is covered by high-altitude mountains, with the population mainly concentrated in the valley areas at the foot of the mountains. Most of the residents in Gulu town live in relatively wide valleys, while many residents of Youqia township live in narrow valleys. The valleys have abundant precipitation, resulting in high water production and soil conservation services, as well as relatively high carbon sequestration services in the surrounding valley bottoms. However, due to altitude, there is a lack of vast, high-quality pastures for raising large livestock. Apart from some villages in Gulu town that are close to the highway and have convenient access to materials, many of the residential areas in this region face difficulties in obtaining supplies, which leads to an overall low well-being level for the residents. Youqia township, due to its high altitude and abundant water supply, has high yields of Cordyceps sinensis, making the Cordyceps industry its main economic source, which could explain the higher median value shown in Figure 10.
Nagqu town, Luoma town, Xiangmao township, and Dasa township are located in the center of Seni district and belong to the high supply accessible transportation area. This area has relatively high values for all ecosystem services aside from its soil conservation services (Figure 9). At the same time, this area has a high concentration of livestock breeding services and is the area with the highest overall human well-being among the five types of regions (Figure 10). Most of the residents in this area live in vast plateaus and hilly areas. The abundant summer precipitation and relatively flat terrain have resulted in large continuous areas of high-quality pastures, which provide strong support for livestock breeding and higher income satisfaction for residents. The area is close to the central city of Seni in Nagqu city, with relatively convenient transportation, enabling a higher well-being level for local residents in terms of basic material needs compared to that of other areas. However, there is also a certain degree of grassland degradation and soil erosion in the local pastures, which, in the long run, exerts a significant impact on local ecosystem services and human well-being.
Namqie township is located in the northwestern part of Seni district and belongs to the high supply plains and hills area. In this area, the livestock breeding services are high, but the regulating and supporting ecosystem services, such as carbon sequestration services, soil conservation services, and water production services, are all relatively low, and the overall human well-being is at a medium level (Figures 9 and 10). The overall topography of Namqie township is similar to that of the central townships, such as Nagqu town, in the high plateau and hilly area. The area has relatively small terrain fluctuations and a large area of flat highlands suitable for grass growth. Therefore, this area is also a major livestock production area in Seni district, with a large number of yaks, sheep, and goats raised, providing generally high income satisfaction for residents. However, there is a certain degree of grassland degradation and soil erosion in the pastures. Although the residents of Namqie township exhibit higher satisfaction levels in terms of income and material needs, the low regulating and supporting ecosystem services, such as water production, carbon sequestration, and soil conservation, may have long-term impacts on the supply-side ecosystem services and the overall well-being level of local residents.

5 Discussion

5.1 Spatiotemporal patterns and interrelationships of ecosystem services and well-being

Quantifying regional ecosystem services and human well-being and revealing their coupled and coordinated relationships can help policy-makers implement targeted ecological optimization and improve human well-being, thus promoting regional sustainable development. In recent years, research into quantifying ecosystem services and human well-being and exploring their quantitative relationships has mostly used regression analysis and correlation analysis, considered only ecosystem services, or considered only the clustering and zoning of human well-being (Zhang et al., 2019a; Huang et al., 2020; Rong et al., 2020; Wang et al., 2022a). Some studies have used a single supply or demand side to evaluate the environment and then analyzed the relationship between the environment and human well-being (Yang et al., 2010; Abunge et al., 2013; Ciftcioglu, 2017), but the relationship between the matching status of ecosystem service supply and demand and the well-being of different groups and regions has been overlooked. In this study’s hierarchical clustering analysis, regions are spatially divided based on the combination of ecosystem services and human well-being to study the overall level of Seni district and the ecosystem services and human well-being levels of different groups within the townships of Seni district. This method ensures both the harmonious relationship between ecosystem services and human well-being and the well-being of various stakeholders, such as the different needs of herders and urban residents, to conduct a detailed assessment of the characteristics of each partition and better propose regional optimization strategies to safeguard the demands of residents and prevent them from falling back into poverty. The results of the ecosystem services in Seni district as simulated by this study’s model are similar to those in the existing research (Yin et al., 2020; Jiang et al., 2021; Liang and Song, 2022; Luo et al., 2022; Wu et al., 2022; Zhang et al., 2022b). For example, the precipitation in the southeastern part of Seni district is significantly higher than that in the northwestern part, and the vegetation growth in the southeastern part is limited by the terrain and less adequate than that in the northwestern part. Meanwhile, a high vegetation coverage rate generally exerts a certain negative impact on water production services (Bai et al., 2012; Zhou et al., 2015; Filoso et al., 2017), ultimately leading to high water production services and relatively low carbon sequestration services in the southeastern part of Seni district and low water production services and relatively higher carbon sequestration services in the northwestern part.
The coupling and coordination of ecosystem services and human well-being in Seni district have significantly improved, with the main driving factors being the improvement of ecological environment quality and socioeconomic development. The coupling and coordination relationship between ecosystem services and human well-being in Seni district in 2018 was significantly better than that in 2010. On the one hand, the implementation of major ecological projects improved the level of ecosystem services. In 2012, China entered a stage that was focused on the protection and restoration of mountains, rivers, forests, farmlands, lakes, grasslands and sand systems, and the Qinghai-Tibet Plateau ecological screen has been one of the important pilot project areas for the protection and restoration of mountains, rivers, forests, farmlands, lakes, and grasslands ecosystems since 2016 (Luo et al., 2019). On the other hand, the significant improvement observed in the objective well-being level of residents can be attributed to multiple factors, such as economic development, social policies, social security systems, and environmental improvements. Since 2011, China has built a Chinese livelihood index system that includes four objective indices, namely, resident lifestyles, public services, public safety, and ecological civilization, and two subjective (satisfaction) indices, namely, lifestyle satisfaction and overall well-being satisfaction. The local areas have also explored the use of happiness indices. The content that relates to people’s livelihood and happiness in government work documents has become increasingly specific. By comparing the subjective and objective well-being in Seni district, it was found that well-being in terms of basic material needs, including income indicators, in the objective well-being of Seni district increased significantly between 2010 and 2018. At the same time, well-being in terms of education, employment, and other aspects in Seni district has also improved, which has significantly enhanced the living standards of the local people. However, in regard to subjective well-being, the satisfaction of local residents with well-being in the field of material needs is still slightly lower than that in other areas, especially in terms of income and water use. In addition, the current per capita number of hospital beds in Seni district is significantly better than it was previously, and resident life expectancy is also increasing, reflecting progress in the medical field. However, the satisfaction of Seni district residents with medical facilities is still not high. On December 9, 2019, Seni district was officially lifted out of poverty as the last batch of impoverished counties in Tibet. With the help of various policies, the overall living standards of Seni district residents have improved significantly in recent years. However, there are still many areas in Seni district where people live close to the poverty line, and some residents, especially the vast majority of herders, are at risk of falling back into poverty. The most critical issue is how to maintain and enhance the functions of the ecological conservation area in Seni while stabilizing the current situation of poverty eradication, promoting local economic development and infrastructure construction, and improving people’s well-being.

5.2 Formulating targeted strategies based on ecosystem services and well-being characteristics

According to the relationships between ecosystem services and human well-being in the five types of regions in Seni district as obtained by hierarchical clustering analysis, the following management measures can be suggested for maintaining and improving regional ecosystem services and human well-being. Based on the research results and field investigation, the following suggestions are proposed for the different regions:
In the low supply accessible transportation area, livestock breeding is low, and the area of high-quality pastureland is limited. A moderate development of a certain number of characteristic breeding industries can be carried out, and the adoption of “summer grazing and winter enclosure,” “low grass high grazing,” and “front yard and backyard” breeding methods can be actively promoted. This can increase livestock production without placing a greater burden on the local ecological environment, thus improving local residents’ pastoral income and well-being levels. Additionally, the region’s relatively good transportation advantages can be utilized to facilitate the development of secondary industries, such as meat and dairy product processing factories.
The low supply inaccessible transportation area has a rugged terrain, numerous mountains, low livestock breeding levels, and poor transportation conditions, making it the area with the lowest well-being in Seni district. The relocation of local residents who live in areas with poor living conditions and small populations to other locations is suggested. At the same time, road construction should be continued to connect local residents with other regions, making travel more convenient for residents. Innovative characteristic breeding can be attempted, and the planting area of artificial forage can be further expanded in those areas suitable for reclamation, planting grass and retaining water, thus improving the supply level of ecosystem services and thereby enhancing the well-being levels of residents in the region.
The low supply mountainous valley area has many magnificent landscapes that are suitable for sightseeing. The region can attempt to further develop characteristic tourism based on existing scenic spots such as Zhuoma Canyon and Sandan Kangsang Snow Mountain. For some residents in deep mountain areas, relocation should be actively mobilized and implemented to facilitate poverty alleviation and ecological relocation.
The high supply accessible transportation area has the largest road network density, most convenient transportation, and largest continuous areas of high-quality pastures, making it a major pastoral area. It is recommended that the area maintain its current level of ecosystem services while strengthening its grassland management, continuing to strictly implement grazing bans, resting, and rotational grazing optimization measures, and maintaining livestock breeding levels under the principle of grass and livestock balance. The population in this area is relatively concentrated, and the region can leverage its location advantages to build meat and dairy product processing factories locally, thus increasing the added value of agricultural and sideline products and driving resident wage income.
The high supply plains and hills area has undergone relatively severe grassland degradation and land desertification, and the lower level of ecosystem services affects resident well-being. It is recommended that the local authorities continue to implement various ecological subsidy measures, reward subsidies for artificial forage planting and grassland reseeding, strengthen the supervision of excessive grazing behavior, and continue scientific rotational grazing and resting to provide sufficient recovery time for grasslands, ensuring the long-term sustainable use of local grassland resources and the healthy development of grassland ecosystems.

5.3 Limitations and prospects

There is some uncertainty in the research methods used in this study. First, when using the InVEST and CASA models, the determination of parameters still involves uncertainty in their localization based on the characteristics of the study area. This is because a large number of field observations and surveys in the study area, as well as experimental analysis, is needed to verify the parameter’s rationality, which may affect the simulation accuracy. Second, due to limitations in manpower and survey time, multiyear human subjective well-being data were not collected, and objective well-being data were only collected at the overall level of Seni district. The lack of ecosystem service data led to the analysis covering only three years of changes, and further exploration of the complex relationships between ecosystem services and human well-being was lacking. The association process between ecosystem services and human well-being is rather complicated. In this study, the distribution and spatial zoning of ecosystem services and human well-being was analyzed, but the effect of ecosystem services on human well-being after being consumed could not be clearly captured. The relationship between these indicators involves a comprehensive process involving spatial and temporal factors. Further exploration is needed to understand the mechanisms of their interactions. In the future, we can establish more suitable models to further study the relationship between ecosystem services and subjective and objective human well-being over time and analyze the potential influencing factors and individual differences. We can focus on conducting an attribution analysis of ecosystem service spatial heterogeneity on a smaller spatial scale to better provide a basis for formulating differentiated ecological protection policies in different regions.

6 Conclusion

Utilizing the InVEST and CASA models, we quantified six ecosystem services and analyzed their spatial distribution in Seni district. We also clustered and divided the townships based on the comprehensive scores of human well-being factors gleaned from both subjective and objective perspectives to ensure a harmonious relationship between ecosystem services and human well-being for various stakeholders, such as herders and urban residents. Moreover, a coupling coordination model was employed to demonstrate the development characteristics and coordination coupling state at the overall level of Seni district. In our study, the spatiotemporal distribution changes of the six major ecosystem services in Seni district are examined and the residents’ well-being levels are assessed through objective statistics and subjective questionnaire surveys. We conducted coupling and coordination trend analyses at both the overall and township levels, and based on the well-being and ecosystem service quantification results, we clustered and divided the townships in Seni district, further summarizing the characteristics of each division and proposing regional optimization suggestions. The results show that from 2000 to 2018, livestock breeding and water production services decreased, while soil conservation and carbon sequestration services increased. Livestock breeding services were higher in the northwestern and central townships of Seni district, showing distinct regional distribution characteristics. The coupling and coordination relationship between ecosystem services and objective human well-being significantly improved, particularly during the period from 2010 to 2018, with an 86.2% increase in the coupling coordination degree. This suggests that Seni district has evolved toward a “high coupling - high coordination” benign resonance type through long-term antagonism and adaptation, driven by good ecological assets and higher level of well-being improvement. According to the ecosystem services and subjective human well-being characteristics of the townships in Seni district, they can be clustered into five different types of regions: low supply accessible transportation area, low supply inaccessible transportation area, low supply mountainous valley area, high supply accessible transportation area, and high supply plains and Hills area. The results indicate that we can improve the quality of life and maintain regional sustainability for urban and pastoral residents in different areas by vigorously developing animal husbandry, creating local characteristic animal husbandry products, adjusting employment choices, increasing the vegetation coverage, and promoting transportation construction according to local conditions. This can provide a scientific reference for the sustainable development and overall planning of Seni district, protect the ecological conservation function of Seni district, reasonably utilize the characteristic resources of pastoral areas and is of great significance for achieving the revitalization of rural minority areas in Tibet.
[1]
Abunge C, Coulthard S, Daw T M, 2013. Connecting marine ecosystem services to human well-being: Insights from participatory well-being assessment in Kenya. Ambio, 42(8): 1010-1021.

DOI PMID

[2]
Adams H, Adger W N, Ahmad S et al., 2020. Multi-dimensional well-being associated with economic dependence on ecosystem services in deltaic social-ecological systems of Bangladesh. Regional Environmental Change, 20(3): 1-16.

DOI

[3]
Bai Y, Ouyang Z Y, Zheng H et al., 2012. Modeling soil conservation, water conservation and their tradeoffs: A case study in Beijing. Journal of Environmental Sciences, 24(3): 419-426.

PMID

[4]
Bai Y, Wong C P, Jiang B et al., 2018. Developing China’s Ecological Redline Policy using ecosystem services assessments for land use planning. Nature Communications, 9(1): 3034.

DOI

[5]
Bernstein A S, 2014. Biological diversity and public health. Annual review of public health, 35(1): 153-167.

DOI

[6]
Bravo G, 2015. The human sustainable development index: The 2014 update. Ecological Indicators, (50): 258-259.

[7]
Breslow S J, Sojka B, Barnea R et al., 2016. Conceptualizing and operationalizing human wellbeing for ecosystem assessment and management. Environmental Science & Policy, 66(1): 250-259.

[8]
Canadell J, Jackson R B, Ehleringer J B et al., 1996. Maximum rooting depth of vegetation types at the global scale. Oecologia, 108(4): 583-595.

DOI PMID

[9]
Celentano D, Sills E, Sales M et al., 2012. Welfare outcomes and the advance of the deforestation frontier in the Brazilian Amazon. World Development, 40(4): 850-864.

DOI

[10]
Che L, Zhou L, Xu J, 2021. Integrating the ecosystem service in sustainable plateau spatial planning: A case study of the Yarlung Zangbo River Basin. Journal of Geographical Sciences, 31(2): 281-297.

DOI

[11]
Chen H, Ju P J, Zhu Q A et al., 2022a. Carbon and nitrogen cycling on the Qinghai-Tibetan plateau. Nature Reviews Earth & Environment, 3(10): 701-716.

[12]
Chen L, Xie G, Pei S et al., 2012. Ecosystem’s soil conservation function and its spatial distribution in Lancang River Basin, Southwest China. Chinese Journal of Applied Ecology, 23(8): 2249-2256.

[13]
Chen W, Zeng J, Zhong M et al., 2021. Coupling analysis of ecosystem services value and economic development in the Yangtze River Economic Belt: A case study in Hunan province, China. Remote Sensing, 13(8): 1552.

DOI

[14]
Chen Y, Li Z, Li P et al., 2022b. Impacts and projections of land use and demographic changes on ecosystem services: A case study in the Guanzhong region, China. Sustainability, 14(5): 3003.

DOI

[15]
Ciftcioglu G C, 2017. Assessment of the relationship between ecosystem services and human wellbeing in the social-ecological landscapes of Lefke Region in North Cyprus. Landscape Ecology, 32(4): 897-913.

DOI

[16]
Clark D A, 2014. Defining and measuring human well-being. Global Environmental Change, 1: 833-855.

[17]
Costanza R, D’arge R, De Groot R et al., 1997. The value of the world’s ecosystem services and natural capital. Nature, 387(6630): 253-260.

DOI

[18]
Dai Y, Shangguan W, 2019. Dataset of soil properties for land surface modeling over China. In: A Big Earth Data Platform for Three Poles.

[19]
Dong X B, Ren J H, Zhang P et al., 2021. Entwining ecosystem services, land use change and human well-being by nitrogen flows. Journal of Cleaner Production, 308: 127442.

DOI

[20]
Donohue R J, Roderick M L, Mcvicar T R, 2012. Roots, storms and soil pores: Incorporating key ecohydrological processes into Budyko’s hydrological model. Journal of Hydrology, 436: 35-50.

[21]
Fang G, Xiang B, Zhao W et al., 2015. Study on soil erosion in LaSa River Basin based on GIS and RUSLE. Journal of Soil and Water Conservation, 29(3): 6-12. (in Chinese)

[22]
Filoso S, Bezerra M O, Weiss K C et al., 2017. Impacts of forest restoration on water yield: A systematic review. PloS One, 12(8): e0183210.

DOI

[23]
Fu B, 2020. Promoting geography for sustainability. Geography and Sustainability, 1(1): 1-7.

DOI

[24]
Gandarillas V, Jiang Y, Irvine K, 2016. Assessing the services of high mountain wetlands in tropical Andes: A case study of Caripe wetlands at Bolivian Altiplano. Ecosystem Services, 19: 51-64.

DOI

[25]
Garcia Rodrigues J, Villasante S, Sousa Pinto I, 2022. Non-material nature’s contributions to people from a marine protected area support multiple dimensions of human well-being. Sustainability Science, 17(3): 793-808.

DOI

[26]
Haahtela T, Holgate S, Pawankar R et al., 2013. The biodiversity hypothesis and allergic disease: World allergy organization position statement. World Allergy Organization Journal, 6(1): 3.

DOI PMID

[27]
Hermy M, Van Der Veken S, Van Calster H et al., 2008. Forest ecosystem assessment, changes in biodiversity and climate change in a densely populated region (Flanders, Belgium). Plant Biosystems: An International Journal Dealing with all Aspects of Plant Biology, 142(3): 623-629.

DOI

[28]
Hua X B, Yan J Z, Liu X, 2013. Settled herdsmen’s adaptation strategies to pasture degradation: Case study of Naqu county in Tibet Plateau. Mountain Research, 31(2): 140-149. (in Chinese)

[29]
Huang Q, Yin D, He C et al., 2020. Linking ecosystem services and subjective well-being in rapidly urbanizing watersheds: Insights from a multilevel linear model. Ecosystem Services, 43: 101106.

DOI

[30]
Jiang W, Wu T, Fu B, 2021. The value of ecosystem services in China: A systematic review for twenty years. Ecosystem Services, 52: 101365.

DOI

[31]
Jing H C, Liu Y H, He P et al., 2022. Spatial heterogeneity of ecosystem services and its influencing factors in typical areas of the Qinghai-Tibet Plateau: A case study of Nagqu city. Acta Ecologica Sinica, 42(7): 2657-2673. (in Chinese)

[32]
Kang T, Yang S, Bu J et al., 2020. Quantitative assessment for the dynamics of the main ecosystem services and their interactions in the northwestern arid area, China. Sustainability, 12(3): 803.

DOI

[33]
King M F, Renó V F, Novo E M, 2014. The concept, dimensions and methods of assessment of human well-being within a socioecological context: A literature review. Social Indicators Research, 116(3): 681-698.

DOI

[34]
Kosanic A, Petzold J, 2020. A systematic review of cultural ecosystem services and human wellbeing. Ecosystem Services, 45: 101168.

DOI

[35]
Li F, Li Y M, Zhou X W et al., 2022a. Modeling and analyzing supply-demand relationships of water resources in Xinjiang from a perspective of ecosystem services. Journal of Arid Land, 14(2): 115-138.

DOI

[36]
Li W L, Dong S C, Lin H Y et al., 2022b. Influence of rural social capital and production mode on the subjective well-being of farmers and herdsmen: Empirical discovery on farmers and herdsmen in Inner Mongolia. International Journal of Environmental Research and Public Health, 19(2): 695.

DOI

[37]
Li X, Yu X, Wu K et al., 2021. Land-use zoning management to protecting the regional key ecosystem services: A case study in the city belt along the Chaobai River, China. Science of the Total Environment, 762: 143167.

DOI

[38]
Liang Y, Song W, 2022. Integrating potential ecosystem services losses into ecological risk assessment of land use changes: A case study on the Qinghai-Tibet Plateau. Journal of Environmental Management, 318: 115607.

DOI

[39]
Liu D, Chen H, Zhang H et al., 2022a. The impact of ecosystem services on human well-being and its group differences in the loess hilly and gully region. Geographical Research, 41(5): 1298-1310. (in Chinese)

[40]
Liu J, Huang L, Yan L, 2018. Influence of ecosystem services on human well-being: A case study of Tonglu county, Zhejiang province, China. Acta Ecologica Sinica, 38(5): 1687-1697. (in Chinese)

[41]
Liu M, Wei H, Dong X et al., 2022b. Integrating land use, ecosystem service, and human well-being: A systematic review. Sustainability, 14(11): 6926.

DOI

[42]
Liu M X, Gao Y, Wei H J et al., 2022c. Profoundly entwined ecosystem services, land-use change and human well-being into sustainability management in Yushu, Qinghai-Tibet Plateau. Journal of Geographical Sciences, 32(9): 1745-1765.

DOI

[43]
Liu Z, Wang S, Fang C, 2023. Spatiotemporal evolution and influencing mechanism of ecosystem service value in the Guangdong-Hong Kong-Macao Greater Bay Area. Journal of Geographical Sciences, 33(6): 1226-1244.

DOI

[44]
Logsdon R A, Chaubey I, 2013. A quantitative approach to evaluating ecosystem services. Ecological Modelling, 257: 57-65.

DOI

[45]
Luo M, Yu E, Zhou Y et al., 2019. Distribution and technical strategies of ecological protection and restoration projects for mountains-rivers-forests-farmlands-lakes-grasslands. Acta Ecologica Sinica, 39(23): 8692-8701. (in Chinese)

[46]
Luo Y Y, Yang D W, O’connor P et al., 2022. Dynamic characteristics and synergistic effects of ecosystem services under climate change scenarios on the Qinghai-Tibet Plateau. Scientific Reports, 12(1): 1-15.

DOI

[47]
Ma J, Wang X, Zhou J et al., 2023. Exploring the response of ecosystem services to landscape change: A case study from eastern Qinghai province. Journal of Geographical Sciences, 33(9): 1897-1920.

DOI

[48]
Ma L, Qin Y, Zhang H et al., 2021. Improving well-being of farmers using ecological awareness around protected areas: Evidence from Qinling region, China. International Journal of Environmental Research and Public Health, 18(18): 9792.

DOI

[49]
Marques S M, Campos F S, David J et al., 2021. Modelling sediment retention services and soil erosion changes in Portugal: A spatio-temporal approach. ISPRS International Journal of Geo-Information, 10(4): 262.

DOI

[50]
Mauser W, Klepper G, Rice M et al., 2013. Transdisciplinary global change research: The co-creation of knowledge for sustainability. Current Opinion in Environmental Sustainability, 5(3/4): 420-431.

DOI

[51]
Mcgregor J A, Camfield L, Woodcock A, 2009. Needs, wants and goals: Wellbeing, quality of life and public policy. Applied Research in Quality of Life, 4(2): 135-154.

DOI

[52]
Outeiro L, Villasante S, 2013. Linking salmon aquaculture synergies and trade-offs on ecosystem services to human wellbeing constituents. Ambio, 42(8): 1022-1036.

DOI PMID

[53]
Pierret A, Maeght J-L, Clément C et al., 2016. Understanding deep roots and their functions in ecosystems: An advocacy for more unconventional research. Annals of Botany, 118(4): 621-635.

DOI PMID

[54]
Potter C S, Randerson J T, Field C B et al., 1993. Terrestrial ecosystem production: A process model based on global satellite and surface data. Global Biogeochemical Cycles, 7(4): 811-841.

DOI

[55]
Qadir U, 2015. Human Development Report 2015:Work for human development. Pakistan Development Review, 54(3): 277-278.

[56]
Qi W, Liu S H, Zhou L, 2020. Regional differentiation of population in Tibetan Plateau: Insight from the “Hu Line”. Acta Geographica Sinica, 75(2): 255-267. (in Chinese)

[57]
Qi X K, Li Q, Yue Y M et al., 2021. Rural-urban migration and conservation drive the ecosystem services improvement in China karst: A case study of Huanjiang county, Guangxi. Remote Sensing, 13(4): 566.

DOI

[58]
Qiu J Q, Yu D Y, Huang T, 2022. Influential paths of ecosystem services on human well-being in the context of the sustainable development goals. Science of The Total Environment, 852: 158443.

DOI

[59]
Raji S A, Odunuga S, Fasona M, 2021. Quantifying ecosystem service interactions to support environmental restoration in a tropical semi-arid basin. Acta Geophysica, 69(5): 1813-1841.

DOI

[60]
Rall E, Hansen R, Pauleit S, 2019. The added value of public participation GIS (PPGIS) for urban green infrastructure planning. Urban Forestry & Urban Greening, 40(SI): 264-274.

[61]
Reid W V, Mooney H A, Cropper A et al., 2005. Ecosystems and Human Well-being-Synthesis:A Report of the Millennium Ecosystem Assessment. Washington, DC: Island Press, 137.

[62]
Rong Y J, Yan Y, Wang C X et al., 2020. Construction and optimization of ecological network in Xiong’an New Area based on the supply and demand of ecosystem services. Acta Ecologica Sinica, 40(20): 7197-7206. (in Chinese)

[63]
Salti N, Chaaban J, Irani A et al., 2021. A multi-dimensional measure of well-being among youth: The case of Palestinian refugee youth in Lebanon. Social Indicators Research, 154(1): 1-34.

DOI

[64]
Sandhu H, Sandhu S, 2014. Linking ecosystem services with the constituents of human well-being for poverty alleviation in eastern Himalayas. Ecological Economics, 107: 65-75.

DOI

[65]
Sharp R, Douglass J, Wolny S et al., 2020. InVEST 3.9.0. User’s Guide: The Natural Capital Project. Stanford University, University of Minnesota, The Nature Conservancy, and World Wildlife Fund.

[66]
Shen M G, Wang S P, Jiang N et al., 2022. Plant phenology changes and drivers on the Qinghai-Tibetan Plateau. Nature Reviews Earth & Environment, 3(10): 633-651.

[67]
Shui Y, Lu H, Wang H et al., 2018. Assessment of habitat quality on the basis of land cover and NDVI changes in Lhasa River Basin. Acta Ecologica Sinica, 38(24): 8946-8954. (in Chinese)

[68]
Song Y N, Wang M, Sun X F et al., 2021. Quantitative assessment of the habitat quality dynamics in Yellow River Basin, China. Environmental Monitoring and Assessment, 193(9): 614.

DOI PMID

[69]
Van Berkel D B, Verburg P H, 2014. Spatial quantification and valuation of cultural ecosystem services in an agricultural landscape. Ecological Indicators, 37: 163-174.

DOI

[70]
Van De Kerk G, 2014. Sustainable society index, tool for measuring well-being. Encyclopedia of Quality of Life and Well-Being Research, 10: 978-994.

[71]
Van De Kerk G, Manuel A R, 2008. A comprehensive index for a sustainable society: The SSI—the Sustainable Society Index. Ecological Economics, 66(2/3): 228-242.

DOI

[72]
Voukelatou V, Gabrielli L, Miliou I et al., 2021. Measuring objective and subjective well-being: Dimensions and data sources. International Journal of Data Science and Analytics, 11(4): 279-309.

DOI

[73]
Wang B J, Tang H P, Xu Y, 2017. Integrating ecosystem services and human well-being into management practices: Insights from a mountain-basin area, China. Ecosystem Services, 27: 58-69.

DOI

[74]
Wang B J, Zhang Q, Cui F Q, 2021a. Scientific research on ecosystem services and human well-being: A bibliometric analysis. Ecological Indicators, 125: 107449.

DOI

[75]
Wang C, Wang X, Wang Y et al., 2023. Spatio-temporal analysis of human wellbeing and its coupling relationship with ecosystem services in Shandong province, China. Journal of Geographical Sciences, 33(2): 392-412.

DOI

[76]
Wang F, Zheng S Y, Yang H R et al., 2022a. Regionalization and classification of water eco-environment in Zhejiang province based on ecosystem service. Acta Ecologica Sinica, 42(2): 539-548. (in Chinese)

[77]
Wang H, Liu L B, Yin L et al., 2021b. Exploring the complex relationships and drivers of ecosystem services across different geomorphological types in the Beijing-Tianjin-Hebei region, China (2000-2018). Ecological Indicators, 121: 107116.

[78]
Wang R H, Peng Q, Zhang W D et al., 2022b. Ecohydrological service characteristics of qilian mountain ecosystem in the next 30 years based on scenario simulation. Sustainability, 14(3): 1819.

DOI

[79]
Wei D, Qi Y H, Ma Y M et al., 2021. Plant uptake of CO2 outpaces losses from permafrost and plant respiration on the Tibetan Plateau. Proceedings of the National Academy of Sciences, 118(33): e2015283118.

DOI

[80]
Wei H J, Fan W G, Ding Z Y et al., 2017. Ecosystem services and ecological restoration in the Northern Shaanxi Loess Plateau, China, in relation to climate fluctuation and investments in natural capital. Sustainability, 9(2): 199.

DOI

[81]
Wei H J, Liu H M, Xu Z H et al., 2018. Linking ecosystem services supply, social demand and human well-being in a typical mountain-oasis-desert area, Xinjiang, China. Ecosystem Services, 31: 44-57.

DOI

[82]
Williams J, Renard K, Dyke P, 1983. EPIC: A new method for assessing erosion’s effect on soil productivity. Journal of Soil and Water Conservation, 38(5): 381-383.

[83]
Wischmeier W H, Smith D D, 1978. Predicting rainfall erosion losses: A guide to conservation planning. Environmental Science, 537: 62.

[84]
Wood S L, Declerck F, 2015. Ecosystems and human well-being in the Sustainable Development Goals. Frontiers in Ecology and the Environment, 13(3): 123-123.

[85]
Wood S L, Jones S K, Johnson J A et al., 2018. Distilling the role of ecosystem services in the Sustainable Development Goals. Ecosystem Services, 29: 70-82.

DOI

[86]
Wu C Y, Chen K L, You X N et al., 2022. Improved CASA model based on satellite remote sensing data: Simulating net primary productivity of Qinghai Lake Basin alpine grassland. Geoscientific Model Development, 15(17): 6919-6933.

DOI

[87]
Wu J, Gao X, 2013. A gridded daily observation dataset over China region and comparison with the other datasets. Chinese Journal of Geophysics, 56(4): 1102-1111.

[88]
Wu J, He C, Xu W, 2013. Emergy footprint evaluation of hydropower projects. Science China Technological Sciences, 56(9): 2336-2342.

DOI

[89]
Wu J G, 2013. Landscape sustainability science: ecosystem services and human well-being in changing landscapes. Landscape Ecology, 28(6): 999-1023.

DOI

[90]
Xu Z H, Wei H J, Fan W G et al., 2019. Relationships between ecosystem services and human well-being changes based on carbon flow: A case study of the Manas River Basin, Xinjiang, China. Ecosystem Services, 37: 100934.

DOI

[91]
Yan Y, Zhao C L, Quan Y et al., 2017. Interrelations of ecosystem services and rural population wellbeing in an ecologically-fragile area in North China. Sustainability, 9(5): 709.

DOI

[92]
Yang D, Liu W, Tang L Y et al., 2019. Estimation of water provision service for monsoon catchments of South China: Applicability of the InVEST model. Landscape and Urban Planning, 182: 133-143.

DOI

[93]
Yang L, Cao K, 2022. Spatial matching and correlation between recreation service supply and demand in the Ili River Valley, China. Applied Geography, 148: 102805.

DOI

[94]
Yang L, Zhen L, Li F et al., 2010. Impacts of ecosystem services change on human well-being in the Loess Plateau. Resources Science, 32(5): 849-855.

[95]
Yang W, Mckinnon M C, Turner W R, 2015. Quantifying human well-being for sustainability research and policy. Ecosystem Health and Sustainability, 1(4): 1-13.

[96]
Yang X, Qiu X, Xu Y et al., 2021a. Spatial heterogeneity and dynamic features of the ecosystem services influence on human wellbeing in the West Sichuan Mountain Areas. Acta Ecologica Sinica, 41(19): 7555-7567. (in Chinese)

[97]
Yang Y H, Weng B S, Yan D H et al., 2021b. Tracing potential water sources of the Nagqu River using stable isotopes. Journal of Hydrology: Regional Studies, 34: 100807.

DOI

[98]
Yin G D, Wang X, Zhang X et al., 2020. InVEST model-based estimation of water yield in North China and its sensitivities to climate variables. Water, 12(6): 1692.

DOI

[99]
Zhan J, Zhang F, Chu X et al., 2019. Ecosystem services assessment based on emergy accounting in Chongming Island, eastern China. Ecological Indicators, 105: 464-473.

DOI

[100]
Zhan N, Liu W H, Ye T et al., 2023. High-resolution livestock seasonal distribution data on the Qinghai-Tibet Plateau in 2020. Scientific Data, 10(1): 142.

DOI PMID

[101]
Zhang F, Zeng C, Zhang Q G et al., 2022a. Securing water quality of the Asian Water Tower. Nature Reviews Earth & Environment, 3(10): 611-612.

[102]
Zhang H J, Pang Q, Long H et al., 2019a. Local residents’ perceptions for ecosystem services: A case study of Fenghe River Watershed. International Journal of Environmental Research and Public Health, 16(19): 3602.

DOI

[103]
Zhang L Q, Peng J, Liu Y X et al., 2017. Coupling ecosystem services supply and human ecological demand to identify landscape ecological security pattern: A case study in Beijing-Tianjin-Hebei region, China. Urban Ecosystems, 20(3): 701-714.

DOI

[104]
Zhang X, Estoque R C, Xie H et al., 2019b. Bibliometric analysis of highly cited articles on ecosystem services. PloS One, 14(2): e0210707.

DOI

[105]
Zhang X, He S, Yang Y, 2021. Evaluation of wetland ecosystem services value of the Yellow River Delta. Environmental Monitoring and Assessment, 193(6): 353.

DOI PMID

[106]
Zhang X, Zhou J, Li G et al., 2020. Spatial pattern reconstruction of regional habitat quality based on the simulation of land use changes from 1975 to 2010. Journal of Geographical Sciences, 30(4): 601-620.

DOI

[107]
Zhang X Y, Li S S, Yu H, 2022b. Analysis on the ecosystem service protection effect of national nature reserve in Qinghai-Tibetan Plateau from weight perspective. Ecological Indicators, 142: 109225.

DOI

[108]
Zhang X-H, Zhang R, Wu J et al., 2016. An emergy evaluation of the sustainability of Chinese crop production system during 2000-2010. Ecological Indicators, 60: 622-633.

DOI

[109]
Zhao Y N, Chen D, Fan J, 2020. Sustainable development problems and countermeasures: A case study of the Qinghai-Tibet Plateau. Geography and Sustainability, 1(4): 275-283.

DOI

[110]
Zheng H, Robinson B E, Liang Y C et al., 2013. Benefits, costs, and livelihood implications of a regional payment for ecosystem service program. Proceedings of the National Academy of Sciences, 110(41): 16681-16686.

DOI

[111]
Zhong S Z, Geng Y, Huang B B et al., 2020. Quantitative assessment of eco-compensation standard from the perspective of ecosystem services: A case study of Erhai in China. Journal of Cleaner Production, 263: 121530.

DOI

[112]
Zhou G Y, Wei X H, Chen X Z et al., 2015. Global pattern for the effect of climate and land cover on water yield. Nature Communications, 6(1): 5918.

DOI

[113]
Zhu J, Gong J, Li J, 2020. Spatiotemporal change of habitat quality in ecologically sensitive areas of eastern Qinghai-Tibet Plateau: A case study of the Hehuang Valley, Qinghai province. Resources Science, 42(5): 991-1003. (in Chinese)

DOI

[114]
Zhu W, Pan Y, He H et al., 2006. Simulation of maximum light use efficiency for some typical vegetation types in China. Chinese Science Bulletin, 51(4): 457-463.

DOI

[115]
Zhu W Q, Chen Y H, Xu D et al., 2005. Advances in terrestrial net primary productivity (NPP) estimation models. Chinese Journal of Ecology, 24(3): 296-300. (in Chinese)

Outlines

/