Research Articles

Housing vacancy identification in shrinking cities based on multi-source data: A case study of Fushun city in Northeast China

  • SUN Hongri , 1 ,
  • ZHOU Guolei 2 ,
  • LIU Yanjun , 1, * ,
  • FU Hui 1 ,
  • JIN Yu 1
Expand
  • 1. School of Geographical Sciences, Northeast Normal University, Changchun 130024, China
  • 2. Northeast Institute of Geography and Agroecology, CAS, Changchun 130102, China
*Liu Yanjun, PhD and Professor, specialized in economic geography and urban geography. E-mail:

Sun Hongri (1996-), PhD Candidate, specialized in urban geography. E-mail:

Received date: 2023-03-20

  Accepted date: 2023-09-12

  Online published: 2024-01-08

Supported by

National Natural Science Foundation of China(42171191)

National Natural Science Foundation of China(42201211)

National Natural Science Foundation of China(41771172)

Science and Technology Development Plan Project of Jilin Province, China(20220508025RC)

China Postdoctoral Science Foundation(2018M641760)

Abstract

Urban shrinkage has attracted the attention of many geographers and urban planners in recent years. However, there are fewer studies on vacant housing in shrinking cities. Therefore, this study combines multi-source remote sensing images and urban building data to assess the spatiotemporal variation patterns of housing vacancy in a typical shrinking city in China. The following points were obtained: (1) We developed an evaluation model to identify vacant residential buildings in shrinking cities by removing the contribution of nighttime lights from roads and non-residential buildings; (2) The residential building vacancy rate in Fushun city significantly increased from 2013 to 2020, resulting in a significant high-value clustering effect. The impact of urban shrinkage on vacant residential buildings was higher than that on vacant non-residential buildings; (3) The WorldPop population data demonstrated consistent spatial distribution and trend of population change in Fushun with the residential building vacancy rate results, suggesting good reliability of the constructed evaluation model in this study. Identifying housing vacancies can help the local government to raise awareness of the housing vacancy problem in shrinking cities and to propose reasonable renewal strategies.

Cite this article

SUN Hongri , ZHOU Guolei , LIU Yanjun , FU Hui , JIN Yu . Housing vacancy identification in shrinking cities based on multi-source data: A case study of Fushun city in Northeast China[J]. Journal of Geographical Sciences, 2024 , 34(1) : 89 -111 . DOI: 10.1007/s11442-024-2196-0

1 Introduction

Since the beginning of the 21st century, urban shrinkage, along with demographic decline and economic recession, has been occurring in Western cities and is gradually spreading throughout the world (Pagano and Bowman, 2004; Hollander et al., 2009; Accordino and Johnson, 2020), with a range of economic and social impacts (Du et al., 2019; Song et al., 2020). The phenomenon of vacant housing is the most obvious feature in shrinking cities (Lee et al., 2018; Zou and Wang, 2020). Indeed, vacant housing can negatively affect the living environment and physical landscape, increase crime rates (Baba and Hino, 2019), and affect sustainable development (Pan and Dong, 2021). However, unlike Western countries, there is an urgent need to resolve the issue of identifying vacant houses in China, as there are no official statistics on vacant housing, especially at the city scale. Therefore, it is necessary to establish a housing vacancy assessment system suitable for shrinking cities.
The concept of shrinking cities was first proposed by Häußermann and Siebel (1988), then numerous scholars have successively proposed various definitions of shrinking cities (Oswalt, 2006; Schilling and Logan, 2008; Pallagst, 2010; Haase et al., 2016). Although population loss is considered a typical feature of urban shrinkage (Molotch, 1976; Wiechmann, 2008; Beauregard, 2009; Filion, 2010), there is no academic consensus on the definition of shrinking cities (Sousa and Pinho, 2015). Urban shrinkage is the reduction of physical, social, and environmental functions of non-growing cities due to population decline, slow economic growth, and deterioration of urban infrastructures (Schilling and Logan, 2008). It is a multifaceted process resulting from the interactions of physical, social, economic, and environmental factors (Martinez-Fernandez et al., 2012). Economic transformations, deindustrialization, natural resource depletion, and natural disasters are considered typical driving factors of urban shrinkage (Blanco et al., 2009; Guimarães et al., 2016; Martinez-Fernandez et al., 2016; Liu and Zhang, 2017; Chen et al., 2021). In recent years, industrial losses and unemployment in shrinking cities have resulted in sharp increases in vacant and abandoned houses (Lee and Newman, 2017). However, current related studies have not paid enough attention to vacant housing.
Currently, there is no accurate definition of housing vacancy in academic circles. The New York State Department of Taxation and Finance and the United States (U.S.) Census Bureau (2014) defined vacant housing as unoccupied houses at the time of the survey. The vacancy rate is one of the most important indicators for identifying vacant houses (Quigley, 1999). Property tax (White, 1986), water meter records (Yamashita and Morimoto, 2015), electricity consumption (Hu, 2016; Bai et al., 2019), basic amenities (Williams et al., 2019), and household electricity consumption questionnaires (Meng et al., 2009) are commonly used to identify vacant houses. In addition, remote sensing tools are also gradually becoming important technical methods for identifying vacant houses (Dong et al., 2017; Wang et al., 2019; He et al., 2020).
In shrinking cities, many residents migrate away from urban areas in search of better employment opportunities, living conditions, and services (Hartt and Hackworth, 2018). Housing decisions are significantly influenced by regional disparities in economic development (Liu and Liu, 2023). Population loss leads to a decrease in housing demand, resulting in housing vacancies (Wang and Immergluck, 2019). Cities with relatively limited economic development tend to exhibit high residential vacancy rates (Immergluck and Smith, 2006; Son et al., 2015; You and Lee, 2017; Pan and Dong, 2021). Compared to urban growth, urban shrinkage leads to the decline in the industrial sector associated with properties, while the presence of vacant houses can promote the deterioration of the living environment’s quality and affect the nearby property values in the local communities (Cohen, 2001; Immergluck and Smith, 2006; Robert et al., 2013; Son et al., 2015; You and Lee, 2017; Yoo and Kwon, 2019; Accordino and Johnson, 2020), leading to further land abandonment or housing vacancy and deterioration of the urban living environment and residents’ quality of life (Couch and Cocks, 2013; Rhodes and Russo, 2013; Riley et al., 2018; Kim et al., 2020; Liu et al., 2020). Housing vacancy can create a vicious cycle of urban shrinkage through the deterioration of the physical environment, degradation of local vitality, decline in property values, and increase in housing management costs (Han, 2013; Deng and Ma, 2015; Kim and Nam, 2016; Kim, 2019). Therefore, it is necessary to comprehensively assess the current vacant housing status in shrinking cities to prevent housing losses, urban vitality decline, and urban financial risks caused by high vacancy rates (Jin et al., 2017).
Several methods for evaluating housing vacancies have been developed in recent years based on different perspectives. However, most studies on shrinking cities have focused on the social impacts include economic development and ecological environment. In addition, accurate identifications of vacant houses and clarification of the identification process have not yet been encompassed in a unified research system. As a result, the evolution of housing vacancy in shrinking cities is still not fully revealed. Moreover, it remains also difficult to propose specific approaches to deal with the aforementioned issues. In this context, the present study aims to propose an effective method for measuring housing vacancy.
Identifying vacant houses in urban areas is difficult. This study aims to build a systematic evaluation housing vacancy model using multi-source remote sensing data, including nighttime light imagery and urban building data, to identify vacant houses and their spatial distribution quantitatively and accurately in shrinking cities in Northeast China. The formulated research questions in this study are as follows: (1) How can a methodological system be developed to identify vacant residential houses in shrinking cities using a combination of multi-source remote sensing images and urban building data? (2) What are the effects of shrinking cities on housing vacancy changes?
By combining the international definition of shrinking cities and the specificity of China’s development, this paper defines housing vacancy in shrinking cities as vacant or abandoned houses as a part of the urban shrinkage process, including residential and non-residential building vacancies. Vacant residential buildings in this study refer to residential houses that have not been sold or have remained unoccupied since their construction in 2013 and 2020. On this basis, this study proposes a method for identifying vacant residential buildings in shrinking cities to explore the relationships between shrinking cities and housing vacancies and to provide a scientific reference for related research on housing vacancies in other shrinking cities. Compared to other types of urban areas, industrial areas are less densely populated. Therefore, industrial vacancies associated with the decline of industrial functions were not considered in the present study.

2 Methods

2.1 Study area

This study was conducted in Fushun city, Northeast China, where coal resources are abundant. Since the administrative divisions of cities in China include non-urbanized areas, the study of shrinking cities that include only administrative regions as research units differs from the international definition of “urban area”. Therefore, this study extracted the physical urban area of Fushun from high-resolution satellite images using a visual interpretation method (Figure 1). Fushun is a coal-mining city located in Liaoning province and centered on heavy industrial development by state-owned enterprises, known as “coal capital”, representing an old industrial base of great merit in China’s history. In addition, Fushun is an important petrochemical, metallurgical, and equipment manufacturing base in Northeast China. Fushun was classified as a second-group resource-depleted city by the State Council in March 2009; whereas in 2013, Fushun was considered a resource-depleted transitional city. The Seventh National Census (2020) showed that the population of Fushun municipality declined by 14.97% over the 2010-2020 period, with significant population declines in districts. Except for 2007, Fushun’s natural growth rate has continued to decline since 2003, which is a typical characteristic of a shrinking city with exhausted coal resources. The physical urban area encompasses the economic center of Fushun, supporting functions administration, cultural, and transportation functions. According to the WorldPop population data, the population loss in the physical urban area of Fushun increased by 6.07% from 2013 to 2020, showing typical shrinking characteristics; whereas the physical urban area of Fushun increased from 212.3 to 215.6 km2 in 2013 and 2020, respectively. Compared to other cities, a low urban expansion rate is observed in Fushun, indirectly demonstrating a certain degree of urban shrinkage in the physical urban area of Fushun. The exploration of vacant housing in Fushun can, therefore, provide a reference for the transformation of this coal-resource- based city.
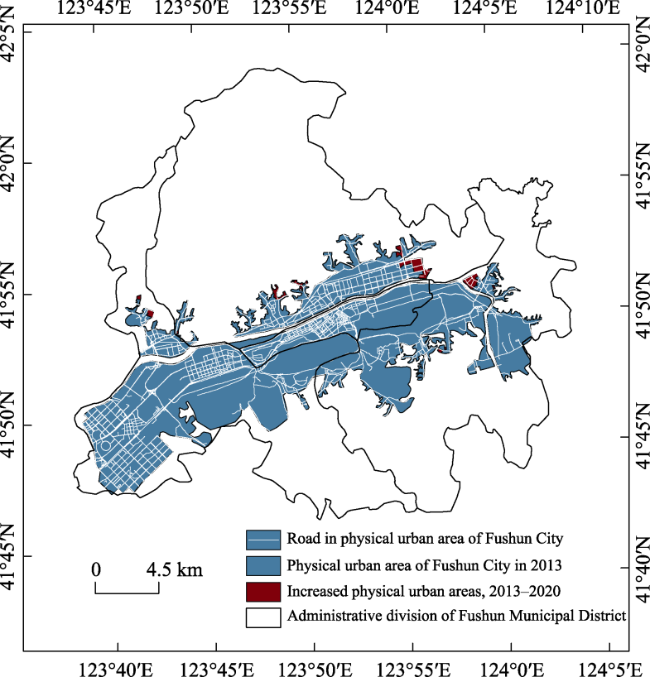
Figure 1 Geographic location of the study area (Fushun city, Northeast China)

2.2 Data sources

The data sources used in this study are reported in Table 1. The administrative division data were derived from the Ministry of Natural Resources of China, while the land cover data were obtained from the Systematic Earth Science Research Center of Tsinghua University. Furthermore, the nighttime light imagery data of the Annual VNL V2 of the Visible Infrared Imaging Radiometer Suite (VIIRS) were obtained from the website of the Earth Observation Group (EOG). Point of Interest (POI) data were obtained from Amap. The building data were derived from 91 Weitu (enterprise edition), while the population data were obtained from the WorldPop database of the University of Southampton, UK. The road network data were derived from the Resource and Environment Science Data Center of the Chinese Academy of Sciences, while statistical data were from relevant statistical yearbooks.
Table 1 Data sources and descriptions
Data Resources Data description
Administrative
division data
Ministry of Natural Resources in China
Land use data Resource and environment science and
data center (https://www.resdc.cn/)
1:100,000 vector land use data.
Google Earth (2013-2020) 91 Weitu (enterprise edition) The spatial resolution of the image is 3.78 m.
The nighttime light imagery data (2013-2020) Earth Observation Group (EOG) (https://payneinstitute.mines.edu/eog/) After projection, resampling and image rectification, the data is superimposed with the land use data.
Road network data Resource and environment science and
data center (https://www.resdc.cn/)
The data includes information on highways, provincial roads, national roads, county roads, township roads, railroads, etc., which can be used after projection and cropping.
Building data (2013-2020) 91 Weitu (enterprise edition) and Map World After vectorization, we can obtain the building ground profile data.
WorldPop (2010-2020) University of Southampton, UK (https://www.worldpop.org/) The data image size is 100 m×100 m, which can be used after data correction.
POI (2013 and 2020) Amap Crawl relevant data using Python programming.
Baidu Street View Map Baidu Map (https://map.baidu.com) Store street view maps for use in verifying building floor estimates.
Statistic data Fushun Statistical Yearbook (2013-2021)
China City Statistical Yearbook (2013-2021)
The Seventh National Census

2.3 Methods

2.3.1 Housing vacancy estimation rate model

The present study aims to estimate the housing vacancy rates using nighttime light imagery data, high-resolution remote sensing image data, and urban building data. The identification process includes five main steps that were performed using Envi and ArcGIS software (Figure 2). First, the buildings’ shadows were extracted, then the number of floors in buildings was estimated. Second, the contribution of road light intensity to nighttime lighting was estimated to eliminate the influence of road reflectivity on the obtained results. Third, the contribution of the non-residential building light intensity with mixed pixels to nighttime lighting was estimated to eliminate the impact of the non-residential building reflectivity on the obtained results. Fourth, the full pixels were extracted, then the night light contribution per unit building area of a pixel was calculated. Finally, the night light contribution per unit building area of the entire pixels was calculated. The housing vacancy rate was determined as the difference between the ratio of the above two and 1.
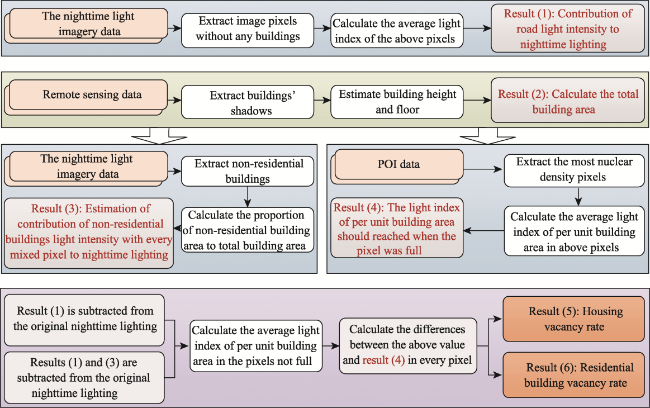
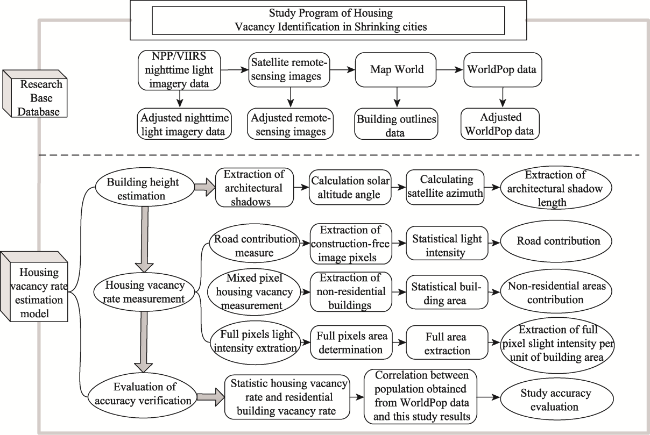
Figure 2 Flowchart of the adopted methodology for this study
(1) Building height estimation model
The basic attributed information to the high-resolution remote sensing image contains the geographic locations, heights, and bottom areas of the buildings. In this study, the projection length of the buildings was calculated based on their projected shadows. Envi software was used to perform supervised classification of remote sensing images of Fushun city using parallelepiped classification (Figure 3). The ROI tool was first used to create the regions of interest (ROI) (Figure 3a), then the average spectral curve and the basic results of building shadow classification were obtained, as shown in Figure 3b.
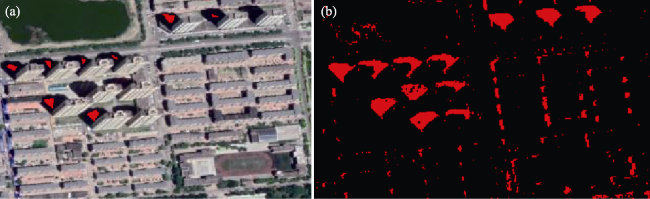
Figure 3 Extraction of the shadow length of the buildings in Fushun city, Northeast China: (a) Region of interest; (b) Classification results
The building heights were determined by a trigonometric calculation of the relative positions of the sun, satellites, and buildings, and there are two situations in relation to the position of the sun, the satellite and the shadow. To simplify the calculation, the following assumptions were formulated in this study: (1) The buildings are located in a plain area with no interfering topographical features; (2) The buildings are vertical to the earth’s surface. The building height, the actual length of the building shadows, the visible length of the building shadows, the satellite altitude angle, and the solar altitude angle were marked by H, S, L2, α, and β, respectively.
As shown in Figure 4a, when the sun and the satellite are on the same side of the building, the actual length of the shadow of the building and the visible shadow length can be expressed as S = H/tanβ and L2=S-L1 = H/tanβ-H/tanα, respectively. Therefore, the relation between H and L2 can be expressed using the following equation:
H = L 2 × tan α × tan β / tan α tan β
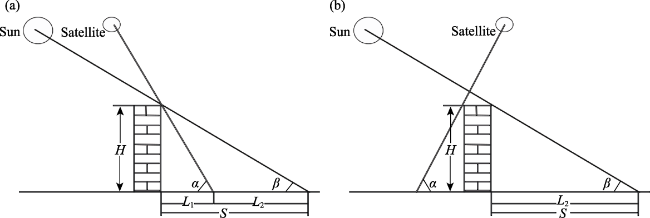
Figure 4 Schematic diagram of the relationship between the sun, satellites, buildings, and shadows: (a) Sun on the same side as the satellite; (b) Sun on the opposite side of the satellite
As shown in Figure 4b, when the sun and the satellite are located on the opposite sides of the building, S and L2 on the remote sensing image are equal at an L1 value of 0. In this case, the relationship between H and L2 can be expressed as follows:
H = L 2 × tan β
(2) Model for estimating the residential building vacancy rate in shrinking cities
Housing vacancy data are difficult to obtain in China. Therefore, previous related studies have performed correlation analysis tests and showed that the nighttime light imagery data are conclusively positively correlated with regional population and economic indicators (Ma et al., 2014). In addition, most related studies have used nighttime light imagery data and public review data to estimate residential building vacancy rates (Wang et al., 2019). Due to errors in remote sensing images and insufficient sample size of public reviews, this paper combined the VIIRS Annual VNL V2 nighttime light imagery data with POI and urban building data to minimize the remote sensing image-derived estimation error. The methodology adopted for estimating the housing vacancy rates (HVR) is shown in Figure 5. The specific estimation steps are as follows:
Figure 5 Calculation process of the housing vacancy rate
1) Contribution of the road light intensity to nighttime lighting
Since road reflectivity in remote sensing images can influence the research results of housing vacancy, the contribution of road light intensity to nighttime lighting needs to be eliminated prior to the calculation process of the following steps. Image pixels without any buildings in the physical urban area of Fushun city were first selected, then their average image light intensity was considered as the average contribution of road light intensity to nighttime lighting, according to the following formula:
R A j = j = 1 n N T L j / N
where RAj denotes the contribution of the road light intensity to nighttime lighting in a mixed pixel j; NTLj denotes the initial nighttime light imagery index of the image pixel j; N denotes the number of image pixels without buildings.
2) Identification of the residential buildings
The classification of residential buildings is a challenging task, as comprehensive ground information is required. In this study, we identified the residential buildings using the spatial overlay of different datasets, namely urban building, POI, high-resolution satellite, and Baidu Street View Map datasets. The identification process of the residential buildings was divided into three steps. We first extracted the residential facilities from the POI data and overlaid them with urban building data to determine the basic scope of the residential area. Second, we used high-resolution satellite data to modify the building attribute information through visual interpretation. Third, we verified the residential building results using Baidu Street View Map.
3) Estimation of the contribution of the non-residential building light intensity to nighttime lighting in mixed pixels
This study aims to estimate the residential building vacancy rates in shrinking cities by modeling the relationship between the nighttime light imagery index and the light intensity of residential areas. The nighttime light imagery indices encompass residential building light intensities, non-residential building light intensities, and road light intensities. The calculation of the residential building vacancy rate requires the elimination of the influences of entertainment and commercial facilities. Therefore, the contribution of the non-residential building light intensities to the nighttime lights can be expressed as follows:
N R A i = N T L i R A i / V a r e a i × R D a r e a i
V a r e a i = A M , i , j × F M , i , j
N R A c i t y k = a v g i = 1 n N A R i
where NRAi denotes the contribution of the non-residential building light intensity to the nighttime light imagery index in mixed pixel i; NTLi denotes the initial nighttime light imagery index of the image pixel i; Vareai denotes the total building area contained in pixel i; RDareai denotes the total non-residential building area of pixel i; AM,i,j denotes the coverage of building j in pixel i, FM,i,j denotes the floor number of building j in pixel i; NRAcityk denotes the contribution of the non-residential building light intensity to nighttime light in mixed pixels in city k.
4) Distinguishing the full pixels namely without vacant houses
To estimate the residential building vacancy rate, Pan and Dong (2021) considered the 20% of areas with the highest nighttime light imagery indices as full residential areas. Wang et al. (2019) considered the image pixel as full area value when the per capita living space of the image pixel is higher than the statistical value of the area. By referring to previous related studies, we assumed that the housing vacancy phenomenon is more obvious in shrinking cities compared to that in growing cities. It is necessary to select optimal urban thresholds for shrinking cities in combination with their urban development laws. This study suggests that the POI data can, to a certain extent, reflect the population activity status and the population distribution characteristics. Moreover, the POI data can be used to characterize the development status and capability of shrinking cities for housing vacancy. In this study, we assumed that the top 20% of image pixels with the highest POI kernel densities represent significantly densely populated areas in Fushun, basically meeting the urban commodity traffic demand. The 20% threshold basically covers the central old town of Fushun city, where there is the most concentrated distribution of population, the highest population density, and the most commercial service facilities in Fushun. Indeed, these areas are considered to exhibit the lowest housing vacancy rates. Therefore, we extracted the 20% image pixels with the highest POI kernel density as the full pixels. The contribution of the light intensity to the nighttime lights of full pixels can be expressed as follows:
  F R A f = N T L f R A f / n × V a r e a f
where FRAf denotes the contribution of the light intensity to the nighttime lights in full pixel f; NTLf denotes the initial nighttime light imagery index of full pixel f; RAf denotes the contribution of the road light intensity to the nighttime lights of complete pixel f; Vareaf denotes the total building area contained in full pixel f; n denotes the number of the full pixels.
5) Estimation of the housing vacancy rate (HVR)
Housing vacancy refers to both residential and non-residential building vacancies. Based on the results of the above-mentioned contribution measures of the roads, non-residential buildings, and full pixels light intensity to the nighttime light, the estimation model of the housing vacancy rate in shrinking cities can be expressed as follows:
HVR i = 1 NTL i RA i V areai × FRA f             a . h o u s i n g v a c a n c y w i t h i n m i x e d p i x e l s 1 NTL i RA i NRA i V areai × FRA f    b . r e s i d e n t i a l b u i l d i n g v a c a n c y w i t h i n m i x e d p i x e l s    0                                      c . h o u s i n g v a c a n c y w i t h i n f u l l p i x e l s
H V R c i t y k = 1 i = 1 n N T L i R A i F R A i × n              a . h o u s i n g v a c a n c y 1 i = 1 n N T L i R A i N R A i F R A i × n b . r e s i d e n t i a l b u i l d i n g v a c a n c y
where HVRi denotes the housing vacancy rate of pixel i in the mixed pixels. Otherwise, HVRi denotes the residential building vacancy rate of pixel i in the mixed pixels; HVRcityk denotes the housing vacancy rate in city k. Otherwise, HVRcityk denotes the residential building vacancy rate in city k. NTLi denotes the initial nighttime light imagery index of pixel i; RAj denotes the contribution of the road light intensity to the nighttime light of pixel i; NRAi denotes the contribution of the non-residential building light intensity to the nighttime light imagery index in mixed pixel i; FRAi denotes the contribution of the light intensity to the nighttime light of full pixels; n denotes the total number of the city k.
6) Accuracy evaluation
In this study, we adopted a demographic perspective to assess the accuracy of the obtained results using population data derived from WorldPop. In addition, these data were combined with those derived from the 2020 census to correct the spatial data. Gray correlation analysis is a quantitative method used to describe and compare the development and changes in the trend of a particular system. The basic idea is to determine the degree of similarity between the geometric shape of the reference data variable and multiple other data variables to determine the strengths of their relationships and the correlation between their reaction curves. The Gray correlation coefficient can be expressed as follows:
ζ i k = min i min k y k x i k + ρ max i max k y k x i k y k x i k + ρ max i max k y k x i k
where
ζ i k
denotes the number of the correlation coefficients between the reference sequence and the i-th comparison sequence at time k, ρ denotes the resolution coefficient, which is used to reduce the effect of a maximum value on the distortion of the correlation coefficients, thus improving the resolution between the correlation coefficients. Although the ρ value ranges from 0 to 1, it usually equals 0.5.

2.3.2 High-low clustering

In this study, the high-low clustering method was used to intuitively assess the characteristics of the spatio-temporal differentiation of housing and residential building vacancies. The General G statistic of the overall spatial association of the high-low clustering is expressed as follows:
G = i = 1 n j = 1 n w i , j x i x j i = 1 n j = 1 n x i x j , j i
where xi and xj denote the attribute values of features i and j; wi,j denotes the spatial weight between features i and j; n denotes the number of features in the dataset;
j i
indicates that features i and j are not the same feature.

3 Results

3.1 Identification process of vacant houses

The building height was inferred by extracting the height of the building shadows from the high-resolution satellite remote sensing images. The building floor estimation results were obtained based on the height of a single floor, which equals approximately three meters. Baidu Street View Map was used to determine the accuracies of the estimation results and the number of floors in the building (96.77%), as well as to draw the corresponding residual map (Figure 6). It can be seen from Figure 6 that the method was feasible and effective in extracting the number of building floors.
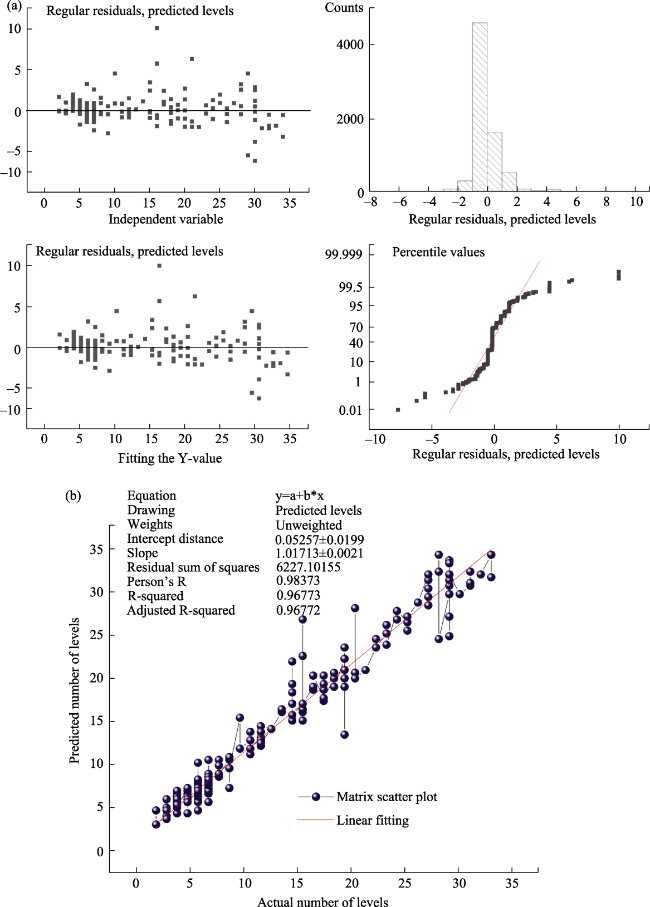
Figure 6 Linear fitting at the building level and residual diagram: (a) Residual diagram; (b) Linear fitting at the building level
Combined with the actual development characteristics of Fushun city, the top 20% of the POI kernel density image pixels were considered full pixels. By counting the physical urban areas of Fushun, 198 and 200 full pixels were extracted in 2013 and 2020, respectively, as the full housing vacancy regions (Figure 7). The average contributions of the light intensities to nighttime lights of the full pixels in 2003 and 2020 were 0.0002 and 0.000158, respectively, indicating a substantial decrease.
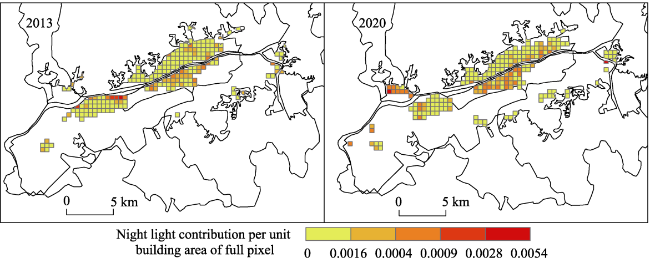
Figure 7 Night light contribution per unit building area of full pixel in Fushun city, Northeast China
The extracted image pixels without buildings from the physical urban area and their average nighttime light imagery index resulted in road light intensity contributions to the nighttime lights of 4.8 and 5.0 in 2013 and 2020, respectively. The contribution of the total building area to the nighttime light imagery index was calculated following the elimination of the contribution of the road light intensity to nighttime light. Consequently, the contribution of the nighttime light index per unit of building area was obtained (Figure 8). The obtained results showed a decreasing trend in the contribution of the nighttime light imagery index per unit building area in Fushun. The high values were mostly distributed along the surrounding areas. The non-residential buildings were extracted in this study from the high-resolution remote sensing images. Indeed, the contributions of the non-residential building light intensity to nighttime light in mixed pixels were 0.000175 and 0.000194 in 2013 and 2020, respectively.
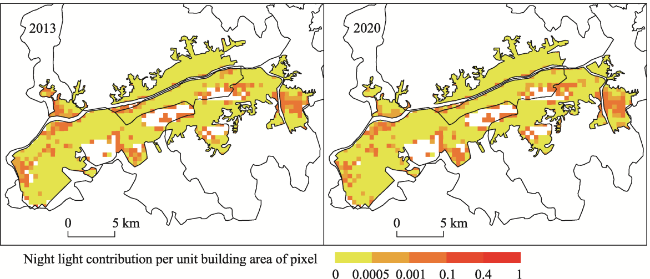
Figure 8 Night light contribution per unit pixel building area in Fushun city, Northeast China

3.2 Housing and residential building vacancies

Based on the housing vacancy estimation model, this study obtained the visualization results of housing vacancy in Fushun city and analyzed the overall distribution of vacant housing using the high-low clustering process (Figure 9). The housing vacancy rate in Fushun is trending downward from 2013 to 2020. In contrast, the residential vacancy rate is on a significant upward trend, exceeding 20% by 2020. Although Fushun is a typical shrinking city with a significant population loss, urban shrinkage did not result in a substantial increase in overall urban vacancy directly. The residential buildings were the main building facility type in Fushun. Nevertheless, the impact of the non-residential vacant buildings on housing vacancies cannot be ignored.
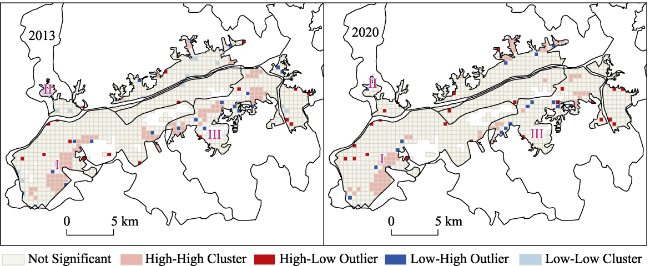
Figure 9 Spatial patterns of the Getis-Ord General (G) housing vacancy results in Fushun city, Northeast China
The Getis-Ord General (G) results showed high and low clustering of the vacant houses in the edges and central parts of Fushun (Figure 9). The high housing vacancy rates were clustered in the southern part of the city, mostly distributed near coal-mining subsidence areas, indicating a vacant housing phenomenon caused by the decline in coal mine production in Fushun. Besides the number of significant agglomeration vacant housing areas, the non-residential building vacancy rate decreased substantially over the 2013-2020 period due to the impacts of urban commercial and public services. However, there is still high-value vacant agglomeration in marginal areas. The remote sensing images showed that most areas with high housing vacancy rates are occupied by enterprises or factories. Since the nighttime light imagery data, there are few workers or employees in factories or enterprises overnight. Therefore, the vacancy rates of factories, enterprises, and other facilities may be substantially high due to data restrictions.
Reference to the “Fushun City Urban Master Plan (2011-2020)” (FNRB, 2017), Region I in Figure 9 represents industrial land with slight environmental pollution. The high vacancy rates in Region I might be due to the non-working states of the industrial sites at night. Region II consists of a mix of commercial and residential land. The use of the remote sensing images revealed some undeveloped land and newly built residential houses in Region II in 2013 and 2020, resulting in high and low housing vacancy rates, respectively. Region III in Figure 9 covered a large ecological restoration land. Due to the continuous coal mining activities, Region III has become a coal mining subsidence area and is currently in a state of pending restoration, resulting in high vacancy rates.
In this study, we extracted residential buildings and calculated their vacancy results based on the identification results of housing vacancy in the study area, as shown in Figure 10. The results show an upward trend in residential building vacancy rates from 2013 to 2020. Most of the vacant houses are mainly low-rise bungalows, which were concentrated in the peripheral areas of the city with obvious spatial clustering characteristics.
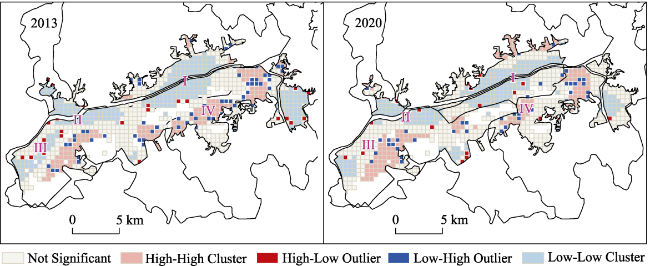
Figure 10 Spatial pattern of the Getis-Ord General (G) residential building vacancy results in Fushun city, Northeast China
Reference to the “Fushun City Urban Master Plan (2011-2020)” (FNRB, 2017), Regions I and II in Figure 10 consisted of largely residential land and old urban areas. Land use types include administrative office land, commercial facility land, and public service facility land, with convenient transportation characteristics and good infrastructure. Although the settlements in regions I and II were generally old neighborhoods, the vacancy rate was low due to high population density and well-developed commercial facilities and public management facilities. Region III consisted of administrative offices and residential land. However, it should be noted that the administrative land is usually unoccupied at night, resulting in a high residential building vacancy to some extent. Region IV was surrounded by a large number of parks, green areas, and collapsed areas formed by coal mining activities. Indeed, a large number of residents were relocated due to the impact of the collapsed areas, resulting in the formation of a high-value cluster of residential housing vacancy rates.
The obtained results showed consistent spatial trends of the housing and residential building vacancies in the study area (Figure 11). Fushun is a coal mining resource-based shrinking city. According to the “Fushun City Urban Master Plan (2011-2020)” (FNRB, 2017), there are five ecological restoration sites in the southern part of the urban territory of Fushun entities, where coal mining-induced collapse areas are located. Region I (Figure 11) is an industrial region with high levels of air and environmental pollution. Industrial pollution increased substantially the housing and residential building vacancy rates due to the relocation of some residents. In recent years, overexploitation of coal resources has led to several mining pits in the southern part of the city, affecting some buildings and forcing residents to relocate and, consequently, resulting in a large number of vacant houses. Meanwhile, Fushun lacks alternative industries to replace the traditional industry. Transforming a leading indus-try remains challenging. Indeed, due to the economic depression of coal mining enterprises in the leading industry and a large number of unemployed workers, the urban economic development capacity and urban vitality have gradually declined, resulting in high vacancy rates in the southern part of Fushun. The vacancy rate substantially changed from 2013 to 2020.
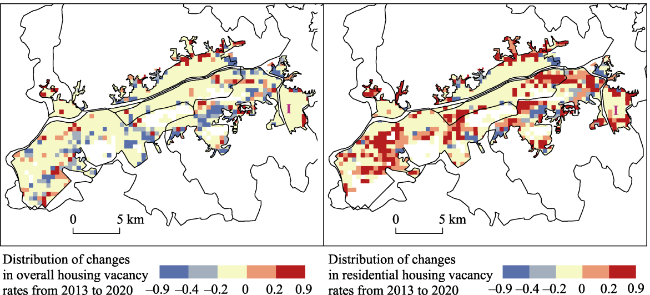
Figure 11 Distribution of the housing vacancy rates in 2013 and 2020 in Fushun city, Northeast China

3.3 Validation of the housing vacancy results in shrinking cities

Using the WorldPop population data, the spatial distribution pattern of the population density in Fushun followed a central-edge spatial structure. The K-means clustering method was used to classify the population density into two categories, namely high population density (central urban) and low population density (peripheral urban) areas (Figure 12). According to the obtained results, both the housing vacancy rate and the residential building vacancy rate were low in the central urban area and high in the peripheral urban area in 2013 and 2020. Compared with the overall housing vacancy rate, the residential building vacancies were more serious. The results indicated consistent patterns of the population density and housing vacancy rates in the physical urban area of Fushun, showing low and high vacancy rates in densely and sparsely populated areas, respectively. This finding indicates that the proposed model and methodology in this study were feasible and reliable.
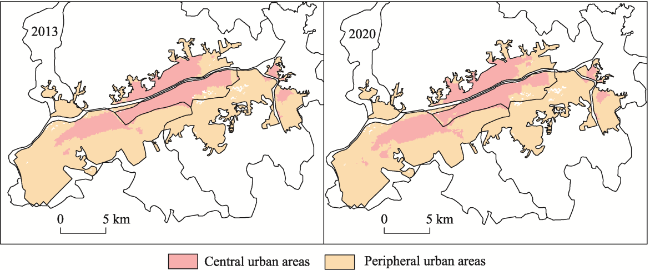
Figure 12 Spatial distribution of the central and peripheral urban areas of Fushun city, Northeast China
According to the Gray correlation results (Figure 13), the population change rates had a stronger influence on the changes in the residential building vacancy rates, indicating that the residential building vacancy results can effectively reflect the characteristics of differentiation in population in Fushun. Therefore, our research results have certain validity and accuracy. The population change rates exhibited a higher correlation coefficient with the residential building vacancy change rates than that with the housing vacancy rates of 0.946. It should be noted that the housing vacancy phenomenon in shrinking cities does not intensify with population loss. Moreover, urban shrinkage can promote residential building vacancy to some extent, further demonstrating that the research scheme of this study can reflect the developmental composition of shrinking cities. The correlation between the population and residential building vacancy change rates demonstrated consistent trends of these variables, demonstrating a good accuracy of residential building vacancy results, as well as the effect of urban shrinkage on urban housing vacancy to some extent. Indeed, the impact of urban shrinkage on residential building vacancy was substantially higher than that on non-residential building vacancy.
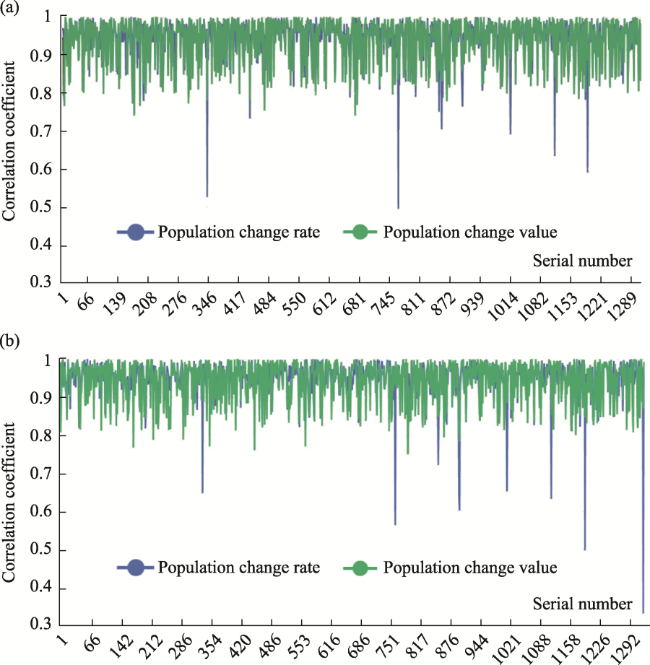
Figure 13 Gray correlations of the population change rates with the housing vacancy rates (a) and residential building vacancy rates (b)
Fushun city is radially distributed along the Hunhe River. The spatial development of Fushun takes place along the Hunhe River on both sides as an axis, which is the development center of the city. Fushun is dominated by low-rise buildings. According to residents’ responses in a field survey conducted by Yang (2022), the housing vacancy rates in the development center are low. To meet the needs of urban development, the western part of Fushun has gradually been developed into a new high-level living space. However, according to local residents, they prefer to invest in the provincial capital city rather than Fushun if they have enough capital due to the western part of Fushun proximity to the eastern part of the provincial capital (Shenyang city). This is also the reason for the delayed development and high quality of residential properties. However, the occupancy rates remain low in the western part of Fushun (Yang, 2022).
As a coal mining resource-based shrinking city, the southern part of Fushun suffers from ground subsidence due to coal mining. There is a large collapsed area of the central urban area, covering 27.5% of the total land of Fushun (FMPG, 2011). As a result, the municipal government moved a large part of the residential areas on the collapsed land, leading to a large number of vacant and abandoned houses and, consequently, resulting in high vacancy rates in the southern part of Fushun. This also proves that the nighttime lighting image data-based results of housing and residential building vacancies in the physical urban area of Fushun are consistent with the actual data in this study.

3.4 Reasons for the changes in the housing vacancy rates

Fushun city is an important old industrial base in China. As a resource-based city with a continuous consumption of coal resources, Fushun has begun to suffer unprecedented population losses. The output value of industrial enterprises in the study area revealed a decreasing trend over the 2013-2020 period. Consequently, a large number of workers became unemployed. The economy in the study area is depressed, while the population showed a declining trend over the 2013-2020 period, increasing the number of vacant houses. According to the study data, Fushun had 16,806 and 47,746 non-residential points in 2013 and 2020, respectively. Commercial facilities showed a substantial growth trend, resulting in a decrease in the housing vacancy rates of the city. On the one hand, despite population decline and economic recession, shrinking cities are oriented to development, with continuous increases in the building areas without reductions in commercial or public services (Yang et al., 2015). A new economic development area was gradually built to increase the economic benefits. Shenyang-Fushun New Town was developed to physically connect Fushun with the provincial capital (Shenyang). This development aims to establish new economic boosts in Liaoning province (FMPG, 2016). On the other hand, the commercial center of Fushun is still attractive to residents. To strengthen the economic capacity of the commercial center, a huge traditional market was built to promote residence consumption, thus enhancing regional economic development. Therefore, the goal of strengthening the initial commercial center guided by urban planning and policies was effectively strengthened through the occupation of space, thus further increasing the number of non-residential buildings and reducing the housing vacancy rates (Yang, 2022).

4 Discussion

The identification and estimation of housing vacancies in China are difficult due to the lack of official statistics. This study aims to assess housing and residential building vacancies in Fushun city, Northeast China, using a multi-source remote sensing-based identification method. The housing vacancy in the physical urban area of Fushun was identified using the nighttime light imagery data; whereas the WorldPop population data were used to validate the identification results. The nighttime light imagery data represents comprehensive high spatial resolution data, closely related to the intensities of human activities and the states of socio-economic development. These data are timely updates, objective, and complete time series. Moreover, they are not restricted by administrative divisions, explaining the deficiencies of existing studies in terms of basic data support and research programs.
In this study, the building heights and floor information were extracted based on the shadows projected by buildings. The results were verified using Baidu Street View Map. The project building shadows resulted in a building height inversion accuracy of 96%, further demonstrating the reliability of the basic data used in this study to a certain extent. Moreover, the contribution of the road light intensity to the nighttime light was determined in this study separately, while the reflectance of the non-residential buildings in the nighttime light imagery was extracted individually. The contribution of the nighttime light imagery index of the building area in each image pixel was determined based on an estimation module refinement. The use of the POI data to extract the full areas of shrinking cities in different years can effectively ensure the accuracy and scientific merit of the housing vacancy research basis.
In this study, the building outline data were extracted from Map World, while the building shadow data were extracted from historical remote sensing images of 91 Weitu (enterprise edition). These data were used to calculate the building height and floor data. This method has wide applicability, especially in areas where urban shrinkage often occurs. In this study, we extracted the image pixels without building and removed the influence of roads on the nighttime light index using the nighttime light imagery and remote sensing image data before calculating the total non-residential building area in every mixed pixel and their influences on the nighttime light index. This method can be completely applied to other study areas. Moreover, we used the top 20% pixel with the highest POI kernel densities to extract urban full area. This threshold was selected according to the current situation of Fushun’s development. The threshold covered an urban area with a high population proportion of 45.51%, which is the most prosperous area of Fushun’s economy. From an application perspective, the regional population coverage ratio was further compared with the highest POI kernel density value, then the mutation threshold method was used to extract urban thresholds. Finally, the extracted urban thresholds were used to determine the housing vacancy rates of each region. These methods may be applicable to other cities when the reasonable threshold was extracted by above methods.
The findings of the present study were further validated using demographic data. The results showed a consistent housing vacancy distribution with the population distribution, showing a correlation between urban shrinkage and housing vacancy. Urban shrinkage has a higher impact on residential building vacancy than on non-residential building vacancy. Based on the historical statistical report of the Survey and Research Center for China Household Finance, the residential building vacancy rate in urban areas of China was 21.4% in 2017. On the other hand, the results of this study showed the residential building vacancy rate was more than 20% in 2020, which is consistent with the results reported in previous studies, highlighting that most cities in China have a housing vacancy rate of more than 20% (Survey and Research Center for China Household Finance, 2019). In addition, the identification housing vacancy results of this study showed some similarity with those reported in previous related studies. The housing vacancy rate in shrinking cities was mostly low in the central urban areas and high in the peripheral urban areas, which is consistent with the actual urban development. This finding demonstrates the effectiveness of multi-source remote sensing data in identifying housing vacancies. This method has a certain degree of generalization and applicability.
Pan and Dong (2021) extracted image elements with less than 20% built-up land pixels as non-residential image elements and considered their average value as a contribution of non-residential buildings to the nighttime light index. Wang et al. (2019) considered image pixels as a full area at a per capita living space of the image pixel higher than the statistical value of the area. In contrast, we directly extracted non-residential buildings in this study, including hospitals and schools, from high-resolution satellite images, then calculated their total building area to determine the contribution of the non-residential buildings to the nighttime lighting index in each image element, which may result in high result accuracy. Moreover, we assumed that the physical urban area is densely populated, with frequent economic activities and developed businesses, thus decreasing the per capita residential area. Therefore, we used the POI kernel density to reflect areas with the most frequent business activities and the higher population density in Fushun. Newman et al. (2019) highlighted an increasing trend in housing vacancies as a result of a decrease in population density and an increase in urban areas may increase housing vacancies, which is consistent with our findings that showed a strong effect of urban shrinkage on housing vacancy. According to a survey conducted in Daegu City, Korea, housing vacancies may increase considerably in the presence of abundant adjacent vacant houses in neighborhoods (Park, 2019), which is consistent with the results of this study, showing spatial clustering characteristics of housing vacancies in Fushun.
As a typical shrinking city with depleted coal resources in China, Fushun’s urban space should be transformed from expansionary growth to connotative enhancement. In addition, the spatial quality of the developed areas should be continuously improved, taking into account the urban renewal strategy. Vacant houses may be a valuable “asset” for shrinking cities. Local authorities of Fushun can reorganize and optimize the functional urban layout based on the vacant houses. The Fushun municipal government and individuals can promote the reuse of vacant houses as spaces for young people to live or set up their businesses through low-cost rental or sale of these properties. In addition, the Fushun municipal government, planners, and residents should collaborate to create a good living environment and community atmosphere to attract new residents to relocate to Fushun.
Housing vacancy in shrinking cities is more likely to lead to housing abandonment, thus increasing crime rates and degrading landscapes. The results of this study indicated a residential building vacancy rate in shrinking cities higher than 20%, which is considered a high-risk vacancy globally. This study contributes to raising the government’s awareness of the housing vacancy issue in shrinking cities. However, many governments are still mainly oriented towards large-scale urban growth, which is inconsistent with the trend of shrinking city development. It is necessary to change the growth-based planning paradigm and adopt a rational perspective on urban housing supply and demand. In addition, it is crucial to understand the objective laws and trends of real estate market development in shrinking cities, promote smart shrinkage, and implement effective policies to manage housing vacancy rates. Different measures can be applied to diverse types of housing vacancies. The occurrence of substantially high housing vacancy rates in regions can easily induce panic among residents and increase vacancy rates with continuous population losses. Urban renewal or ecological restoration can be implemented in areas with high vacancy rates as transformative measures to meet the needs of residents. The demolition of dilapidated and abandoned housing is conducive to creating a suitable living atmosphere, thus attracting the population to shrinking areas. On the other hand, for areas with low vacancy rates, where supply is lower than demand and housing prices are more likely to rise, the vacancy rates can be maintained through the implementation of effective regulation and control policies to reasonably change population distribution and re-balance urban development.
However, this study has two main limitations. First, the spatial resolution of the two consecutive years-VIIRS Annual VNL (V2) nighttime light imagery data was 500 m× 500 m. This resolution is, indeed, slightly lower than that of the Luojia-1 data, which might lead to some errors in the obtained results. Although the high-resolution Luojia-1 data were used in some studies to explore urban issues, Luojia-1 data cannot be obtained in consecutive years, making it difficult to comprehensively explore the time-series evolution issues. Therefore, the VIIRS Annual VNL (V2) data were used in this study to estimate the housing vacancy rates. Second, the obtained results were validated for accuracy using a small-sized statistical dataset. Although we validated the obtained results based on a demographic perspective and adjusted WorldPop population data based on the actual population statistics, further comprehensive discussion of the results is required.

5 Conclusions

In recent years, the housing vacancy has become a common problem in China, especially in shrinking cities. Therefore, it is necessary to explore the vacant housing issue in shrinking cities to accurately identify vacant houses. In this study, a systemic method was developed to identify vacant houses in shrinking cities based on nighttime light imagery data, high-resolution remote sensing images, and building outlines and heights. In addition, the obtained results were validated using demographic data of Fushun.
This study proposed a multi-source remote sensing images-based estimation method to improve the identification process. In addition, optimal thresholds were determined based on the development characteristics of shrinking cities and demographic data to validate the obtained results. The obtained results demonstrated the reliability and effectiveness of the proposed method.
(1) According to the spatiotemporal distribution pattern of housing vacancy in Fushun, the lowest and highest housing vacancy rates were observed in the central and peripheral urban areas, respectively, showing an overall decreasing trend; whereas the residential building vacancy rate exhibited an obvious increasing trend. In addition, the results showed a clustering effect in areas with high vacancy rates with a persistent housing vacancy problem.
(2) There was a certain correlation between urban shrinkage and housing vacancy. The housing vacancy rate was influenced by non-residential building vacancy fluctuations. However, the impact of urban shrinkage on residential building vacancy was higher than that of non-residential building vacancy.
Housing vacancy is a relatively new research topic in China. Indeed, there are few studies on vacant housing in shrinking cities. The present study proposes a novel method for identifying housing vacancy based on various research theories on shrinking cities, analyzing spatiotemporal pattern of housing and residential building vacancies, and contributing to the housing vacancy research theories in China. Therefore, this study provides a theoretical basis for ensuring the sustainable development of shrinking cities. Moreover, this paper proposes a technical route for identifying and analyzing housing and residential building vacancies in shrinking cities, providing a reference for future research.
[1]
Accordino J, Johnson G T, 2020. Addressing the vacant and abandoned property problem. Journal of Urban Affairs, 22(3): 301-315.

DOI

[2]
Baba H, Hino K, 2019. Factors and tendencies of housing abandonment: An analysis of a survey of vacant houses in Kawaguchi City, Saitama. Japan Architectural Review, 2(3): 367-375.

DOI

[3]
Bai Y, Wan Y, Zhang S et al., 2019. Influencing factors about the housing vacancy rate: A case study of Hefei. Architecture & Culture, (9): 69-71. (in Chinese)

[4]
Beauregard R, 2009. Urban population loss in historical perspective: United States, 1820-2000. Environment and Planning A: Economy and Space, 41(3): 514-528.

DOI

[5]
Blanco H, Alberti M, Olshansky R et al., 2009. Shaken, shrinking, hot, impoverished and informal: Emerging research agendas in planning. Progress in Planning, 72(4): 195-250.

DOI

[6]
Chen Q, Xue D, Ma B et al., 2021. Population shrinking pattern and driving forces in the Loess Plateau region. Arid Land Geography, 44(1): 258-267. (in Chinese)

[7]
Cohen J R, 2001. Abandoned housing: Exploring lessons from Baltimore. Housing Policy Debate, 12(3): 415-448.

DOI

[8]
Couch C, Cocks M, 2013. Housing vacancy and the shrinking city: Trends and policies in the UK and the city of Liverpool. Housing Studies, 28(3): 499-519.

DOI

[9]
Deng C, Ma J, 2015. Viewing urban decay from the sky: A multi-scale analysis of residential vacancy in a shrinking U.S. city. Landscape and Urban Planning, 141(3): 88-99.

DOI

[10]
Dong L, Pan J, Feng Y et al., 2017. Spatial difference pattern of house vacancy in China from nighttime light vie. Economic Geography, 37(9): 62-69, 176. (in Chinese)

[11]
Du Z, Zhang H, Ye Y et al., 2019. Urban shrinkage and growth: Measurement and determinants of economic resilience in the Pearl River Delta. Journal of Geographical Sciences, 29(8): 1331-1345.

DOI

[12]
Filion P, 2010. Growth and decline in the Canadian urban system: The impact of emerging economic, policy and demographic trends. Geojournal, 75(6): 517-538.

DOI

[13]
Fushun Municipal People’s Government FMPG, 2011. Fushun land use general plan, 2006-2020. Retrieved from: http://g.mnr.gov.cn/201807/t20180731_2156872.html. (in Chinese)

[14]
Fushun Municipal People’s Government FMPG, 2016. Fushun 13th Five-year Plan for national economic and social development. Retrieved from: https://fgw.ln.gov.cn/fgw/attachDir/2022/02/2022021614242613153.pdf. (in Chinese)

[15]
Fushun Natural Resources Bureau FNRB, 2017. Fushun City Urban Master Plan (2011-2020). Retrieved from: https://zrzy.fushun.gov.cn/002/002013/002013001/002013001003/20171110/96db1f27-4c3d-45c6-8d2b-38666f0aeab6.html. (in Chinese)

[16]
Guimarães M H, Nunes L C, Barreira A P et al., 2016. What makes people stay in or leave shrinking cities? An empirical study from Portugal. European Planning Studies, 24(9): 1684-1708.

DOI

[17]
Haase A, Bernt M, Großmann K et al., 2016. Varieties of shrinkage in European cities. European Urban and Regional Studies, 23(1): 86-102.

DOI

[18]
Han H, 2013. The impact of abandoned properties on nearby property values. Housing Policy Debate, 24(2): 311-334.

DOI

[19]
Hartt M, Hackworth J, 2018. Shrinking cities, shrinking households, or both? International Journal of Urban and Regional Research, 44(6): 1083-1095.

DOI

[20]
Häußermann H, Siebel W, 1988. Die schrumpfende stadt und die stadtsoziologie. Wiesbaden: VS Verlag für Sozialwissenschaften.

[21]
He L, Pan J, Dong L, 2020. Study on the spatial identification of housing vacancy. Remote Sensing Technology and Application, 35(4): 820-831. (in Chinese)

[22]
Hollander J B, Pallagst K, Schwarz T et al., 2009. Planning shrinking cities. Progress in Planning, 72(4): 223-232.

[23]
Hu Y, 2016. Power big data analysis of residential vacancy. China High-Tech Enterprises, (33): 191-192. (in Chinese)

[24]
Immergluck D, Smith G, 2006. The impact of single-family mortgage foreclosures on neighborhood crime. Housing Studies, 21(6): 851-866.

DOI

[25]
Jin X, Long Y, Sun W et al., 2017. Evaluating cities’ vitality and identifying ghost cities in China with emerging geographical data. Cities, 63: 98-109.

DOI

[26]
Kim J, Nam J, 2016. A study on vacant house distribution and management of urban declining area. Journal of the Korean Regional Science Association, 32(1): 105-122. (in Korean)

[27]
Kim J, Newman G, Jiang B, 2020. Urban regeneration: Community engagement process for vacant land in declining cities. Cities, 102(3): 102730.

DOI

[28]
Kim S, 2019. Design strategies to respond to the challenges of shrinking city. Journal of Urban Design, 24(1): 49-64.

DOI

[29]
Lee J, Newman G, Park Y, 2018. A comparison of vacancy dynamics between growing and shrinking cities using the land transformation model. Sustainability, 10 (5): 1513.

DOI

[30]
Lee J, Newman J, 2017. Forecasting urban vacancy dynamics in a shrinking city: A land transformation model. ISPRS International Journal of Geo-Information, 6(4): 124.

DOI

[31]
Liu Y, Hu Y, Sun H et al., 2020. Study on residents’ quality of life in the context of urban shrinkage: Analysis based on subjective and objective data. Journal of Urban Planning and Development, 146(3): 5020015.

DOI

[32]
Liu W, Liu L, 2023. Housing tenure and type choices of urban migrants in China. Journal of Geographical Sciences, 33(9): 1832-1850.

DOI

[33]
Liu Y, Zhang X, 2017. A study on the shrinkage of Wuhan metropolitan area. Planners, 33(1): 18-25. (in Chinese)

[34]
Ma T, Zhou Y, Wang Y et al., 2014. Diverse relationships between Suomi-NPP VIIRS night-time light and multi-scale socioeconomic activity. Remote Sensing Letters, 5(7): 652-661.

DOI

[35]
Martinez-Fernandez C, Audirac I, Fol S et al., 2012. Shrinking cities: Urban challenges of globalization. International Journal of Urban and Regional Research, 36(2): 213-225.

PMID

[36]
Martinez-Fernandez C, Weyman T, Fol S et al., 2016. Shrinking cities in Australia, Japan, Europe and the USA: From a global process to local policy responses. Progress in Planning, 105: 1-48.

DOI

[37]
Meng B, Zhang J, Qi Z, 2009. On the vacancy of Beijing ordinary residence houses. Urban Problems, (4): 6-11. (in Chinese)

[38]
Molotch H, 1976. The city as a growth machine: Toward a political economy of place. American Journal of Sociology, 82(2): 309-332.

DOI

[39]
New York State Department of Taxation and Finance, 2014. Property type classification codes. Retrieved from: http://www.tax.ny.gov/research/property/assess/manuals/prclas.htm?ga=1.87627992.1553951013.1420572943#vacant.

[40]
Newman G, Lee R J, Gu D et al., 2019. Evaluating drivers of housing vacancy: A longitudinal analysis of large U.S. cities from 1960 to 2010. Journal of Housing and the Built Environment, 34: 807-827.

DOI PMID

[41]
Oswalt P, 2006. Shrinking Cities. Berlin: Hatje Cantz Publishers.

[42]
Pagano M, Bowman A, 2004. Recycling the city: The use and reuse of urban land. Cambridge MA: Lincoln Institute of Land Policy.

[43]
Pallagst K, 2010. The planning research agenda: Shrinking cities: A challenge for planning cultures. Town Planning Review, 81(5): i-vi.

[44]
Pan J, Dong L, 2021. Spatial identification of housing vacancy in China. Chinese Geographical Science, 31(2): 359-375.

DOI

[45]
Park J, 2019. A multilevel model approach for assessing the effects of house and neighborhood characteristics on housing vacancy: A case of Daegu, South Korea. Sustainability, 11(9): 2515.

DOI

[46]
Quigley J M, 1999. Real estate prices and economic cycles. International Real Estate Review, 2(1): 1-20.

DOI

[47]
Rhodes J, Russo J, 2013. Shrinking ‘smart’: Urban redevelopment and shrinkage in Youngstown, Ohio. Urban Geography, 34(3): 305-326.

DOI

[48]
Riley C, Parry K I, Ard K et al., 2018. Asset or liability? Ecological and sociological tradeoffs of urban spontaneous vegetation on vacant land in shrinking cities. Sustainability, 10(7): 2139.

DOI

[49]
Robert M S, Li Y, Kelly L P, 2013. Dawn of the dead city: An exploratory analysis of vacant addresses in Buffalo, Ny 2008-2010. Journal of Urban Affairs, 35(2): 131-152.

DOI

[50]
Schilling J, Logan J, 2008. Greening the rust belt: A green infrastructure model for right sizing America’s shrinking cities. Journal of the American Planning Association, 74(4): 451-466.

DOI

[51]
Son E, Maeng H, Lee H, 2015. The spatio-temporal patterns of the vacant homes clusters and their impact on the neighborhood land price: The case of Busan metropolitan city. Journal of Real Estate Analysis, 1(1e): 77-100.

DOI

[52]
Song X, Wen M, Shen Y et al., 2020. Urban vacant land in growing urbanization: An international review. Journal of Geographical Sciences, 30(4): 669-687.

DOI

[53]
Sousa S, Pinho P, 2015. Planning for shrinkage: Paradox or paradigm. European Planning Studies, 23(1): 12-32.

DOI

[54]
Survey and Research Center for China Household Finance, 2019. 2017 China urban housing vacancy analysis brief edition. Retrieved from: https://chfs.swufe.edu.cn/_local/D/65/2B/57D2F2A832F77C8F3C1DDC4926E_AD-F9EA0C_121D6C.pdf.

[55]
Wang K, Immergluck D, 2019. Housing vacancy and urban growth: Explaining changes in long-term vacancy after the US foreclosure crisis. Journal of Housing and the Built Environment, 34: 511-532.

[56]
Wang L, Fan H, Wang Y, 2019. An estimation of housing vacancy rate using NPP-VIIRS night-time light data and OpenStreetMap data. International Journal of Remote Sensing, 40(22): 8566-8588.

DOI

[57]
White M J, 1986. Property taxes and urban housing abandonment. Journal of Urban Economics, 20(3): 312-330.

DOI

[58]
Wiechmann T, 2008. Errors expected: Aligning urban strategy with demographic uncertainty in shrinking cities. International Planning Studies, 13(4): 431-446.

DOI

[59]
Williams S, Xu W, Tan S B et al., 2019. Ghost cities of China: Identifying urban vacancy through social media data. Cities, 94: 275-285.

DOI

[60]
Yamashita S, Morimoto A, 2015. Study on occurrence pattern of the vacant houses in the local hub city. Journal of the City Planning Institute of Japan, 50(3): 932-937.

DOI

[61]
Yang D, Long Y, Yang W et al., 2015. Losing population with expanding space: Paradox of urban shrinkage in China. Modern Urban Research, (9): 20-25. (in Chinese)

[62]
Yang W, 2022. Top-down spatial developments and bottom-up consumption of space: Merits at the micro-scale in China’s shrinking cities. Habitat International, 119: 102487.

DOI

[63]
Yoo H, Kwon Y, 2019. Different factors affecting vacant housing according to regional characteristics in South Korea. Sustainability, 11(24): 6913.

DOI

[64]
You J, Lee D, 2017. Classification of the vacant housing type based on the physical condition and hazard level of vacant houses. Journal of the Korean Urban Geographical Society, 20(2): 1-13.

[65]
Zou S, Wang L, 2020. Individual vacant house detection in very-high-resolution remote sensing images. Annals of the American Association of Geographers, 110(2): 449-461.

DOI

Outlines

/