
Journal of Geographical Sciences >
Evaluation of suitability, adaptability, and reserve potential of construction land on the Qinghai-Tibet Plateau
|
Yang Hua (1995-), specialized in mechanistic modeling of land use and human-land relationships, and territorial function zoning. E-mail: yanghua0678@igsnrr.ac.cn |
Received date: 2023-10-08
Accepted date: 2023-11-20
Online published: 2024-01-08
Supported by
The Second Tibetan Plateau Scientific Expedition and Research Program(2019QZKK0406)
Construction land is the leading carrier of human activities such as production and living. Evaluating the construction land suitability (CLS) on the Qinghai-Tibet Plateau (QTP) holds significant implications for harmonizing the relationship between ecological protection and human activity and promoting population and industry layout optimization. However, no relevant studies provide a complete CLS assessment of the QTP. In this study, we developed a model-based CLS evaluation framework coupling of pattern and process to calculate the global CLS on the QTP based on a previously developed CLS evaluation model. Then, using the land-use data of 1990, 2000, 2010, and 2020, we examined the adaptability of existing construction land (ECL) to the CLS assessment result through the adaptability index and vertical gradient index and further analyzed the limitations of maladaptive construction land. Finally, we calculated the potential area of reserve suitable construction land. This article includes four conclusions: (1) The highly suitable, suitable, moderately suitable, marginally suitable, and unsuitable CLS classes cover areas of 0.33×10⁴ km2, 10.42×10⁴ km2, 18.06× 10⁴ km2, 24.12×10⁴ km2, and 205.29×10⁴ km2, respectively. Only approximately 11% of the study area on the QTP is suitable for large-scale permanent construction land, and approximately 79.50% of the area is unsuitable under current economic and technological conditions. (2) The ECL adaptability index is 85.16%, 85.93%, 85.18%, and 78.01% during 1990-2020, respectively, with an average adaptability index exceeding 80% on the QTP. The ECL distribution generally conforms to construction land suitable space characteristics but with a significant spatial difference. (3) From 1990 to 2020, the maladaptive ECL was dominated by rural settlement land, transport land, and special land, with a rapidly increasing proportion of urban and other construction land. The maladaptive ECL is constrained by both elevation and slope in the southern Qinghai Plateau, the Hengduan Mountains, and the Qilian Mountains. In contrast, elevation is significantly more limiting than slope in the northern Tibet Plateau, the Gangdis Mountains, and the Himalayan Mountains. (4) The potential area of reserve suitable construction land is 12.41×10⁴ km2, accounting for 4.81% of the total land area of the QTP, and the per capita area is 9928 m2. Regions of Qaidam Basin, Gonghe Basin, and Lhasa-Shannan Valley have the richest and most concentrated land resource of reserve suitable construction land. The research results provide spatial decision support for urban and rural settlement planning and ecological migration on the QTP.
YANG Hua , XU Yong , ZHOU Kan , WANG Lijia , XU Lin . Evaluation of suitability, adaptability, and reserve potential of construction land on the Qinghai-Tibet Plateau[J]. Journal of Geographical Sciences, 2024 , 34(1) : 41 -61 . DOI: 10.1007/s11442-024-2194-2
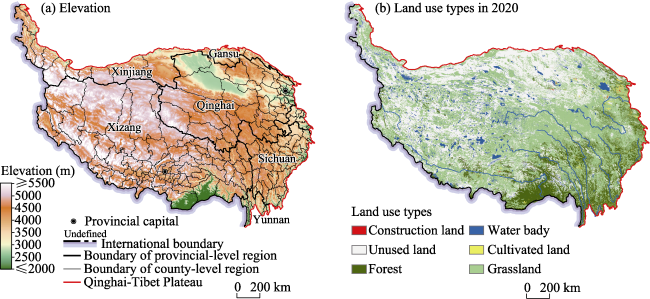
Figure 1 Topographic elevation (a) and spatial distribution of land use types (b) on the Qinghai-Tibet Plateau in 2020(Note: Produced based on the standard map GS (2022) 4312 of the Ministry of Natural Resources Standard Map Service website, with no modifications to the base map) |
Table 1 Topographic elevation and slope classification in the construction land suitability (CLS) evaluation |
| Types | Elevation classification thresholds (m) | Slope classification thresholds (°) |
|---|---|---|
| Resource environment carrying capacity of earthquake restoration and reconstruction | 800, 1200, 1600, 2000, 2500, 3000 | 3, 5, 8, 10, 15, 25, 30 |
| Major Function Zoning | 500, 1000, 2000, 3000 | 3, 8, 15, 25 |
| Territory Spatial Planning | 1000, 2000, 3000, 4000 | 3, 8, 15, 25 |
| Available construction land potential | 500, 1000, 2000, 3000 | 3, 8, 15, 25 |
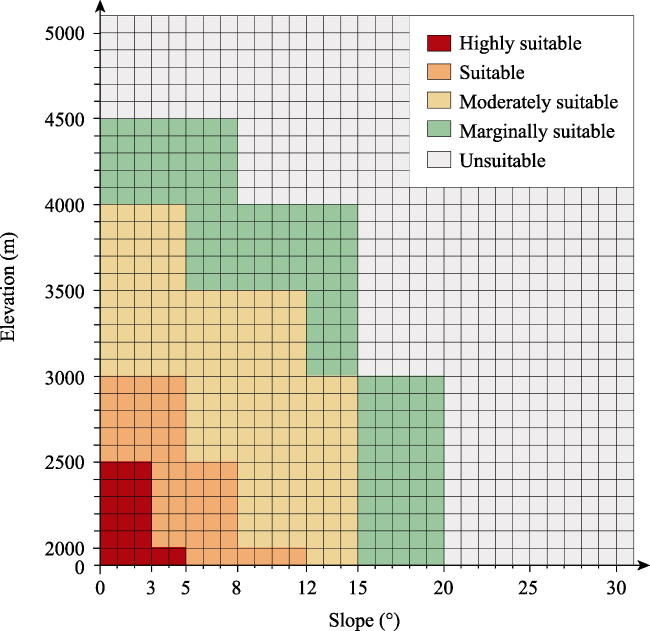
Figure 2 Corresponding relationships between construction land suitability (CLS) and elevation and slope |
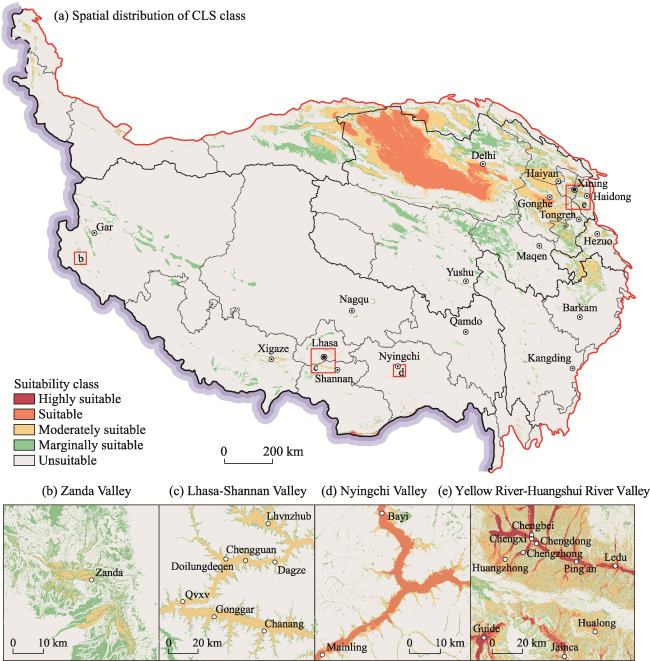
Figure 3 Spatial distribution of the construction land suitability (CLS) class on the Qinghai-Tibet Plateau |
Table 2 Area of each construction land suitability (CLS) class on the Qinghai-Tibet Plateau |
| Region | Highly suitable | Suitable | Moderately suitable | Marginally suitable | Unsuitable | |||||
|---|---|---|---|---|---|---|---|---|---|---|
| Area (104 km2) | Ratio (%) | Area (104 km2) | Ratio (%) | Area (104 km2) | Ratio (%) | Area (104 km2) | Ratio (%) | Area (104 km2) | Ratio (%) | |
| Xizang | 0.21 | 0.17 | 0.43 | 0.36 | .21 | 1.00 | 4.80 | 3.99 | 113.57 | 94.47 |
| Qinghai | 0.10 | 0.14 | 9.36 | 13.47 | 9.79 | 14.09 | 11.29 | 16.24 | 38.95 | 56.06 |
| Sichuan | 0.01 | 0.04 | 0.05 | 0.19 | 1.43 | 5.61 | 2.73 | 10.70 | 21.25 | 83.45 |
| Gansu | 0.00 | 0.04 | 0.36 | 3.81 | 2.71 | 28.99 | 1.68 | 17.95 | 4.60 | 49.20 |
| Yunnan | 0.01 | 0.17 | 0.03 | 0.75 | 0.19 | 5.75 | 0.30 | 8.85 | 2.86 | 84.48 |
| Xinjiang | 0.01 | 0.02 | 0.20 | 0.66 | 2.73 | 9.02 | 3.34 | 11.00 | 24.05 | 79.31 |
| QTP | 0.33 | 0.13 | 10.42 | 4.04 | 18.06 | 7.00 | 24.12 | 9.34 | 205.29 | 79.50 |
Table 3 Existing construction land (ECL) area in each construction land suitability (CLS) class on the Qinghai-Tibet Plateau, 1990-2020 |
| Year | Highly suitable | Suitable | Moderately suitable | Marginally suitable | Unsuitable | Construction land area (km2) | Total adaptability (%) | |||||
|---|---|---|---|---|---|---|---|---|---|---|---|---|
| Area (km2) | Ratio (%) | Area (km2) | Ratio (%) | Area (km2) | Ratio (%) | Area (m2) | Ratio (%) | Area (km2) | Ratio (%) | |||
| 1990 | 148.48 | 12.08 | 434.33 | 35.34 | 463.63 | 37.73 | 97.23 | 7.91 | 85.16 | 6.93 | 1228.84 | 85.16 |
| 2000 | 159.10 | 11.87 | 490.22 | 36.57 | 502.38 | 37.48 | 100.08 | 7.47 | 88.54 | 6.61 | 1340.32 | 85.93 |
| 2010 | 200.10 | 9.48 | 949.38 | 44.97 | 648.73 | 30.73 | 170.52 | 8.08 | 142.21 | 6.74 | 2110.94 | 85.18 |
| 2020 | 240.30 | 9.12 | 826.47 | 31.38 | 987.72 | 37.51 | 324.09 | 12.31 | 254.90 | 9.68 | 2633.48 | 78.01 |
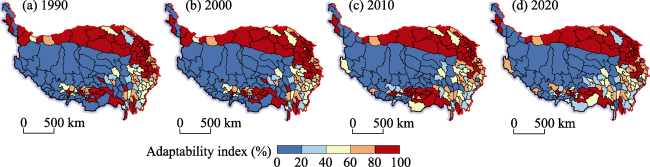
Figure 4 Spatial distribution of existing construction land (ECL) adaptability index on the Qinghai-Tibet Plateau, 1990-2020 |
Table 4 Existing construction land (ECL) area in construction land suitability (CLS) classes of marginally suitable and unsuitable on the Qinghai-Tibet Plateau, 1990-2020 |
| Year | Marginally suitable | Unsuitable | Construction land area (km2) | ||||||||||
|---|---|---|---|---|---|---|---|---|---|---|---|---|---|
| Urban construction land | Rural settlement land | Other construction land | Urban construction land | Rural settlement land | Other construction land | ||||||||
| Area (km2) | Ratio (%) | Area (km2) | Ratio (%) | Area (km2) | Ratio (%) | Area (m2) | Ratio (%) | Area (km2) | Ratio (%) | Area (km2) | Ratio (%) | ||
| 1990 | 8.16 | 4.48 | 76.58 | 41.99 | 12.48 | 6.84 | 6.99 | 3.83 | 66.64 | 36.54 | 11.54 | 6.32 | 182.39 |
| 2000 | 9.59 | 5.08 | 78.01 | 41.36 | 12.49 | 6.62 | 7.96 | 4.22 | 68.52 | 36.32 | 12.06 | 6.39 | 188.62 |
| 2010 | 42.51 | 13.59 | 97.05 | 31.03 | 30.96 | 9.90 | 23.00 | 7.35 | 96.06 | 30.72 | 23.15 | 7.40 | 312.74 |
| 2020 | 75.10 | 12.97 | 123.25 | 21.29 | 125.75 | 21.72 | 37.26 | 6.44 | 116.83 | 20.18 | 100.81 | 17.41 | 578.99 |
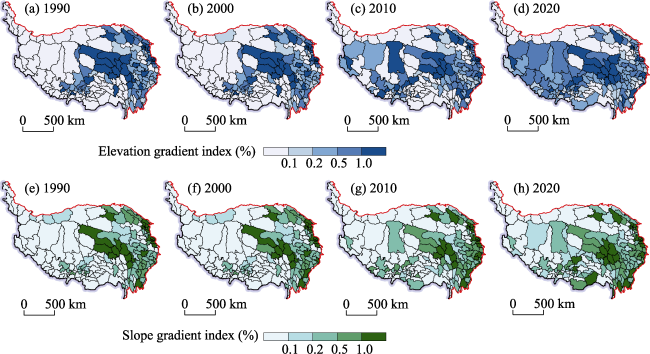
Figure 5 Spatial distribution of the elevation and slope gradient index of existing construction land (ECL) on the Qinghai-Tibet Plateau, 1990-2020 |
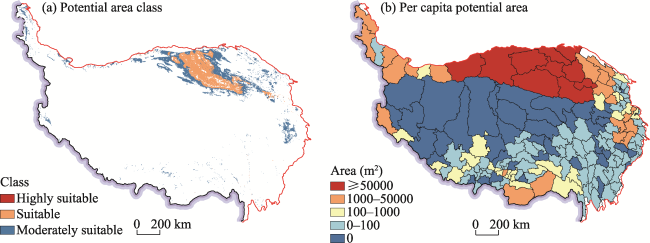
Figure 6 Spatial distribution of reserve suitable construction land and per capita area on the Qinghai-Tibet Plateau in 2020 |
Table 5 Class area of reserve suitable construction land and its per capita area on the Qinghai-Tibet Plateau in 2020 |
| Region | Highly suitable | Suitable | Moderately suitable | Potential area of reserve suitable construction land (km2) | Per capita potential area (m2) | |||
|---|---|---|---|---|---|---|---|---|
| Area (km2) | Ratio (%) | Area (km2) | Ratio (%) | Area (km2) | Ratio (%) | |||
| Xizang | 21.92 | 4.72 | 10.07 | 2.17 | 432.52 | 93.11 | 464.50 | 130 |
| Qinghai | 1.60 | 0.00 | 57430.37 | 59.86 | 38515.03 | 40.14 | 95947.00 | 17143 |
| Sichuan | 0.17 | 0.01 | 1.77 | 0.09 | 1863.58 | 99.90 | 1865.52 | 925 |
| Gansu | 2.25 | 0.02 | 2290.03 | 19.57 | 9412.40 | 80.42 | 11704.69 | 18593 |
| Yunnan | 0.15 | 0.79 | 0.61 | 3.25 | 17.94 | 95.96 | 18.69 | 39 |
| Xinjiang | 12.68 | 0.09 | 643.72 | 4.55 | 13487.06 | 95.36 | 14143.46 | 69146 |
| QTP | 38.77 | 0.03 | 60376.56 | 48.63 | 63728.53 | 51.33 | 124143.86 | 9928 |
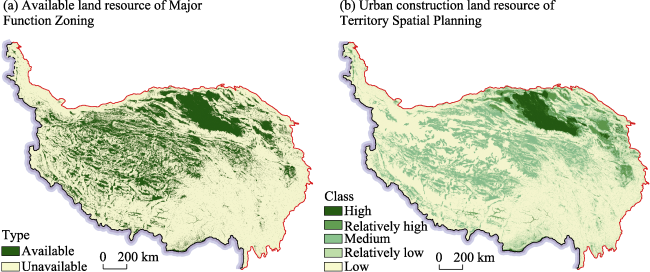
Figure 7 Assessment results of construction land suitability (CLS) of Major Function Zoning and Territory Spatial Planning on the Qinghai-Tibet Plateau |
| [1] |
|
| [2] |
|
| [3] |
|
| [4] |
|
| [5] |
|
| [6] |
|
| [7] |
|
| [8] |
|
| [9] |
|
| [10] |
|
| [11] |
|
| [12] |
|
| [13] |
|
| [14] |
|
| [15] |
|
| [16] |
|
| [17] |
Food and Agriculture Organization of the United Nations, 1976. A framework for land evaluation. Rome: FAO Soils Bulletin No.32.
|
| [18] |
|
| [19] |
General Office of the State Council of the People’s Republic of China, 2011. Major Function Oriented Zoning of China. Retrieved 2011-06-08/2023-03-23 from http://www.gov.cn/zwgk/2011-06/08/content_1879180.htm. (in Chinese)
|
| [20] |
|
| [21] |
|
| [22] |
|
| [23] |
|
| [24] |
|
| [25] |
|
| [26] |
|
| [27] |
|
| [28] |
|
| [29] |
|
| [30] |
|
| [31] |
|
| [32] |
|
| [33] |
|
| [34] |
|
| [35] |
Office of the Leading Group of the State Council for the Seventh National Population Census, 2022. Tabulation on 2020 China Population Census by County. Beijing: China Statistics Press. (in Chinese)
|
| [36] |
|
| [37] |
|
| [38] |
|
| [39] |
|
| [40] |
Technical Committee ISO/TC 20, 1975. Standard Atmosphere, ISO2533: 1975. Geneva: International Organization for Standardization.
|
| [41] |
|
| [42] |
|
| [43] |
|
| [44] |
|
| [45] |
|
| [46] |
Xinhua News Agency, 2020. The migration of life across half a century: Tibet’s ecological migration in extremely high-altitude to solve the problem of coexistence between human and nature. Retrieved 2020-03-17/2023-03-23 from http://www.xinhuanet.com/politics/2020-03/17/c_1125726595.htm. (in Chinese)
|
| [47] |
|
| [48] |
|
| [49] |
|
| [50] |
|
| [51] |
|
| [52] |
|
| [53] |
|
| [54] |
|
| [55] |
|
| [56] |
|
| [57] |
|
| [58] |
|
| [59] |
|
| [60] |
|
| [61] |
|
/
| 〈 |
|
〉 |