Research Articles

Elevation response of above-ground net primary productivity for Picea crassifolia to climate change in Qilian Mountains of Northwest China based on tree rings

  • WU Xuan , 1, 2 ,
  • JIAO Liang , 1, 2, * ,
  • DU Dashi 1, 2 ,
  • XUE Ruhong 1, 2 ,
  • WEI Mengyuan 1, 2 ,
  • ZHANG Peng 1, 2
Expand
  • 1. College of Geography and Environment Science, Northwest Normal University, Lanzhou 730070, China
  • 2. Key Laboratory of Resource Environment and Sustainable Development of Oasis, Northwest Normal University, Lanzhou 730070, China
*Jiao Liang (1981-), PhD and Professor, specialized in dendrochronology and plant geography. E-mail:

Wu Xuan (1996-), specialized in dendrochronology. E-mail: .

Received date: 2022-07-04

  Accepted date: 2023-07-19

  Online published: 2024-01-08

Supported by

The CAS “Light of West China” Program(2020XBZG-XBQNXZ-A)

Cultivation Program of 2022 Major Scientific Research Project of Northwest Normal University(WNU-LKZD2022-04)

National Natural Science Foundation of Gansu(20JR10RA093)

Abstract

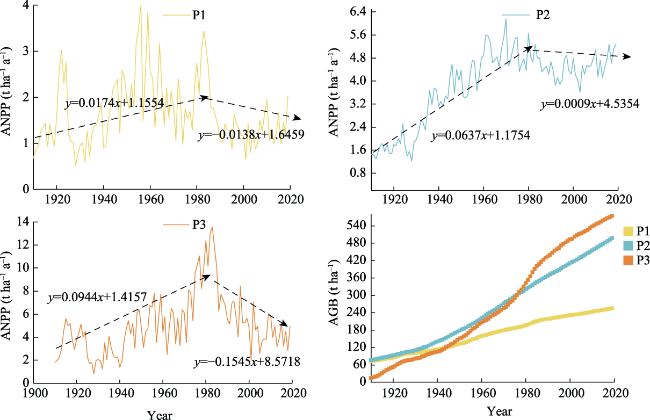
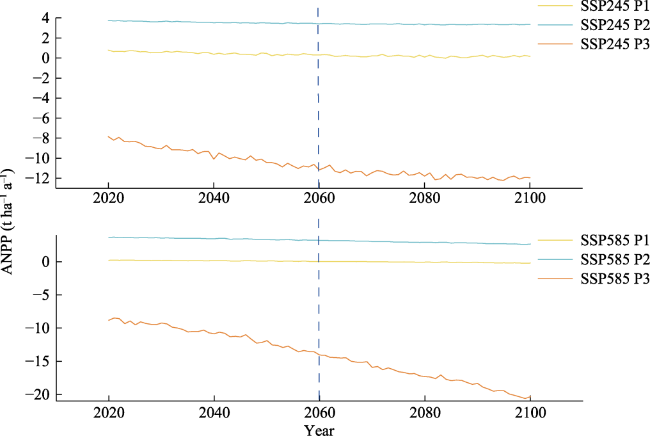
Current ecosystem models used to simulate global terrestrial carbon balance generally suggest that terrestrial landscapes are stable and mature, but terrestrial net primary productivity (NPP) data estimated without accounting for disturbances in species composition, environment, structure, and ecological characteristics will reduce the accuracy of the global carbon budget. Therefore, the steady-state assumption and neglect of elevation-related changes in forest NPP is a concern. The Qilian Mountains are located in continental climate zone, and vegetation is highly sensitive to climate change. We quantified aboveground biomass (AGB) and aboveground net primary productivity (ANPP) sequences at three elevations using field-collected tree rings of Picea crassifolia in Qilian Mountains of Northwest China. The results showed that (1) There were significant differences between AGB and ANPP at the three elevations, and the growth rate of AGB was the highest at the low elevation (55.99 t ha-1 10a-1). (2) There are differences in the response relationship between the ANPP and climate factors at the three elevations, and drought stress is the main climate signal affecting the change of ANPP. (3) Under the future climate scenario, drought stress intensifies, and the predicted decline trend of ANPP at the three elevations from mid-century to the end of this century is -0.025 t ha-1 10a-1, respectively; -0.022 t ha-1 10a-1; At -0.246 t ha-1 10a-1, the level of forest productivity was significantly degraded. The results reveal the elevation gradient differences in forest productivity levels and provide key information for studying the carbon sink potential of boreal forests.

Cite this article

WU Xuan , JIAO Liang , DU Dashi , XUE Ruhong , WEI Mengyuan , ZHANG Peng . Elevation response of above-ground net primary productivity for Picea crassifolia to climate change in Qilian Mountains of Northwest China based on tree rings[J]. Journal of Geographical Sciences, 2024 , 34(1) : 146 -164 . DOI: 10.1007/s11442-024-2199-x

1 Introduction

Under the new situation of global climate change, an increasing number of economies are turning carbon emission reduction actions into measures (Xu et al., 2021). Forestry development has ushered in new opportunities. Forest carbon sinks are important for the absorption and fixation of atmospheric carbon dioxide in processes, activities or mechanisms, and they play a significant role in the sustainable development of terrestrial ecosystems (Litton et al., 2007; Mao et al., 2015).
Forest ecosystems account for 52% of total terrestrial carbon sequestration and are an important part of the global terrestrial ecosystem. Current studies have reported trends and changes in national and regional terrestrial carbon stocks in cold, temperate and tropical forests by analyzing data from integrated forest sector carbon pools (Dixon et al., 1994). Net primary productivity (NPP), as an important component in global change, the carbon cycle, the water cycle, and land use and vegetation cover changes, not only reflects the productivity of vegetation communities under natural conditions, but also is a major determinant of carbon accumulation in ecosystems (Ewe et al., 2006; Xu et al., 2017; Ma et al., 2022). In recent years, the regional and global distribution patterns of NPP and its response to climate have long attracted the interest of ecologists. The need for research in this area has increased as projected global climate, nitrogen deposition and land use changes threaten carbon and energy flows in ecosystems (Wilcox et al., 2020).
Current global NPP research focuses on the quantification and analysis of carbon sinks/sources across forest ecosystems at large spatial scales on assessing the NPP trends in different forest systems and the responses to climate change based on the remote sensing measurements, flux data, and ecosystem modelling (Fang et al., 1996; Clark et al., 2001; Nemani et al., 2003; Running et al., 2004; Aragão et al., 2009; Zhang et al., 2009; Chen et al., 2022; Hu et al., 2022). Process-based models have rapidly improved, providing a powerful tool for predicting the relationship between forest ecosystem productivity and future climate change (Li et al., 2023). For example, measurements of CO2 exchange based on multiple terrestrial biosphere models and evaluations of remote sensing products from multiple forest study areas in North America showed significant deviations from model simulations (Keenan et al., 2012). Based on the Biome-BGC model, the net primary productivity (NPP) data of different forest types were studied (Ren et al., 2022). For a long time, due to the lack of measured data to verify the model, process-based modelling has been troubled, and there is uncertainty in the data derived as a result of ignoring disturbances in species composition, environment, structure, and function (Gower et al., 2001). Therefore, it is necessary to develop appropriate measurement methods to calibrate ecosystem models.
Tree rings provide a measure of trunk growth and represent the main above ground carbon accumulation pool (Yao et al., 2023). Due to the advantages of long tree-ring data sequences and their high precision, they can improve our understanding of the current terrestrial carbon cycle, and several scholars have found that tree rings can provide accurate and retrospective measurements of forest productivity and growth (Ivanova et al., 2020). For example, stand NPP in Northeast China was constructed along a latitude gradient using tree rings in the past 20 years. The biomass and NPP dynamics of northern subtropical Pinus massoniana forest in the past 30 years were estimated (Cheng et al., 2011). Tree-ring records can be used to discuss the growth phenology of trees, the trend of and variation in forest productivity, information on forest disturbance, and the observation and simulation comparison of forest productivity (Babst et al., 2014; Wang et al., 2023). Therefore, tree rings are an ideal proxy for indicating changes in ecosystem dynamics, testing and calibrating various ecosystem process models with the implicit assumption that tree rings are a good proxy for temporal changes in NPP (Muukkonen, 2007; Peng et al., 2013). However, it is easy to ignore factors such as the difference in the elevation environment in the process model, so whether the NPP reflected by tree rings at different elevations can be used as a new means to further calibrate the process model is still unknown.
Climate has a strong and direct influence on NPP, and many studies have established empirical equations between forest NPP and climate within ecosystems (Schuur, 2003; Gong et al., 2023). Long-term NPP sequences derived from tree-ring width enable a more accurate assessment of the response relationship between primary productivity and climate. For example, the relationship between NPP and climate over the past 50 years for Pinus koraiensis in the Changbai Mountains was evaluated using stepwise regression (Fang et al., 2016). The higher temperature was found to be the main limiting factor of NPP based on the NPP-climate relationship in northern Portugal (Zhang et al., 2014). Therefore, the productivity accuracy of predictive models linked to climate can be improved.
Boreal forests are prominently featured in the global carbon budget, and climate change models show that boreal forests will experience the strongest warming (Melillo et al., 1993). At present, the average forest storage capacity of China is approximately 90 cubic metres per hectare, and the maximum potential forest coverage may reach 28%-29%. The Qilian Mountains are in the arid and semiarid areas of Northwest China, which is an important ecological safety zone (Liang et al., 2010). At present, the stability responses of tree radial growth to climate have been used to reconstruct different meteorological indicators. For instance, the SPEI, precipitation, and temperature in the Qilian Mountains were reconstructed using tree rings (Chen et al., 2011; Wang et al., 2013; Zeng et al., 2022). Studies on the NPP of forest vegetation in this area have focused on the spatial and temporal patterns and their responses to climate change using MODIS datasets over a certain period (Liu et al., 2015; Lan and Li, 2022). However, there have been few studies on the reconstruction of the NPP of vegetation and the investigation of its response to climate according to an elevation gradient. Therefore, we investigated the changes in AGB, ANPP and their drivers at three different elevations in the central Qilian Mountains. Additionally, the future trend of ANPP under future climate scenarios was predicted. The newly published CMIP6 dataset and the raster data of CRU TS4.04 (LAND) from 1950 to 2018 were selected for the analysis in this paper (http://climexp.knmi.nl/). Compared with CMIP5, CMIP6 places more emphasis on future radiative forcing scenarios and shared socioeconomic scenario consistency, each including a set of chemically active gases, aerosols and greenhouse gas emissions and concentrations, and land use/cover time processes that influence the path choices of different development strategies for countries. Based on this, the ANPP time series of three different elevations in the region were reconstructed using the fitting models of the SSP245 and SSP585 climate scenarios in the dataset. The relevant questions are as follows: 1) Has there been an elevational gradient difference in AGB and ANPP in the past at the three elevations? Is the temporal variation in the radial width index and ANPP consistent? 2) What is the response relationship between ANPP and climate variables of Qinghai spruce at the three elevations? 3) Are the predicted trends of aboveground NPP at the three elevations the same under different future climate scenarios? The answers to these questions will provide a powerful tool for predicting the response of ecosystem productivity to future climate change, exploring the mechanisms of the carbon cycle of terrestrial ecosystems, and predicting and modelling the growth potential of forest carbon sinks; all of this information is conducive to further strengthening the scientific management of forests to achieve the “double carbon” goals.

2 Materials and methods

2.1 Study area

The study area is in the Qilian Mountains in Northwest China, which is the junction of the Qinghai-Tibet Plateau, the Loess Plateau and the Inner Mongolia Plateau. Its geological structure is the typical Caledonian geosyncline of the Kunlun Qinling geosyncline. The fold belt is mainly composed of metamorphic rock series and volcanic rock series and then forms a series of mountains, gullies and intermountain basins. The characteristics of the continental climate and plateau climate are obvious, including the annual temperature difference and large daily range, long and cold winters, short and cool summers, and lower annual precipitation, with an average annual precipitation concentrated below 400 mm. Moreover, the geographical environment and natural conditions affect the soil types and properties in the Qilian Mountains. The soil types in the Qilian Mountains are mainly divided into six types: frozen soil, sierozem soil, aeolian sandy soil, lake swamp soil, mountain yellow soil and mountain brown soil. In addition, according to the landscape level zonality, the vegetation types can be successively developed into warm steppe, temperate coniferous broad-leaved forest, cold warm coniferous forest, alpine shrub, alpine meadow, alpine steppe and alpine desert. The vertical zonal distribution of the landscape changes successively as follows: desert steppe, forest steppe, subalpine shrub meadow, alpine desert and ice and snow zone.
The sampling sites (100°03′-100°23′E, 38°32′-38°48′N) were located in the central Xishui Nature Conservation Station (Figure 1), located at the northern foot of the Qilian Mountains. Qinghai spruce is the main forest group species in the Qilian Mountains, and it is distributed mainly on the shady slopes of 2400-3300 m above sea level with a growing season from May to September.
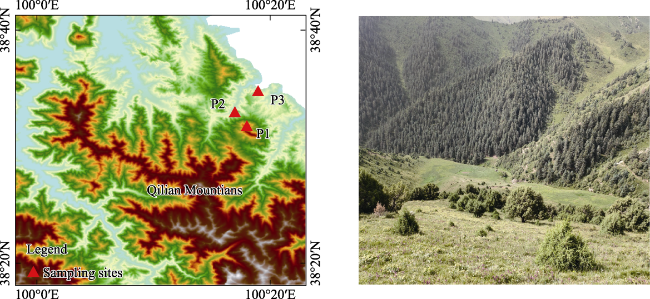
Figure 1 Distribution of the sampling sites

2.2 Meteorological data

According to meteorological data, the annual mean maximum temperature and minimum temperature in the central section of the Qilian Mountains from 1950 to 2018 were 6.8℃ and -6.7℃, respectively, with a mean temperature of 0.1℃ (Figure 2). The increases were 0.06℃/10a, 0.17℃/10a, and 0.11℃/10a, respectively. The annual precipitation was 157.5 mm. Figure 3 shows the minimum and maximum mean temperatures and precipitation at different stages of the multiyear growing season.
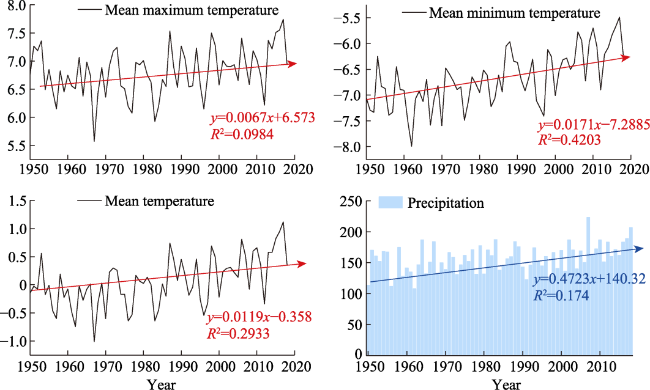
Figure 2 Interannual variation of meteorological factors (mean maximum temperature, mean temperature, mean minimum temperature and total precipitation)
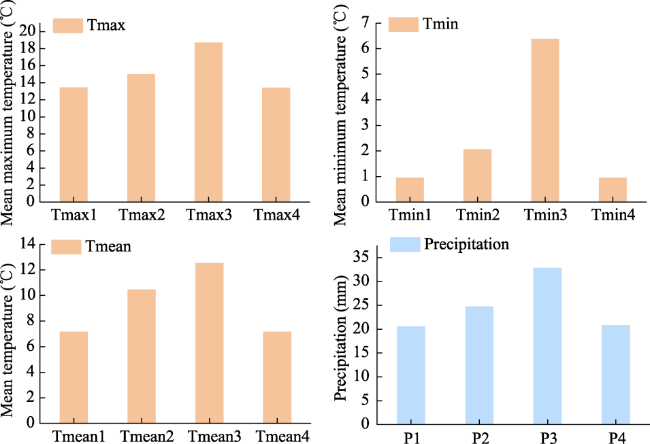
Figure 3 Tmax, Tmin, Tmean and precipitation at different stages of the growing season in the Qilian Mountains of Northwest China. 1, 2, 3 and 4 represent the end of the previous growing season, the beginning of the current growing season, the middle of the current growing season, and the end of the current growing season.

2.3 Sample collection

The sampling sites were located at high (P1), middle (P2) and low (P3) elevations in the study area with slopes ranging from 17° to 30° (Table 1). Meanwhile, at the sampling sites at the three elevations, the canopy coverage was 40.4%, 50.2%, and 45.3%, the tree distance was 6.0 m, 5.2 m, and 7.2 m, the average tree height was 20.3 m, 14.5 m, and 16.3 m, and the crown width was 4.1 m, 4.0 m, and 4.2 m, respectively. In field sampling, each tree was carefully selected to avoid interference; trees with special habitats, diseases and insect pests were excluded; and relatively sparse or isolated healthy trees were selected for sample core collection. A total of 73 trees or 145 tree cores were sampled at the site in July 2019.
Table 1 Information about sampling sites of the Qinghai spruce at the three elevations
Site Elevation (m) Latitude (°N) Longitude (°E) Slope (°) CC (%) TD (m) DBH (cm) TH (m) CW (m)
P1 3300 38.32 100.18 30 40.4 6.0 40.0 20.3 4.1
P2 2850 38.33 100.17 17 50.2 5.2 30.8 14.5 4.0
P3 2585 38.35 100.19 19 45.3 7.2 31.1 16.3 4.2

P is the sampling site, P1: High elevation, P2: Middle elevation, P3: Low elevation. CC (%): canopy coverage, TD: tree distance, DBH: diameter at breast height, TH: tree height, CW: crown width.

2.4 Tree-ring chronology development and statistical parameter calculation

The tree cores collected in the field were brought back to the laboratory and processed according to the standard procedures of dendrochronology. First, the tree cores were dried, fixed and polished to make them sufficiently smooth and clear. Then, cross-dating was carried out to determine the exact age of each tree ring. The LINTAB Measurement System with an accuracy of 0.001 mm tree-ring width gauge was used to measure the tree width values for each year. Finally, all tree-ring width sequences were dated, and quality control of the measurement results was carried out using the COFFCHA program (Holmes, 1983). Then, the ARSTAN program was used to remove the growth trend of the tree-ring width sequence and establish the tree-ring width chronology. To remove the influence of biological trends related to tree age and other non-climatic factors in the tree-ring width sequences while also preserving as much climate information as possible, most tree-ring width sequences adopted a traditional negative exponential function or linear function with a negative slope (or horizontal slope) for growth trend fitting. For individual core sequences whose growth trend does not conform to the above two methods, the spline function whose step length was 1/2 to 2/3 of the sequence length was used to fit the growth trend. The detrended sequence was calculated by the ratio of the original wheel width sequence to the fitted curve, and then the detrended sequence was synthesized by the double weight average method. Finally, the tree-ring width normalized chronology (STD), difference chronology (RES) and autoregressive chronology (ARS) of all sampling points were obtained (Table 2).
Table 2 Dendrochronological characteristics of chronologies for the Qinghai spruce at the three elevations
Sites P1 P2 P3
Core/tree 49/25 48/24 48/24
Time periods 1837-2019 1819-2019 1902-2019
MS 0.224 0.280 0.307
SD 0.220 0.338 0.326
ACI 0.637 0.542 0.479
R 0.258 0.532 0.671
R1 0.475 0.734 0.843
R2 0.253 0.528 0.660
PC1 0.303 0.563 0.703
SNR 23.259 86.353 63.084
EPS 0.959 0.989 0.984

P is the sampling site, P1: High elevation, P2: Middle elevation, P3: Low elevation.

The statistical characteristic parameters were calculated, including the mean sensitivity (MS), standard deviation (SD), first-order autocorrelation (ACI), average correlation coefficient between sequences (R1, R2 and R3), amount of variance explained by the first principal component, signal-to-noise ratio (SNR), and expressed population signal (EPS). MS represents the change in the tree-ring width index between successive years. SD reflects the interannual variation in each chronology. AC1 represents the effect of the previous year’s climate on tree growth in that year. PC1 represents the percentage variance of the first component interpretation in the principal component analysis. R reflects the correlation between time series. SNR and EPS represent the strength of shared climate information over several decades.

2.5 Data analysis and methods

2.5.1 Calculation of aboveground biomass

The annual diameter at breast height (DBH) was estimated using the following formula.
D B H a = D B H 2 × T R W a
where a is the current year, TRWa is the mean ring width in the year a, and DBHa is the diameter at breast height in the year a.
We collected DBH data at three different elevations in the current year, and we calculated the tree height and DBH data of the previous year according to the relationship between the height and DBH of Qinghai spruce in the Qilian Mountains (Liu, 2019).
H = 5.2746 ln ( D B H ) 4.32
The biomass of each organ was calculated from the H and DBH of each tree, and the total biomass of the sample site (W, t/ha) was the summed biomass of the whole tree (WT, kg) based on the biomass estimation equations of Qinghai spruce (Wang et al., 2000).
W S = 0.0478 ( D B H 2 × H ) 0.8665
W B = 0.0122 ( D B H 2 × H ) 0.8905
W I = 0.265 ( D B H 2 × H ) 0.4701
W R = 3.3756 ( D B H 2 × H ) 0.2725
A G B = W S + W B + W I + W R
where WS, WB, WL and WR are the stem, branch, leaf and root biomass of a single tree, respectively, and the sum of the four components is the whole plant biomass.

2.5.2 Calculation of aboveground net primary productivity

We define the calculation of ANPP using Graumlich’s method (Graumlich et al., 1989).
The formula is as follows:
A N P P = Δ A G B + C + D
where ∆AGB is annual biomass increment, C is annual detritus production (litterfall and tree mortality), and D is annual herbivore foraging.
In Eq.8, the loss of production and annual fluctuations of litterfall are negligible for (Grier and Logan, 1977). Therefore, the estimated annual ANPP series as:
A N P P i = A G B i A G B i 1
where ANPPi represents the net above-ground primary productivity in the year i.

2.5.3 ANPP-climate correlation analysis and ANNP prediction in the future

The relationships between ANPP and climate factors were analyzed by Pearson correlation at different periods of the growing season, and this method could determine the main controlling factors of ANPP. On this basis, the main climatic factor was defined as the original factor by the method of multiple stepwise linear regression, and three regression equation models with different elevations were fitted and used for future predictions of the ANNP.

3 Results

3.1 Interannual variations in tree-ring chronologies, ANPP and AGB at different elevations

The sequences of ANPP and tree-ring width at the three elevations were consistent (Figure 4). The correlations between tree-ring data and ANPP at the three elevations were 0.40 (p<0.01), 0.21 (p<0.05) and 0.81 (p<0.01) respectively.
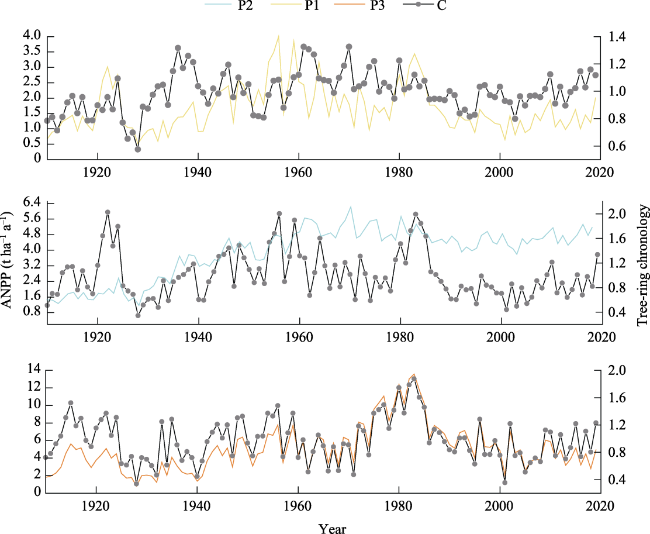
Figure 4 Interannual variations of ANPP and tree-ring chronologies at the three elevations
The interannual variations in ANPP and AGB were different among the three elevations, and the growth rate varied greatly with the cumulative increase in AGB. The annual average biomass at high elevation was 164.77 t/ha, with a growth rate of 18.134 t ha-1 10a-1, and the ANPP showed a general trend of increasing and then decreasing with a rate of increase of 0.174 t ha-1 10a-1 from 1910 to 1984 and a rate of decrease of -0.138 t ha-1 10a-1 after 1984. The annual average biomass at the middle elevation was 257.14 t ha-1, with a growth rate of 41.259 t ha-1 10a-1, and ANPP maintained a steady upwards trend with a rate of increase of 0.306 t ha-1 10a-1. Meanwhile, the rate of increase of ANPP after 1980 was significantly slower at 0.009 t ha-1 10a-1 than that of 0.637 t ha-1 10a-1 before 1980. The average annual biomass at the low elevation was 265.89 ha/10a, with a rate of increase of 55.99 t ha-1 10a-1, and the ANPP also showed an upwards and then downwards trend at high elevations. The rate of increase in ANPP was 0.944 t ha-1 10a-1 from 1910 to 1983, and the rate of decrease was -1.545 t ha-1 10a-1 after 1983 (Figure 5).
Figure 5 Interannual variation of ANPP and AGB at the three elevations

3.2 Correlation between ANPP and climatic factors at different elevations

Figure 6 shows the relationships between the ANPP at different elevations and climate factors during different stages of the growing season during 1950-2018.
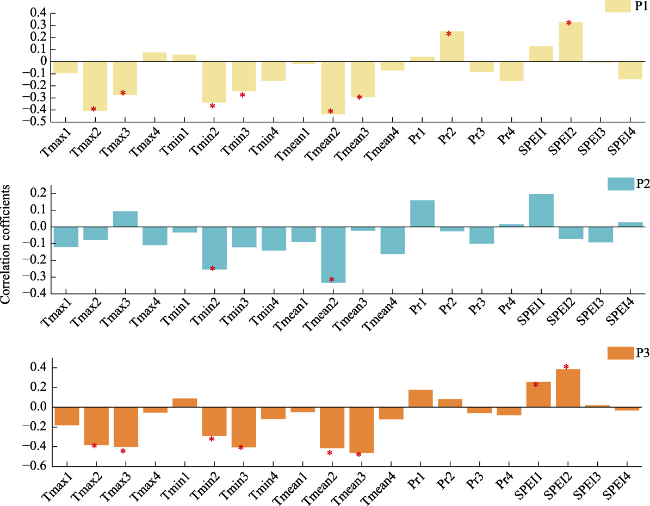
Figure 6 Correlation between climate factors and ANPP from 1950 to 2018 (max: mean maximum temperature, min: mean minimum temperature, mean: mean temperature, Pr: precipitation and SPEI) at the three elevations. 1, 2, 3 and 4 represent the end of the previous growing season, the beginning of the current growing season, the middle of the current growing season, and the end of the current growing season.
These results indicated that the ANPP-climate correlations differed at the different elevations. The ANPP at high elevations was significantly negatively correlated with the mean maximum temperature at the beginning of the growing season (r=-0.405, p<0.01), the mean minimum temperature (r=-0.337, p<0.01), and the mean temperature (r=-0.421, p<0.01) and negatively correlated with the mean maximum temperature in the middle growing season (r=-0.274, p<0.01), the mean minimum temperature (r=-0.245, p<0.01), and the mean temperature (r=-0.294, p<0.01). It was positively correlated with precipitation at the beginning of the current growing season (r=0.251, p<0.01) and the SPEI2 (r=0.326, p<0.01). Therefore, ANPP was mainly restricted by drought. The ANPP at middle elevations was significantly negatively correlated with the mean minimum temperature at the beginning of the growing season (r=-0.242, p<0.01). The ANPP at low elevations was significantly negatively correlated with the mean maximum temperature at the beginning of the growing season (r=-0.379, p<0.01), the mean minimum temperature (r=-0.281, p<0.01), and the mean temperature (r=-0.375, p<0.01) and negatively correlated with the mean maximum temperature in the middle of the growing season (r=-0.400, p<0.01), the mean minimum temperature (r=-0.401, p<0.01), and the mean temperature (r=-0.457, p<0.01). The ANPP was significantly negatively correlated with the SPEI1 (r=0.253, p<0.01), and the SPEI2 (r=0.382, p<0.01), which was similar to the response pattern at high elevations, and drought restriction existed.

3.3 Construction of the fitting equations of ANPP at different elevations

Equations of the ANPP at the three elevations were prepared using the linear regression function relationship according to the Pearson correlation results of ANPP-climate. These equations could be used for further analysis and prediction of ANPP trends at the three elevations under future climate scenarios.
The above results of multiple stepwise regression analysis showed that the variable combination of mean temperature and precipitation at the beginning of the growing season contributed 24.4% to the change in ANPP at high elevations (Table 3). The mean temperature at the beginning of the growing season contributed 11% to the change in ANPP at middle elevations. The variation combinations of mean temperature in the middle of the current growing season, the maximum temperature at the beginning of the growing season and the SPEI at the end of the previous growing season contributed 42.8% to the change in ANPP at low elevations.
Table 3 Integrated characteristic values of regression models at the three elevations
Independent variable R² Adjusted R² Std. error of the estimate F P
P1 Tmean2 0.190 0.178 0.691 15.712 0.000
Tmean2
Pr2
0.244 0.221 0.673 10.670 0.000
P2 Tmean2 0.110 0.097 0.521 8.314 0.005
P3 Tmean3 0.209 0.197 2.355 17.724 0.000
Tmean3
SPEI2
0.310 0.289 2.216 14.819 0.000
Tmean3
SPEI2
SPEI1
0.374 0.345 2.127 12.956 0.000
Tmean3
SPEI2
SPEI1
Tmin2
0.428 0.392 2.050 11.953 0.000
Based on the regression scheme shown in Table 4, the ANPP multiple regression equations of high, middle and low elevations were determined as follows:
P 1 A N P P = 5.967 0.443 T m e a n 2 + 0.018 Pr 2
P 2 A N P P = 7.150 0.243 T m e a n 2
P 3 A N P P = 24.347 1.306 T m e a n 3 + 1.154 S P E I 2 + 0.628 S P E I 1 0.924 T m i n 2
Table 4 Regression schemes and eigenvalues of ANPP at the three elevations
Number Model B Std. error Standardized coefficients t Sig.

P1
1 Constant 6.413 1.170 5.48 0.000
Tmean2 -0.443 0.112 -0.436 -3.964 0.000
2 Constant 5.967 1.157 5.156 0.000
Tmean2 -0.433 0.109 -0.426 -3.980 0.000
Pr2 0.018 0.008 0.233 2.179 0.033
P2 1 Constant 7.150 0.883 8.079 0.000
Tmean2 -0.243 0.084 -0.332 -2.883 0.005
P3 1 Constant 29.801 5.628 5.295 0.000
Tmean3 -1.893 0.450 -0.457 -4.210 0.000
2 Constant 27.326 5.357 5.101 0.000
Tmean3 -1.695 0.428 -0.410 -3.962 0.000
SPEI2 1.004 0.323 0.321 3.103 0.003
3 Constant 26.847 5.144 5.219 0.000
Tmean3 -1.658 0.411 -0.401 -4.035 0.000
SPEI2 1.039 0.311 0.332 3.345 0.001
SPEI1 0.561 0.217 0.254 2.584 0.012
4 Constant 24.347 5.062 4.809 0.000
Tmean3 -1.306 0.421 -0.316 -3.101 0.003
SPEI2 1.154 0.303 0.369 3.807 0.000
SPEI1 0.628 0.211 0.284 2.973 0.004
Tmin2 -0.924 0.378 -0.248 -2.443 0.017

P is the sampling site, P1: High elevation, P2: Middle elevation, P3: Low elevation.

Tmax: mean maximum temperature, Tmin: mean minimum temperature, Tmean: mean temperature, Pr: precipitation at the three elevations. 1, 2, 3 and 4 represent the end of the previous growing season, the beginning of the current growing season, the middle of the current growing season, and the end of the current growing season.

According to the regression scheme obtained from multiple stepwise regression analysis, ANPP reconstruction sequence curves at the three elevations were determined. Figure 7 shows the comparison between the reconstructed values and the actual values of ANPP. The reconstructed curves were in good synchronization with the actual curves by the high- and low-frequency variation characteristics. The eigenvalues supported the reliability of the reconstruction equation (Table 4), showing that the coefficients of determination (R²) at the three elevations were 0.35, 0.28 and 0.43, respectively. The Pearson correlation results were 0.53 (p<0.01), 0.42 (p<0.01), and 0.61 (p<0.01), respectively.
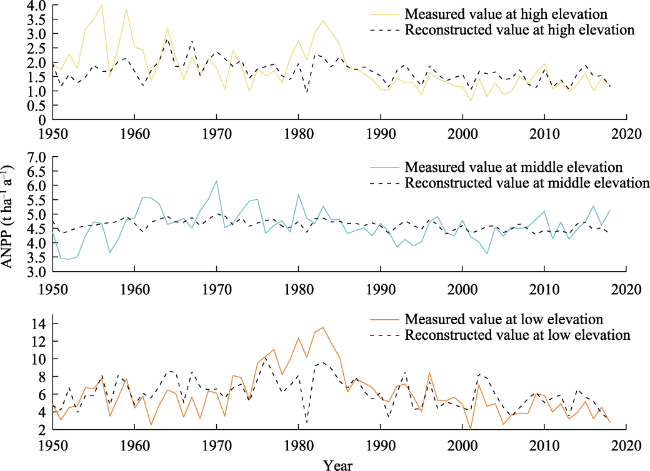
Figure 7 Reconstructed value of ANPP fitted by regression scheme was compared with the actual value ANPP

3.4 Prediction of ANPP trends at the three elevations under future climate scenarios

Figure 8 shows the different ANPP trends at the three elevations under the two different climate scenarios of CMIP6 SSP245 and SSP585. The rates of decline of ANPP at high elevations were -0.075 /ha/10a and -0.056 ha/10a under the SSP245 and SSP585 scenarios, respectively. The rates of decline of ANPP at middle elevations were -0.048 t ha-1 10a-1 under SSP245 and -0.135 t ha-1 10a-1 under SSP585. The rates of decline of the ANPP sequences at low elevations were -0.509 t ha-1 10a-1 under SSP245 and -1.53 t ha-1 10a-1 SSP585. In addition, the rates of decline in ANPP at SSP585 were higher than those at SSP245, with overall rates of -0.494 t ha-1 10a-1 for SSP585 and -0.2 t ha-1 10a-1 for SSP245. Among the ANPP trends at the three elevations, the decreasing trend of ANPP at low elevation was the fastest, while that at the middle elevation had the slowest decreasing trend among the three elevations.
Figure 8 Interannual variation of ANPP at the three elevations under two future climate scenarios
The decreasing trends of ANPP at the three elevations in the SSP245 scenario were -0.108 t ha-1 10a-1, -0.074 t ha-1 10a-1 and -0.754 t ha-1 10a-1 from the present to mid-century (Figure 8), respectively. The decreasing trends of ANPP at the three elevations were -0.025 t ha-1 10a-1, -0.022 t ha-1 10a-1 and -0.246 t ha-1 10a-1 from the mid-century to the end of the century, respectively. The decreasing trends from the middle to the end of the century showed a general slowdown compared to the trend in the earlier period. Similarly, the decreasing trends of ANPP at the three elevations in the SSP585 scenario were -0.048 t ha-1 10a-1, -0.115 t ha-1 10a-1, and -0.131 t ha-1 10a-1 from the present to mid-century, respectively. The decreasing trends were -0.065 t ha-1 10a-1, -0.149 t ha-1 10a-1 and -1.609 t ha-1 10a-1 from the middle to the end of the century, respectively. The degree of decrease from the middle to the end of the century increased compared to the trend in the earlier period. Meanwhile, the decreasing trends of ANPP at the three elevations in both scenarios implied that the vegetation NPP declined and forest degradation occurred at the different elevations under the future warming climate scenarios.

4 Discussion

4.1 Tree-ring width of different elevation gradients provides key information for determining net primary productivity

The regulation of atmospheric CO2 concentrations is an important function of terrestrial ecosystems (Zaehle et al., 2006). NPP is a fundamental and highly relevant component of the carbon cycle, and the increase in NPP determines the carbon uptake and increase in ecosystems (Luo et al., 2003; Qi et al., 2023). Therefore, it is necessary to determine the NPP variability to quantify the net carbon uptake from the atmosphere by ecosystems.
Assessing forest carbon fluxes and global carbon balances and predicting how global ecosystems will be affected by climate change requires data collection of NPP and biomass of forests and the introduction of prescribed data into terrestrial biosphere models (Prentice et al., 2000). These results can extend the processes and results of field and laboratory experiments to larger spatial areas to further assess the impact of climate change on terrestrial carbon cycling (Dufresne et al., 2002; Crimmins et al., 2011). However, there are many problems with the accuracy of the model due to the inherent complexity of forest ecosystems and their large spatial heterogeneity (Haynes and Gower, 1995). For example, belowground carbon allocation is influenced by many biotic and abiotic factors, such as stand or tree age, tree species, soil temperature, elevation and nutrient effectiveness, and the influence of insects and fungi (Nadelhoffer et al., 1985; Gill and Jackson, 2000). Therefore, our study considered elevation as a key element affecting the accuracy of quantifying AGB, and ANPP facilitated our understanding and mastering of the dynamic characterization of forest growth and carbon cycling at different elevation gradients. Our study conclusions could also lay the foundation for incorporating model operations and improve data credibility.
We calculated the AGB and ANPP by collecting tree-ring width data at the three elevations in the study area according to prescribed equations to verify our first hypothesis that there were elevation differences in NPP. The results also confirmed that the variation in tree-ring width was in good agreement with ANPP (Figures 2 and 3). The interannual variations in ANPP at the three elevations were determined based on the advantages of the long time series and high precision of tree rings. We found that the ANPP at different elevations had different patterns, showing that the increasing trends were followed by decreasing trends of ANPP at high and low elevations, while there was a stable increasing trend at the middle elevation (Figures 4 and 5). The ANPP at all three elevations changed significantly before and after the 1980s, which might be related to the increase in temperature around the 1980s. Therefore, trees are vulnerable to climate change, especially drought caused by warming, which has a clear negative impact on forest growth (Sun et al., 2005; Stegen et al., 2011; Slik et al., 2013). Our results suggest that further research on the relationships between ANPP and climate factors is needed to understand forest growth dynamics.

4.2 Climatic driving factors of ANPP at different elevations

The correlations between ANPP and climate factors (temperature, precipitation, SPEI) in the growing season at different elevations are shown in Figure 4. The main controlling climate factors of ANPP at all three elevations differed. Among them, the ANPP at high elevations was significantly negatively correlated with the temperature at the beginning of the growing season and significantly positively correlated with the precipitation and SPEI at the beginning of the growing season. Therefore, high-temperature-induced drought is a primary factor affecting the growth and productivity of trees at high elevations. In high-elevation areas, the temperature is lower, and the precipitation is relatively higher. On the one hand, the increase in precipitation is conducive to supplementing the water in the soil and providing good water conditions for the growth of trees (Jiao et al., 2016). In addition, the increase in temperature in cold areas is beneficial to improve photosynthesis, increase the accumulation of carbohydrates in trees, break dormancy, prolong the growing season, and foster the growth and productivity of trees (Dusenge et al., 2019). However, as the temperature increases gradually over the threshold that trees can withstand, this will lead to soil water deficits, tree stomatal closure, reduced CO2 uptake, slowed photosynthesis, inhibited growth of tree cambium cells, and restrictions on tree growth and productivity levels (Wehr et al., 2016; Darenova et al., 2018; Nagavciuc et al., 2018). This is consistent with the initial increasing and then decreasing ANPP trend sequence at high elevation (Figure 3), which indicates that tree growth and ANPP at high elevations do not fully benefit from the gradually increasing temperature during the growing season but are limited by warming at a later stage. Many studies are consistent with our results, showing that the increasing drought stress induced by high temperatures has led to a gradual decreasing trend in the productivity level of trees (Lucht et al., 2002; Lawrence et al., 2005; Mao et al., 2022).
Compared with the high elevation region, the ANPP in the middle elevation maintained an upwards trend overall and was less restricted by climatic factors. The ANPP was significantly negatively correlated only with Tmin and Tmean at the beginning of the growing season and was not correlated with the SPEI in the growing season, which was not subject to drought stress. However, the biomass and productivity in this area were more related to the complex stand conditions and competition. Competition significantly hinders the growth of tree diameter and tree height and especially affects the NPP of forests to a greater extent. The higher the stand density is, the stronger the competition among trees. The mid-elevation depression (50%) was slightly higher than that of low elevation (45%), so competition became an important factor affecting tree growth and productivity in this area.
Drought stress at low elevations was more significant than that at middle and high elevations. The productivity of trees at low elevations was negatively correlated with Tmin, Tmax and Tmean during the whole growth period (Figure 6). Meanwhile, there was a significant positive correlation with the SPEI at the end of the previous growing season and the SPEI at the beginning of the current growing season (Figure 6). Therefore, drought stress became a strong climate signal affecting the growth of trees at low elevations. The growth of trees in this region initially benefited from an increase in precipitation, but the excessive temperature damaged the enzyme activities related to photosynthesis, affected the progress of tree photosynthesis, intensified the evaporation of soil water, and finally affected the growth and productivity of trees with a sharp increase in temperature in the later period (Jacoby and D’Arrigo, 1995; Massetti and Mendelsohn, 2020; Sun et al., 2021). This pattern was consistent with the ANPP trend at low elevations with an increase followed by a decrease, and the rates of increase and decrease were the most obvious among the three elevations with larger fluctuations (Figure 5). Therefore, the ANPP at low elevations was more sensitive to climate change and significantly affected the carbon sequestration capacity of trees by drought stress.

4.3 ANPP experiencing more severe stress under future climate scenarios

Forest growth plays an important role in maintaining the carbon balance of terrestrial ecosystems (Qiu et al., 2023). Measuring and predicting forest biomass and productivity can help to evaluate the structure and function of forest ecosystems under various environmental conditions and improve our understanding of the terrestrial carbon cycle and forest ecosystem carbon budget (Mao et al., 2014). As an important part of global change research, it is of great significance to predict the spatiotemporal dynamics of forest ANPP and its influencing factors under different climate backgrounds for monitoring and management. Recently, the CMIP6 test data were released, and the sensitivity range of the equilibrium climate reached 1.8℃ to 5.6℃, which was higher than the values of 1.5℃ to 4.5℃ in the IPCC Fifth Assessment Report (Ramos et al., 2022). As an important ecological function area in arid and semiarid regions, how forest productivity, carbon sequestration and energy flow in this region will change under future global warming scenarios and the amplification of mountain warming is crucial for further estimating forest carbon stocks for the study of long-term forest growth dynamics and their underlying mechanisms (Yan et al., 2016).
Our results predict that the ANPP at the three elevations will show downwards trends in the SSP45 and SSP85 scenarios by the end of this century, and the rate of decline in SSP585 will be higher than that in SSP245 (Figure 8). However, the downwards trend of ANPP at the three elevations from the middle to the end of this century will be gentler than that before the middle of this century in the SSP45 scenarios. This result indicates that above ground biomass and tree productivity will be limited to a certain extent, resulting in a threat to tree growth and even increased forest degradation with increasing temperature, CO2 concentration and drought. From the perspective of the elevation gradient, the rate of decline at low elevations in the two climate scenarios was significantly higher than those at high and middle elevations (Figure 8). This means that the ANPP at low elevations is more sensitive to climate change than that at the other two elevations in the context of future climate warming. Therefore, decision-makers should formulate scientific and reasonable management and conservation measures for trees at low elevations. In addition, our study results quantified the different forest productivity and biomass values at different elevation gradients, which can provide more accurate data for ecological processes and remote sensing models to simulate global and regional NPP and carbon cycles.

5 Conclusion

We measured the biomass of trees at the three elevations in the middle part of the Qilian Mountains and quantified the aboveground net primary productivity based on the tree-ring width. The results showed that the master climate factors affecting the NPP at the three elevations were significantly different, and drought stress seriously affected the productivity level and biomass accumulation of trees, especially at lower elevations. In addition, the ANPP trends at the three elevations showed significant decreasing trends under the future two scenarios of SSP45 and SSP85 released by CMIP6, indicating that the intensification of drought will continue to affect the forest productivity of the region under the background of future climate warming. This conclusion is crucial for accurately predicting future global carbon cycle dynamics and their feedbacks to the climate system and for proposing scientific and effective forest management measures.
[1]
Aragão L, Malhi Y, Metcalfe D B et al., 2009. Above- and below-ground net primary productivity across ten Amazonian forests on contrasting soils. Biogeosciences, 6(12): 2759-2788.

DOI

[2]
Babst F, Bouriaud O, Papale D et al., 2014. Above-ground woody carbon sequestration measured from tree rings is coherent with net ecosystem productivity at five eddy-covariance sites. New Phytologist, 201(4): 1289-1303.

DOI PMID

[3]
Chen F, Yuan Y, Wei W, 2011. Climatic response of Picea crassifolia tree-ring parameters and precipitation reconstruction in the western Qilian Mountains, China. Journal of Arid Environments, 75(11): 1121-1128.

DOI

[4]
Chen L M, Halike A, Yao K X, 2022. Spatiotemporal variation in vegetation net primary productivity and its relationship with meteorological factors in the Tarim River Basin of China from 2001 to 2020 based on the Google Earth Engine. Journal of Arid Land, 14(12): 1377-1394.

DOI

[5]
Cheng R, Feng X, Xiao W et al., 2011. Response of net productivity of masson pine (Pinus massoniana) plantation to climate change in north subtropical region. Acta Ecologica Sinica, 31(8): 2086-2095. (in Chinese)

[6]
Clark D A, Brown S, Kicklighter D W et al., 2001. Measuring net primary production in forests: Concepts and field methods. Ecological Applications, 11(2): 356-370.

DOI

[7]
Crimmins T M, Crimmins M A, Bertelsen C D, 2011. Onset of summer flowering in a ‘Sky Island’ is driven by monsoon moisture. New Phytologist, 191(2): 468-479.

DOI PMID

[8]
Darenova E, Acosta M, Pokorny R et al., 2018. Variability in temperature dependence of stem CO2 efflux from Norway spruce trees. Tree Physiology, 38(9): 1333-1344.

DOI PMID

[9]
Dixon R K, Solomon A M, Brown S et al., 1994. Carbon pools and flux of global forest ecosystems. Science, 263(5144): 185-190.

DOI PMID

[10]
Dufresne J L, Fairhead L, Le Treut H et al., 2002. On the magnitude of positive feedback between future climate change and the carbon cycle. Geophysical Research Letters, 29(10): 43-1-43-4.

[11]
Dusenge M E, Duarte A G, Way D A, 2019. Plant carbon metabolism and climate change: elevated CO2 and temperature impacts on photosynthesis, photorespiration and respiration. New Phytologist, 221(1): 32-49.

DOI

[12]
Ewe S M L, Gaiser E E, Childers D L et al., 2006. Spatial and temporal patterns of aboveground net primary productivity (ANPP) along two freshwater-estuarine transects in the Florida coastal everglades. Hydrobiologia, 569: 459-474.

DOI

[13]
Fang J Y, Liu G H, Xu S L, 1996. Biomass and net production of forest vegetation in China. Acta Ecologica Sinica, 16(5): 497-508. (in Chinese)

[14]
Fang O, Wang Y, Shao X, 2016. The effect of climate on the net primary productivity (NPP) of Pinus koraiensis in the Changbai Mountains over the past 50 years. Trees, 30: 281-294.

DOI

[15]
Gill R A, Jackson R B, 2000. Global patterns of root turnover for terrestrial ecosystems. The New Phytologist, 147(1): 13-31.

DOI

[16]
Gong H, Cao L, Duan Y et al., 2023. Multiple effects of climate changes and human activities on NPP increase in the Three-north Shelter Forest Program area. Forest Ecology and Management, 529: 120732.

DOI

[17]
Gower S T, Krankina O, Olson R J et al., 2001. Net primary production and carbon allocation patterns of boreal forest ecosystems. Ecological Applications, 11(5): 1395-1411.

DOI

[18]
Graumlich L J, Brubaker L B, Grier C C, 1989. Long-term trends in forest net primary productivity: Cascade Mountains, Washington. Ecology, 70(2): 405-410.

DOI

[19]
Grier C C, Logan R S, 1977. Old-growth Pseudotsuga menziesii communities of a western Oregon watershed: Biomass distribution and production budgets. Ecological Monographs, 47(4): 373-400.

DOI

[20]
Haynes B E, Gower S T, 1995. Belowground carbon allocation in unfertilized and fertilized red pine plantations in northern Wisconsin. Tree Physiology, 15(5): 317-325.

PMID

[21]
Holmes R L, 1983. Computer-assisted quality control in tree-ring dating and measurement. Tree-Ring Bulletin, 43: 51-67.

[22]
Hu Q, Li T, Deng X et al., 2022. Intercomparison of global terrestrial carbon fluxes estimated by MODIS and Earth system models. Science of the Total Environment, 810: 152231.

DOI

[23]
Ivanova Y, Kovalev A, Soukhovolsky V, 2020. Modeling the radial stem growth of the pine (Pinus sylvestris L.) forests using the satellite-derived NDVI and LST (MODIS/AQUA) data. Atmosphere, 12(1): 12.

DOI

[24]
Jacoby G C, D’Arrigo R D, 1995. Tree ring width and density evidence of climatic and potential forest change in Alaska. Global Biogeochemical Cycles, 9: 227-234.

DOI

[25]
Jiao L, Jiang Y, Wang M et al., 2016. Responses to climate change in radial growth of Picea schrenkiana along elevations of the eastern Tianshan Mountains, Northwest China. Dendrochronologia, 40: 117-127.

DOI

[26]
Keenan T F, Baker I, Barr A et al., 2012. Terrestrial biosphere model performance for inter-annual variability of land-atmosphere CO2 exchange. Global Change Biology, 18(6): 1971-1987.

DOI

[27]
Lan Y, Li C, 2022. Spatiotemporal pattern of vegetation net primary productivity (NPP) and its response to climate change in Qilian Mountains during the past 16 years. Acta Agrestia Sinica, 30(1): 188. (in Chinese)

[28]
Lawrence G B, Lapenis A G, Dan B et al., 2005. Climate dependency of tree growth suppressed by acid deposition effects on soils in Northwest Russia. Environmental Science & Technology, 39(7): 2004-2010.

DOI

[29]
Li C, Liu Y, Zhu T et al., 2023. Considering time-lag effects can improve the accuracy of NPP simulation using a light use efficiency model. Journal of Geographical Sciences, 33(5): 961-979.

DOI

[30]
Liang E, Shao X M, Eckstein D et al., 2010. Spatial variability of tree growth along a latitudinal transect in the Qilian Mountains, northeastern Tibetan Plateau. Canadian Journal of Forest Research, 40(2): 200-211.

DOI

[31]
Litton C M, Raich J W, Ryan M G, 2007. Carbon allocation in forest ecosystems. Global Change Biology, 13(10): 2089-2109.

DOI

[32]
Liu Y R, Jia W X, Huang M et al., 2015. Response of vegetation net primary productivity to climate change in the Qilian Mountains since recent 51 years. Acta Botanica Boreali-Occidentalia Sinica, 35(3): 601-607.

[33]
Liu Z X, 2019. Study on relationship between DBH and tree height of Qinghai spruce in Qilian Mountains area of Minle county. Protection Forest Science and Technology, (11): 26-27. (in Chinese)

[34]
Lucht W, Prentice I C, Myneni R B et al., 2002. Climatic control of the high-latitude vegetation greening trend and Pinatubo effect. Science, 296(5573): 1687-1689.

PMID

[35]
Luo Y, White L W, Canadell J G et al., 2003. Sustainability of terrestrial carbon sequestration: A case study in Duke forest with inversion approach. Global Biogeochemical Cycles, 17(1): 1-13.

[36]
Ma B, Jing J, Liu B et al., 2022. Quantitative assessment of the relative contributions of climate change and human activities to NPP changes in the southwest karst area of China. Environmental Science and Pollution Research, 29(53): 80597-80611.

DOI

[37]
Mao D, Luo L, Wang Z et al., 2015. Variations in net primary productivity and its relationships with warming climate in the permafrost zone of the Tibetan Plateau. Journal of Geographical Sciences, 25(8): 967-977.

DOI

[38]
Mao D, Wang Z, Wu C et al., 2014. Examining forest net primary productivity dynamics and driving forces in northeastern China during 1982-2010. Chinese Geographical Science, 24(6): 631-646. (in Chinese)

DOI

[39]
Mao F, Du H, Zhou G et al., 2022. Simulated net ecosystem productivity of subtropical forests and its response to climate change in Zhejiang province, China. Science of the Total Environment, 838: 155993.

DOI

[40]
Massetti E, Mendelsohn R, 2020. Temperature thresholds and the effect of warming on American farmland value. Climatic Change, 161: 601-615.

DOI

[41]
Melillo J M, Mcguire A D, Kicklighter D W et al., 1993. Global climate change and terrestrial net primary production. Nature, 363(6426): 234-240.

DOI

[42]
Muukkonen P, 2007. Generalized allometric volume and biomass equations for some tree species in Europe. European Journal of Forest Research, 126(2): 157-166.

DOI

[43]
Nadelhoffer K J, Aber J D, Melillo J.M, 1985. Fine roots, net primary production and soil nitrogen availability: A new hypothesis. Ecology, 66(4): 1377-1390.

DOI

[44]
Nagavciuc V, Kern Z, Perşoiu A et al., 2018. Aerial decay influence on the stable oxygen and carbon isotope ratios in tree ring cellulose. Dendrochronologia, 49: 110-117.

DOI

[45]
Nemani R R, Keeling C D, Hashimoto H et al., 2003. Climate-driven increases in global terrestrial net primary production from 1982 to 1999. Science, 300(5625): 1560-1563.

PMID

[46]
Peng S, Piao S, Ciais P et al., 2013. Asymmetric effects of daytime and night-time warming on Northern Hemisphere vegetation. Nature, 501(7465): 88-92.

DOI

[47]
Prentice I C, Heimann M, Sitch, 2000. The carbon balance of the terrestrial biosphere: Ecosystem models and atmospheric observations. Ecological Applications, 10(6): 1553-1573.

DOI

[48]
Qi S, Chen S, Long X et al., 2023. Quantitative contribution of climate change and anthropological activities to vegetation carbon storage in the Dongting Lake basin in the last two decades. Advances in Space Research, 71(1): 845-868.

DOI

[49]
Qiu S, Fang M, Yu Q et al., 2023. Study of spatial-temporal changes in Chinese forest eco-space and optimization strategies for enhancing carbon sequestration capacity through ecological spatial network theory. Science of the Total Environment, 859: 160035.

DOI

[50]
Ramos R D, LeGrande A N, Griffiths M L et al., 2022. Constraining clouds and convective parameterizations in a climate model using paleoclimate data. Journal of Advances in Modeling Earth Systems, 14(8): e2021MS002893.

[51]
Ren H, Zhang L, Yan M et al., 2022. Sensitivity analysis of Biome-BGCMuSo for gross and net primary productivity of typical forests in China. Forest Ecosystems, 9: 100011.

DOI

[52]
Running S W, Nemani R R, Heinsch F A et al., 2004. A continuous satellite-derived measure of global terrestrial primary production. Bioscience, 54(6): 547-560.

DOI

[53]
Schuur E A G, 2003. Productivity and global climate revisited: The sensitivity of tropical forest growth to precipitation. Ecology, 84(5): 1165-1170.

DOI

[54]
Slik J W F, Paoli G, McGuire K et al., 2013. Large trees drive forest aboveground biomass variation in moist lowland forests across the tropics. Global Ecology and Biogeography, 22(12): 1261-1271.

DOI

[55]
Stegen J C, Swenson N G, Enquist B J et al., 2011. Variation in above-ground forest biomass across broad climatic gradients. Global Ecology and Biogeography, 20(5): 744-754.

DOI

[56]
Sun F, Yang S, Chen P, 2005. Climatic warming-drying trend in northeastern China during the last 44 years and its effects. Chinese Journal of Ecology, (7): 751-755. (in Chinese)

[57]
Sun Y, Zhou J, Guo J, 2021. Advances in the knowledge of adaptive mechanisms mediating abiotic stress responses in Camellia sinensis. Frontiers in Bioscience-Landmark, 26(12): 1714-1722.

DOI

[58]
Wang J Y, Che K J, Jiang Z R, 2000. A study on carbon balance of Picea crassifolia in Qilian Mountains. Journal of Northwest Forestry University, 15(1): 9-14. (in Chinese)

[59]
Wang T, Bao A, Xu W et al., 2023. Dynamics of forest net primary productivity based on tree ring reconstruction in the Tianshan Mountains. Ecological Indicators, 146: 109713.

DOI

[60]
Wang Y J, Lu R J, Ma Y Z et al., 2013. Annual variation in PDSI since 1897 AD in the Tengger Desert, Inner Mongolia, China, as recorded by tree-ring data. Journal of Arid Environments, 98: 20-26.

DOI

[61]
Wehr R, Munger J W, Mcmanus J B et al., 2016. Seasonality of temperate forest photosynthesis and daytime respiration. Nature, 534(7609): 680-683.

DOI

[62]
Wilcox K R, Koerner S E, Hoover D L et al., 2020. Rapid recovery of ecosystem function following extreme drought in a South African savanna grassland. Ecology, 101(4): e02983.

DOI

[63]
Xu K, Wang X, Liang P et al., 2017. Tree-ring widths are good proxies of annual variation in forest productivity in temperate forests. Scientific Reports, 7(1): 1-8.

DOI

[64]
Xu Z, Zuo C, Ding S, Carbon peak, 2021. Carbon neutrality empowers high-quality development: Internal logic and realization path. Economist, 11: 62-71. (in Chinese)

DOI

[65]
Yan M, Tian X, Li Z et al., 2016. A long-term simulation of forest carbon fluxes over the Qilian Mountains. International Journal of Applied Earth Observation and Geoinformation, 52: 515-526.

DOI

[66]
Yao Y, Shu S, Wang W et al., 2023. Growth and carbon sequestration of poplar plantations on the Tibetan Plateau. Ecological Indicators, 147: 109930.

DOI

[67]
Zaehle S, Sitch S, Prentice I C et al., 2006. The importance of age-related decline in forest NPP for modeling regional carbon balances. Ecological Applications, 16(4): 1555-1574.

PMID

[68]
Zeng X, Liu Y, Song H et al., 2022. Tree-ring-based drought variability in northern China over the past three centuries. Journal of Geographical Sciences, 32(2): 214-224.

DOI

[69]
Zhang Y, Xu M, Chen H et al., 2009. Global pattern of NPP to GPP ratio derived from MODIS data: Effects of ecosystem type, geographical location and climate. Global Ecology and Biogeography, 18(3): 280-290.

DOI

[70]
Zhang Y, Yu G, Yang J et al., 2014. Climate-driven global changes in carbon use efficiency. Global Ecology and Biogeography, 23(2): 144-155.

DOI

Outlines

/