Research Articles

High leaf area index expands the contrasting effect of climate warming on Western Siberia taiga forests activity before and after 2000

  • SUN Han , 1, 2 ,
  • WANG Xiangping 1, 2
Expand
  • 1. State Key Laboratory of Efficient Production of Forest Resources, Beijing Forestry University, Beijing 100083, China
  • 2. School of Ecology and Nature Conservation, Beijing Forestry University, Beijing 100083, China

Sun Han (1988-), Associate Professor, specialized in climatic change, temperature, timberline, net primary productivity and ecology. E-mail:

Received date: 2023-05-02

  Accepted date: 2023-11-07

  Online published: 2024-01-08

Supported by

The Third Xinjiang Scientific Expedition Program(2021xjkk0603)

The Third Xinjiang Scientific Expedition Program(2022xjkk1205)

National Natural Science Foundation of China(32201258)

National Natural Science Foundation of China(32271652)

Abstract

The taiga vegetation in Western Siberia has been seriously threatened by climate warming in recent decades. However, how vegetation in different growing states and climate conditions responds to climate changes differently is still unclear. Here we explore the vegetation activity trends in Western Siberia taiga forests using the annual rate of change in leaf area index (LAI) during 1982-2018 so as to answer two questions: (1) how did climate warming affect taiga vegetation activity in the recent last decades? (2) Did the growing state of taiga forest affect its response to climate warming? Our results revealed that climate warming promoted taiga vegetation activity in Western Siberia before 2000. However, continuous warming caused excessive evapotranspiration and led to decreased vegetation activity after 2000. Moreover, the intensity of vegetation growth response to warming was positively related to canopy height and LAI, indicating that both the positive and negative effects of warming were more significant in taiga forests in better growing state. Since these forests generally have higher productivity and play more important roles in ecosystem functioning (e.g., carbon sink and biodiversity conservation), our results highlight their vulnerability to future climate change that need more research attention.

Cite this article

SUN Han , WANG Xiangping . High leaf area index expands the contrasting effect of climate warming on Western Siberia taiga forests activity before and after 2000[J]. Journal of Geographical Sciences, 2024 , 34(1) : 131 -145 . DOI: 10.1007/s11442-024-2198-y

1 Introduction

Taiga forest is the second largest terrestrial biome and the largest area of primary forest in the world. It is not only an important source of wood products but also a major carbon sink of the world, which contributes significantly to global climate regulation (Brandt et al., 2013; Gauthier et al., 2015). Taiga forests have been significantly impacted by climate warming which is more drastic at higher latitudes in recent decades (Serreze et al., 2000; Daramola and Xu, 2021; IPCC, 2021). The responses of taiga forests to climate changes include the extension of growth periods, phenological changes, and the invasion of evergreen conifers into larch-dominated forests (Kharuk et al., 2007; Bright et al., 2014). Modeling studies have predicted that taiga regions may be one of the areas with the highest risk of tree cover loss in the coming decades (Kharuk et al., 2007; Hewson et al., 2019). However, which mechanisms affect the response of vegetation activity to climate changes in taiga remains unclear.
Taiga forests in Western Siberia have a large temperature and wetness gradient from the arctic forest line with low evapotranspiration to the extremely arid inland of the Gobi in Central Asia (Brandt et al., 2013; Gauthier et al., 2015). At the end of the last century, these forests were still considered as one of the fastest-growing taiga forests that benefited from global warming (Myneni et al., 1997; Kharuk et al., 2010; Li et al., 2023). However, increasing studies showed that elevated temperature might also decrease vegetation productivity (Giguère-Croteau et al., 2019; Berner and Goetz, 2022; Chen et al., 2022). For example, a study on temperate forests has suggested that climate warming might have opposite effects on the vegetation growth due to difference in water availability (Duveneck and Thompson, 2017). Climate warming is known to be more drastic at higher latitudes (IPCC, 2021; Shen et al., 2022), therefore, the taiga forest growth trends may also be affected by the imbalance of energy and water availability.
This study aimed to examine the response of vegetation activity to climate changes from the southern to the northern range of taiga forests in Western Siberia. On one hand, the more rapid warming trend in the north regions with better water availability might have contributed to increased vegetation growth. On the other hand, the arid Central Asia in south Western Siberia has shown a wetting trend during recent decades due to the melting of glaciers on high mountains caused by climate warming (Balzter, 2010; IPCC, 2021), which may have relieved drought and enhanced vegetation productivity. These potential variations in vegetation activity throughout the taiga region under climate changes require more analyses.
However, some studies stated that climate changes might have weak effects on the vegetation growth in the Western Siberian taiga forest (Hofgaard et al., 2019; Chen et al., 2022). Further, the response of vegetation growth to climate changes may also be regulated by biotic factors. For example, hydraulic limitations imposed by tree height may be an important factor affecting vegetation growth in response to climate changes (McGregor et al., 2020; Au et al., 2022; Sun et al., 2022). According to the hydraulic hypothesis, taller vegetation should be more sensitive to climate changes. Nevertheless, the situation seems to be complicated, because studies have also found that the effect of tree height depended on water and energy availability. For example, Sun et al. (2022) showed that the vegetation activity of taller forests was more vulnerable to hotter drought in water-limited regions, but was promoted by the positive effect of climate warming under productive climate. Taller forests generally possess higher biomass, leaf area index (LAI) and higher productivity (Luo, 1996; Wu et al., 2015; Liu et al., 2018). Hence, we hypothesized that high biomass forests may be more sensitive and adversely affected by climate changes. However, this hypothesis was derived from studies conducted on subtropical forest (Sun et al., 2022). We then tested whether it was applicable to taiga forests at higher latitudes.
LAI is the total leaf area divided by projected canopy area and closely related to productivity (Zhang et al., 2014), and thus a good surrogate of vegetation activity dynamics. Long-time series of LAI can describe the vegetation activity under climate change and reflect inter-annual growth trends of forests. In this study, we used remote-sensed LAI data to study how climate changes interacted with biotic factors to affect the LAI changing trend from the northern to the southern limits of taiga forests in Western Siberia. We aimed to answer the following two questions: (1) how did taiga vegetation activity in Western Siberia respond to climate changes in recent decades? (2) Did the growing state of taiga forst affect its response to climate warming? In other words, the question was whether taiga forests with a higher LAI are more sensitive in climate changes.

2 Materials and methods

2.1 Study area

Our study area included the region between 45°-68°N and 77°-97°E in Western Siberia (Figure 1a). This area had a typical cold continental climate, with cold and dry climate in winter and warm and humid climate in summer. The study area could be divided into three latitudinal zones. The high latitudinal zone includes the Arctic forest line covered by needle-leaved deciduous forests, while the middle latitudinal zone is distributed at the Western Siberian Plain and has relatively good water and energy conditions. The low latitudinal zone includes the Altay-Sayan highland in the arid region of Central Asia with complex topography, and predominantly covered by broad-leaved deciduous forests and mixed broad-leaved and needle-leaved forests (Figures 1b and 1c).
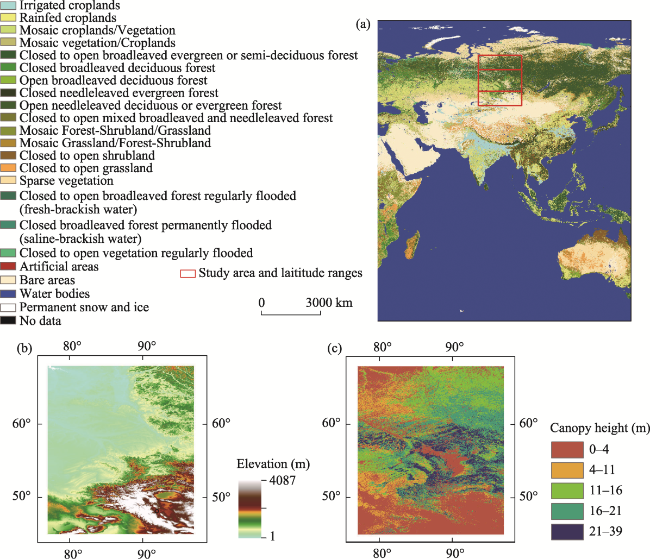
Figure 1 (a) Location of the study region in Eurasia. The land cover types were determined according to the global land cover data at a resolution of 300 m (GlobCover 2009 v2.3) which was produced via global collaborative efforts (Arino et al., 2008). (b) Topography of the study region. The elevation data was derived from the Shuttle Radar Topography Mission (SRTM) digital elevation datasets at a resolution of 90 m (Jarvis et al., 2008). (c) Canopy height patterns across the study region. The forest height data were extracted from a global forest height map, which was estimated from satellite Lidar (light detection and ranging) data (Simard et al., 2011).
The LAI data used in this study was the Global land surface satellite (GLASS) LAI data with a spatial resolution of 0.05° and a temporal resolution of 8 days, which was provided by the GLCF (Global Land Cover Facility, (Liang et al., 2013; Liang et al., 2021), and supported from National Earth System Science Data Center, National Science & Technology Infrastructure of China (http://www.geodata.cn). The GLASS LAI product has high quality characterized by its spatial and temporal continuity and low uncertainty compared with other datasets (Xiao et al., 2017; Xu et al., 2018), especially for forests (Liu et al., 2018). We extracted LAI data from 1982 to 2018 in the Western Siberia region to analyze the growth trends of taiga forests. The historical climate data between 1982 and 2018 for the study region were obtained from the Climate Research Center of the University of East Anglia (CRU TS 4.04) with a 0.5° × 0.5° spatial resolution (University of East Anglia Climatic Research Unit et al., 2020) to analyze the effect of climate conditions and climate trends on temporal LAI dynamics. The CRU dataset provides not only climate data with long-time series but also appropriate climate indices for our analyses. We selected annual potential evapotranspiration (PET) as a proxy for energy availability and the Palmer drought severity index (PDSI) as an index of water availability. The forest height data were extracted from a global forest height map, which was estimated from satellite Lidar (light detection and ranging) data (Simard et al., 2011), to analyze the effect of canopy height on the growth response of taiga vegetation to climate changes. All the data was resampled to the same grain size of LAI data (0.05° × 0.05°) before calculations.

2.2 Data analyses

We averaged the 8 days temporal resolution LAI to calculate the mean LAI for each year by each pixel. We fitted the yearly LAI of each pixel against calendar year (1982-2018) and used the regression slopes to reflect the rate of change in LAI per year, which is a widely-used method to quantify the temporal trend of vegetation activity (Liu et al., 2018). To explore the potential drivers of spatial pattern of LAI slope across the study region, for each pixel we calculated explanatory variables as follows. 1) Climate trends and conditions. For each pixel we calculated the slope of PDSI and PET changes across 1982‒2018, and the multi-decades mean of PDSI and PET, as the indices of climate trends and conditions, respectively. 2) Biotic factors. As mentioned above, forests with different height and productivity might also show different responses to climate changes. Therefore, we used the mean LAI from 1982 to 2018 as an index of forest productivity, together with Lidar-derived forest height data, to analyze the effects of biotic factors on LAI slopes for each pixel. We screened other ecosystems except forests out based on the global cover data for statistics to avoid statistical bias.
We used the piecewise linear regression analysis to detect the year when the slope of the temporal LAI of the study area changes as the breakpoints, and the result showed the year 2000 as the breakpoint (Ryan and Porth, 2007). For comparison of LAI trend and its drivers before and after 2000, we calculated the changing rate (regression slope) and multi-decades mean of LAI, PET, and PDSI over 1982‒2000 and 2001‒2018, respectively. Based on the difference in climate, vegetation types and topography, we divided the study area into three latitudinal zones: low (45°N-52°N), middle (52°N-61°N), and high (61°N-68°N) latitudes. We then examined how the response of vegetation activity to climate changes differed among the three latitudinal zones.
We examined the correlations of LAI slope with climate conditions (multi-year mean PET and PDSI), climate trends (PET and PDSI slopes), canopy height, and mean LAI to test the effect of abiotic and biotic factors on taiga vegetation growth trend. Then, we established random forest regression models to explain the LAI slopes with the aforementioned predictors to determine their relative importance on growth trends of taiga vegetation. Random forest regression is a nonparametric machine learning statistical technique which is based on combining many classification or regression trees generated with a different bootstrapped subset of the original data (Breiman, 2001). Variable importance of the models was used to determine the relative impact of variables which was defined as the change in model accuracy (mean squared error) when a given variable is randomly permuted in the out-of-bag samples (Genuer et al., 2010).
All statistical analyses were performed with R 3.5.3 (R Development Core Team, 2014) and ArcGIS 10.4.

3 Results

Mean PET across 1982‒2018 was higher towards southwest in the study area (Figure 2a). From 1982 to 2018, a widespread increasing PET trend was observed across the study area except in the northwest corner, and climate warming was generally more drastic toward the southeast (Figure 2b).
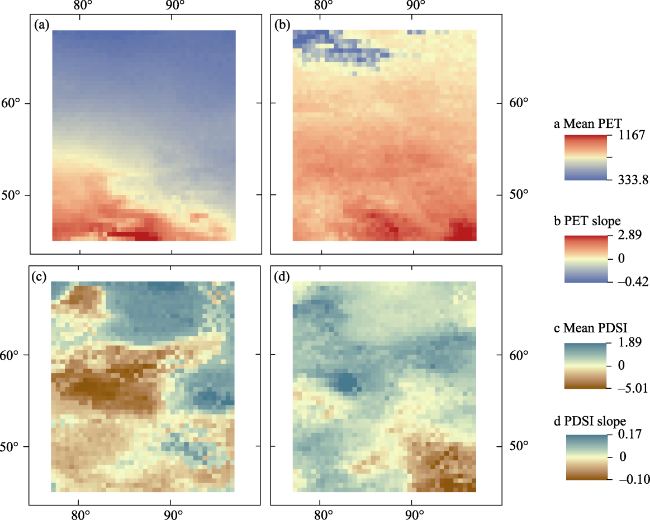
Figure 2 Spatial patterns of climatic conditions and climate change trends for taiga forests from 1982 to 2018. (a and c) Mean annual potential evapotranspiration (PET) and Palmer drought severity index (PSDI) from 1982 to 2018. (b and d) Slope of PET and PDSI change during 1982-2018, respectively.
Multi-decadal mean PDSI declined from northeast to southwest (PDSI < -1 was defined as water deficit (Alley, 1984). During 1982‒2018, the PDSI showed an overall increasing trend (except in the southeast corner). The wetting trend was more drastic at the middle and high latitudes, which might have alleviated the serious drought in the middle regions. However, despite the overall slight wetting trends, 27.89% of the study area showed declining PDSI trends (of which 16.04% declined significantly), especially in the southeast corner of the study area (in Mongolia) with aggravated drought trends (Figure 2d).
The study area experienced general climate warming trends (i.e., an increase in PET) during the periods of 1982-2000 and 2001-2018, although the spatial pattern of warming differed between the two periods (Figures 3a and 3b). The proportion of areas with decreasing PDSI trend was 50.16% during 1982-2000, and was 29.74% during 2001-2018. The water availability generally decreased before 2000 but increased significantly after 2000 in the middle latitudinal zone of the study area. However, the southern regions located in China suffered both drastic warming and drought trends after 2000 (Figures 3c and 3d).
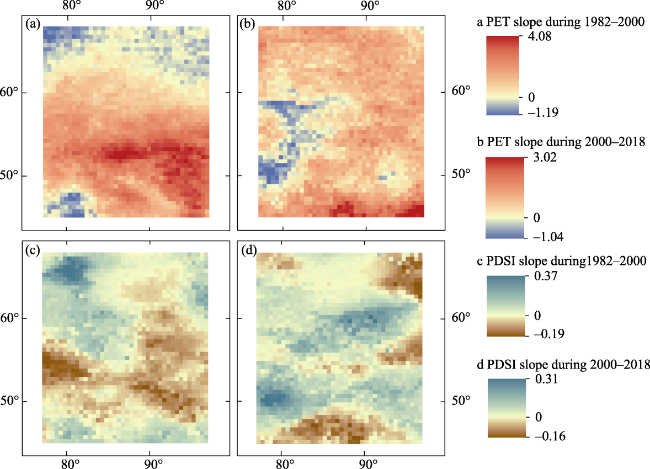
Figure 3 Spatial patterns of climate change trends before and after 2000. (a and c) Slope of potential evapotranspiration (PET) and Palmer drought severity index (PSDI) during 1982-2000. (b and d) PET and PDSI slope during 2000-2018, respectively.
The mean LAI across 1982-2018 was clearly higher in the middle latitudinal zone than in the low and high latitudinal zones, suggesting better vegetation growth at the middle latitudes (Figure 4a). For the 1982-2018 period, the LAI slope was not significant in most parts of the study area (Figure 4b), which might be because LAI changed contrastively before and after 2000. The LAI for the study region showed an overall significant increase before 2000, but subsequently revealed an overall decrease after the breakpoint of the year 2000 (Figure 5).
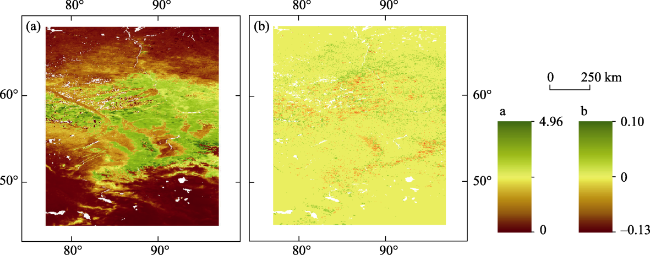
Figure 4 Spatial patterns of (a) multi-decade mean leaf area index (LAI), and (b) annual changing rate (slope) of LAI during 1982-2018
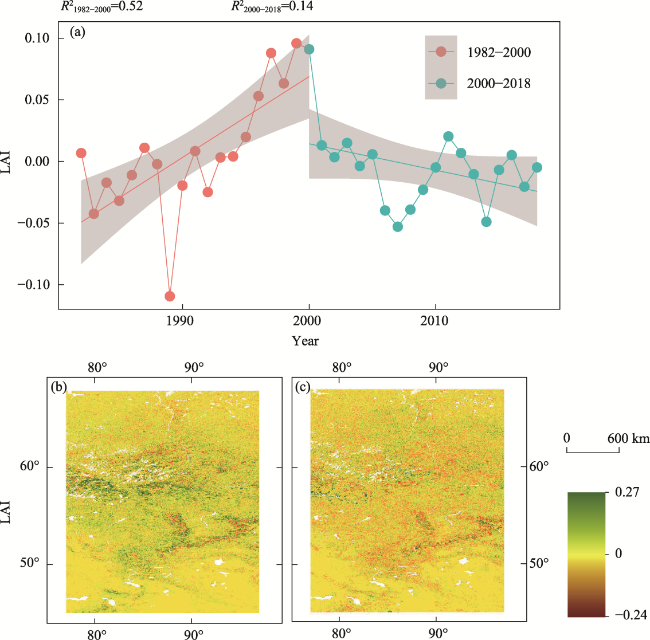
Figure 5 Contrasting temporal trends of leaf area index (LAI) before and after 2000. (a) Interannual variations in the mean LAI across the study area. R21982-2000 and R22000-2018 represent the R2 of the fitted line during 1982-2000 and 2000-2018, respectively. (b) and (c), spatial patterns of LAI slopes during 1982-2000 and 2000-2018, respectively.
The LAI trend also differed among the low, middle, and high latitudinal zones (Figure 6). Before 2000, the LAI revealed an overall increase (median slope > 0) in all the three zones, with a significantly higher increasing rate in the middle latitudinal zone (Figure 6c). However, the increasing trends in these latitudinal zones disappeared after 2000, especially in the middle latitudinal zone where the LAI slope was even lower than in the other two latitudinal zones (Figure 6d).
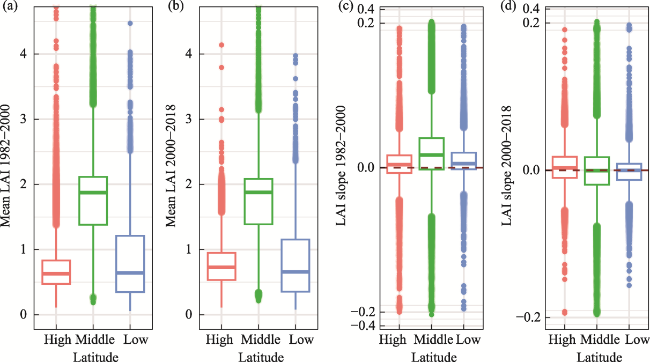
Figure 6 (a and b) Multi-year mean leaf area index (LAI) and (c and d) LAI changing rate (slope) before and after 2000 in the low, middle and high latitudinal zones of the study area
We also examined the potential effects of climate and biotic factors on LAI trends, and found clear differences before and after 2000 (Figure 7). Biotic factors such as the vegeta-tion height and mean LAI showed close positive correlations with LAI slope for the overall study area before 2000, but had weak negative effects on LAI slope after 2000. Additionally, these relationships were stronger in the middle and low latitude zones. Meanwhile, LAI slope was generally positively correlated with mean PET and PET slope during 1982-2000,suggesting that higher energy availability promoted the increasing rate of LAI before 2000. However, these correlations generally turned to negative ones after 2000, suggesting that further increase in temperature (evapotranspiration) had caused water deficit for vegetation growth. This effect was further supported by the fact that the correlations of LAI slope with mean PDSI were generally negative before 2000 but changed to positive correlations after 2000, suggesting water deficit as the key limiting factor for vegetation activity after 2000.
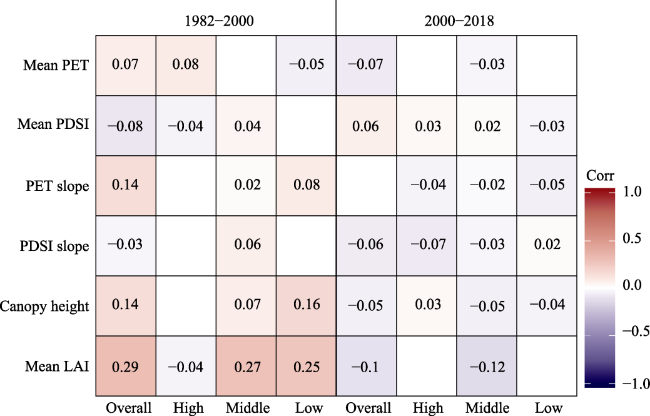
Figure 7 Correlations of climate and biotic factors with LAI slope before and after 2000, for the study area (overall) and for the high, middle and low latitudinal zones. Non-significant correlations (p > 0.05) were not shown.
The random forest model with climate and biotic factors explained 61.33% of variance in LAI slope for the overall study area, and explained 70.93%, 58.66%, 52.98% of variance for the high, middle and low latitudinal zones, respectively (Table 1). Water availability (mean PDSI) and its changing rate (PDSI slope) were the most important predictors of LAI slope for the overall study area, and were also important predictors in the middle and low latitudinal zones. Mean LAI was the most important driver of LAI slope in all the three latitudinal zones, and was also important for the overall study area. Canopy height presented to be an important variable in the middle latitudinal zone, while energy availability (mean PET) and its changing rate (PET slope) showed importance only in the low latitudinal zone.
Table 1 Standardized relative importance of predictors in the random forest models to explain the LAI slope during 1982-2018 for the study area (overall) and for the high, middle, and south latitudinal zones. Each importance value was calculated in proportion to the maximum importance observed, and thus the highest importance was 1. More important variables (> 0.5) are boldfaced.
Overall High Middle Low
Mean PET 0.48 0.40 0.39 0.65
PET slope 0.41 0.43 0.23 0.60
Mean PDSI 1.00 0.25 0.52 0.69
PDSI slope 0.89 0.47 0.41 0.61
Canopy height 0.36 0.46 0.56 0.35
Mean LAI 0.79 1.00 1.00 1.00

4 Discussion

4.1 Contrasting response of taiga vegetation activity to climate warming in Western Siberia before and after 2000

Global warming has become an increasing threat to ecosystems in recent decades, especially at high latitudes, which has become a research focus (Gauthier et al., 2015; Girardin et al., 2016; Giguère-Croteau et al., 2019; Miles et al., 2019; Qian et al., 2022). Many studies have argued that climate warming may elongate the growing season and promote vegetation growth in the high latitudes (Gordo and Sanz, 2010; Forkel et al., 2016; Welp et al., 2016; Piao, 2019; Berner and Goetz, 2022). However, climate warming can also cause a series of deleterious effects that threaten the growth of taiga forest ecosystem, including the thawing of frozen soil, migration of evergreen trees from lower latitudes (Kharuk et al., 2007; Price et al., 2013; Boulanger et al., 2017; Chen et al., 2022). Thus, whether climate warming promotes the taiga vegetation growth is still controversial.
Our study area has experienced continuous climate warming since the 1980s. We found that climate warming was more drastic at lower latitudes in the Western Siberia. This area was also shown as a warming hotspot in Western Siberia during 1991‒2007, based on the dynamics of mean air temperatures (Shulgina et al., 2011). Moreover, the southern regions had experienced one of the most drastic warming and drying trends in Western Siberia after 2000 (Chen et al., 2014). If this warming trend continues, the taiga forests in these regions may be more seriously affected (Frelich et al., 2021).
We showed that the effect of climate warming might be changed under different climate conditions. LAI responded positively to climate warming before the breakpoint year of 2000, but switched to a negative response after that. Similarly, Kharuk et al. (2021) found that warming first promoted the radial growth of both Siberian pine and fir but then continued warming led to a growth decrease, and suggested the later growth depression was caused by drought due to excessive evapotranspiration under elevated temperature (Kharuk et al., 2018; Kharuk et al., 2021). Our results based on LAI trend also supported this effect. It indicated that climate warming would promote the growth of vegetation at high latitudes (Myneni et al., 1997; Serreze et al., 2000), we observed that taiga forests activity was promoted by energy availability and warming trend before 2000, when climate warming has not caused water deficit. However, after 2000, continued warming triggered water deficit and led to a widespread growth decline in Taiga forests.
Although the warming trend at high latitudes may increase the melting of glaciers and permafrost and thus increase the volume of surface runoff (Balzter, 2010), it may not necessarily increase the water availability for forests. This is because increasing temperature also leads to higher evapotranspiration, and the thawing of permafrost accelerates water infiltration and evaporation. These effects offset the weakly increasing trend of water availability and lead to increased drought, which adversely affects the growth and productivity of taiga vegetation (Schuur et al., 2013; Fisher et al., 2016; Helbig et al., 2016; Li et al., 2021; Chen et al., 2022). Ted and Schwarz (1997) showed that despite model-predicted precipitation increases in the taiga forest region, greater evaporation caused by climate warming led to a decline in the climate humidity index and thus a drought trend. Drought may not only affect vegetation growth per see but can also lead to an increase in the frequency of forest fires, pests, and other diseases, which also affect forest growth (Michaelian et al., 2011; Peng et al., 2011; Price et al., 2013). Our random forest model confirmed that water availability had become the primary factor limiting taiga forest growth. Consequently, although warming trends at high latitudes have attracted the attention of many researchers, water availability may be the key factor affecting the growth of taiga forests, especially after 2000 and resulted in different growth trends at lower latitude. When the temperature increase exceeds a threshold, vegetation growth may decline with continued climate warming. Therefore, the importance of the energy-water balance to the growth of taiga vegetation needs more future researches.
The aforementioned phenomenon was more significant in the middle and southern parts of the study area, implying that taiga forest may retreat from its southern marge in China under future climate warming (Kharuk et al., 2007). Moreover, previous studies have observed the invasion of evergreen tree species at lower latitudes into the taiga forest region (Kharuk et al., 2007; Frelich et al., 2021), which can also reduce the area of taiga forest.

4.2 Effects of biotic factors on the response of taiga forest to climate change

Our results showed that the temporal LAI trend of taiga forests was comprehensively affected by biotic and abiotic factors. Taiga forests with different LAI and height differed in their sensitivity to climate changes. In the Western Siberia area, the trees in the south and north regions were shorter and the taiga forests had lower LAI due to lower water availability and temperature, respectively. Meanwhile, trees were taller and had higher LAI and productivity due to sufficient water and energy availability in the middle latitudinal zone (Balzter, 2010; IPCC, 2021). Our results showed that the LAI slope in the middle latitudes altered more drastically before and after 2000 compared with the other two zones. Furthermore, our results indicated that higher LAI led vegetation growth to increase more rapidly under climate warming before 2000 when energy and water conditions were good, but caused a greater negative effect on the growth trend after 2000 with increased hotter drought (Figure 7 and Table 1). Therefore, the results supported our hypothesis stating that the growth status of a forest itself might be an important factor affecting its response to climate changes.
According to the metabolic scaling theory, taller trees would have larger leave areas which led to higher LAI and higher metabolic rate (West et al., 1999). A study in southwest China showed that taller forests might lead to increased vegetation activity under a more favorable climate condition, which in turn can support higher productivity (Sun et al., 2022). When the water availability is not limited, the growth of taiga forests may be limited by temperature. Previous studies showed that the warming trends not only increased the growth rate of trees, but can also accelerate the absorption of nutrients by plant roots and the cycling of ecosystems (Davidson and Janssens, 2006; Allison et al., 2018). In this condition, taller forests with higher LAI may have greater growth advantage and potential productivity during climate warming, which in turn improved vegetation growth more significantly. However, more leaves of taller trees lead to higher transpiration need and water requirement during growth. When continued warming triggered hotter drought, taller and larger trees may not be able to obtain sufficient water, and thus become more vulnerable to drought.
These two mechanisms could respectively explain the increasing and decreasing LAI trend in the middle latitude zones (with larger LAI) before and after 2000. Further, this result indicated that the limiting effect of water in Western Siberia was still weak before 2000, but had become a key limitation for vegetation activity after 2000.
Therefore, an important implication can be drawn that greater decline of growth may occur in forests with higher LAI under adverse climate changes. Generally, these forests have better forest ecosystem functions (such as being larger carbon pools), and thus need more research attention.

5 Conclusion

Our study revealed a significant increase in the temperature in Western Siberia in the past 37 years, and the warming trend in the south regions was higher than that in the north. Continued climate warming and the associated difference in water balance have resulted in different growth trends before and after 2000. Before 2000, climate warming has promoted taiga vegetation activity due to lower evapotranspiration and thus better water conditions. However, after 2000, the continued large-scale warming caused excessive evapotranspiration and decreased water availability, which led to the decline in taiga forests activity. Further hotter drought trends may seriously threaten the southern boundary of taiga forests, which is the only taiga forest area in northwest China.
The response of taiga forests to climate changes was significantly related to their own growth status, and taller forests with higher LAI are more sensitive to climate change. These forests generally have more significant ecosystem functions, and thus the growth trends of these forests under climate change deserve more future studies.

6 Acknowledgments

Acknowledgement for the data support from National Earth System Science Data Center, National Science & Technology Infrastructure of China (http://www.geodata.cn). We thank Dr. Yunfeng Cao for helping with data collection.
[1]
Alley W, 1984. The palmer drought severity index: Limitations and assumptions. Journal of Applied Meteorology and Climatology, 23: 1100-1109.

[2]
Allison S, Romero-Olivares A, Lu Y et al., 2018. Temperature sensitivities of extracellular enzyme vmax and km across thermal environments. Global Change Biology, 24(7): 2884-2897.

DOI PMID

[3]
Au T, Maxwell J, Robeson S et al., 2022. Younger trees in the upper canopy are more sensitive but also more resilient to drought. Nature Climate Change, 12(12): 1168-1174.

DOI

[4]
Balzter H, 2010. Environmental Change in Siberia:Earth Observation, Field Studies and Modelling. Dordrecht Heidelberg London, New York: Springer.

[5]
Berner L, Goetz S, 2022. Satellite observations document trends consistent with a boreal forest biome shift. Global Change Biology, 28(2): 3275-3292.

DOI

[6]
Brandt J, Flannigan M, Maynard D et al., 2013. An introduction to Canada’s boreal zone: Ecosystem processes, health, sustainability, and environmental issues. Environmental Reviews, 21(12): 207-226.

DOI

[7]
Breiman L, 2001. Random forests. Machine Learning, 45: 5-32.

DOI

[8]
Bright R, Antón-Fernández C, Astrup R et al., 2014. Climate change implications of shifting forest management strategy in a boreal forest ecosystem of Norway. Global Change Biology, 20(2): 607-621.

PMID

[9]
Chen F, Yuan Y, Wei W et al., 2014. Precipitation reconstruction for the southern Altay Mountains (China) from tree rings of Siberian spruce, reveals recent wetting trend. Dendrochronologia, 32(3): 266-272.

DOI

[10]
Chen Z, Zhang Y, Li Z et al., 2022. Climate change increased the intrinsic water use efficiency of Larix gmelinii in permafrost degradation areas, but did not promote its growth. Agricultural and Forest Meteorology, 320(6): 108957.

DOI

[11]
Daramola M, Xu M, 2021. Recent changes in global dryland temperature and precipitation. International Journal of Climatology, 42(7): 1267-1282.

DOI

[12]
Davidson E, Janssens I, 2006. Temperature sensitivity of soil carbon decomposition and feedbacks to climate change. Nature, 440(3): 165-173.

DOI

[13]
Duveneck M, Thompson J, 2017. Climate change imposes phenological trade-offs on forest net primary productivity. Journal of Geophysical Research: Biogeosciences, 122(9): 2298-2313.

[14]
Fisher J, Estop-Aragonés C, Thierry A et al., 2016. The influence of vegetation and soil characteristics on active-layer thickness of permafrost soils in boreal forest. Global Change Biology, 22(6): 3127-3140.

DOI

[15]
Forkel M, Carvalhais N, Rödenbeck C et al., 2016. Enhanced seasonal CO2 exchange caused by amplified plant productivity in northern ecosystems. Science (American Association for the Advancement of Science), 351(2): 696-699.

DOI

[16]
Frelich L, Montgomery R, Reich P, 2021. Seven ways a warming climate can kill the southern boreal forest. Forests, 12(4): 560.

DOI

[17]
Gauthier S, Bernier P, Kuuluvainen T et al., 2015. Boreal forest health and global change. Science, 349(8): 819-822.

DOI

[18]
Genuer R, Poggi J, Tuleau-Malot C, 2010. Variable selection using random forests. Pattern Recognition Letters, 31(10): 2225-2236.

DOI

[19]
Giguère-Croteau C, Boucher É, Bergeron Y et al., 2019. North America’s oldest boreal trees are more efficient water users due to increased [CO2], but do not grow faster. Proceedings of the National Academy of Sciences, 116(1): 2749-2754.

DOI

[20]
Girardin M, Bouriaud O, Hogg E et al., 2016. No growth stimulation of Canada’s boreal forest under half-century of combined warming and CO2 fertilization. Proceedings of the National Academy of Sciences, 113(52): E8406.

[21]
Gordo O, Sanz J, 2010. Impact of climate change on plant phenology in mediterranean ecosystems. Global Change Biology, 16(3): 1082-1106.

DOI

[22]
Helbig M, Pappas C, Sonnentag O, 2016. Permafrost thaw and wildfire: Equally important drivers of boreal tree cover changes in the Taiga Plains, Canada. Geophysical Research Letters, 43(2): 1598-1606.

DOI

[23]
Hewson J, Crema S, González-Roglich M et al., 2019. New 1 km resolution datasets of global and regional risks of tree cover loss. Land, 8: 14.

DOI

[24]
Hofgaard A, Ols C, Drobyshev I et al., 2019. Non-stationary response of tree growth to climate trends along the Arctic margin. Ecosystems, 22(7): 434-451.

DOI

[25]
IPCC, 2021. Climate Change 2021: The Physical Science Basis. IPCC: Switzerland.

[26]
Kharuk V, Im S, Dvinskaya M, 2010. Forest-tundra ecotone response to climate change in the western Sayan Mountains, Siberia. Scandinavian Journal of Forest Research, 25(4): 224-233.

DOI

[27]
Kharuk V, Im S, Petrov I, 2018. Warming hiatus and evergreen conifers in Altay-Sayan region, Siberia. Journal of Mountain Science, 15(12): 2579-2589.

DOI

[28]
Kharuk V, Im S, Petrov I et al., 2021. Climate-driven conifer mortality in Siberia. Global Ecology and Biogeography, 30(12): 543-556.

DOI

[29]
Kharuk V, Ranson K, Dvinskaya M, 2007. Evidence of evergreen conifer invasion into larch dominated forests during recent decades in Central Siberia. Eurasian Journal of Forest Research, 10(12): 163-171.

[30]
Li C, Zhuang D, He J et al., 2023. Spatiotemporal variations in remote sensing phenology of vegetation and its responses to temperature change of boreal forest in tundra-taiga transitional zone in the Eastern Siberia. Journal of Geographical Sciences, 33(3): 464-482.

DOI

[31]
Li Y, Liu H, Zhu X et al., 2021. How permafrost degradation threatens boreal forest growth on its southern margin? Science of the Total Environment, 762(10): 143154.

DOI

[32]
Liang S, Cheng J, Jia K et al., 2021. The global land surface satellite (glass) product suite. Bulletin of the American Meteorological Society, 102(9): E323-E337.

DOI

[33]
Liang S, Zhao X, Liu S et al., 2013. A long-term global land surface satellite (glass) dataset for environmental studies. International Journal of Digital Earth, 6(5): 5-33.

DOI

[34]
Liu Y, Xiao J, Ju W et al., 2018. Satellite-derived LAI products exhibit large discrepancies and can lead to substantial uncertainty in simulated carbon and water fluxes. Remote Sensing of Environment, 206(3): 174-188.

DOI

[35]
Luo T, 1996. Patterns of net primary productivity for Chinese major forest types and its mathematical models[D]. Beijing: Chinese Academy of Sciences.

[36]
McGregor I, Helcoski R, Kunert N et al., 2020. Tree height and leaf drought tolerance traits shape growth responses across droughts in a temperate broadleaf forest. New Phytologist, 231(10): 601-616.

DOI

[37]
Michaelian M, Hogg E, Hall R et al., 2011. Massive mortality of aspen following severe drought along the southern edge of the Canadian boreal forest. Global Change Biology, 17(6): 2084-2094.

DOI

[38]
Miles M, Miles V, Esau I, 2019. Varying climate response across the tundra, forest-tundra and boreal forest biomes in northern West Siberia. Environmental Research Letters, 14(5): 75008.

DOI

[39]
Myneni R, Keeling C, Tucker C et al., 1997. Increased plant growth in the northern high latitudes from 1981 to 1991. Nature, 386(4): 698-702.

DOI

[40]
Peng C, Ma Z, Lei X et al., 2011. A drought-induced pervasive increase in tree mortality across Canada’s boreal forests. Nature Climate Change, 1(12): 467-471.

DOI

[41]
Piao S, Wang X, Park T et al., 2019. Characteristics, drivers and feedbacks of global greening. Nature Reviews Earth & Environment, 1(12): 14-27.

[42]
Price D, Alfaro R, Brown K et al., 2013. Anticipating the consequences of climate change for Canada’s boreal forest ecosystems. Environmental Reviews, 21(12): 322-365.

DOI

[43]
Qian H, Zhang Y, Ricklefs R et al., 2022. Relationship of minimum winter temperature and temperature seasonality to the northern range limit and species richness of trees in North America. Journal of Geographical Sciences, 32(1): 280-290.

DOI

[44]
Ryan S, Porth L, 2007. A tutorial on the piecewise regression approach applied to bedload transport data. Rocky Mountain Research Station.

[45]
Schuur E, Abbott B, Bowden W et al., 2013. Expert assessment of vulnerability of permafrost carbon to climate change. Climatic Change, 119(3): 359-374.

DOI

[46]
Serreze M, Walsh J, Chapin F et al., 2000. Observational evidence of recent change in the northern high-latitude environment. Climatic Change, 46(7): 159-207.

DOI

[47]
Shen B, Song S, Zhang L et al., 2022. Temperature trends in some major countries from the 1980s to 2019. Journal of Geographical Sciences, 32(1): 79-100.

DOI

[48]
Shulgina T, Genina E, Gordov E, 2011. Dynamics of climatic characteristics influencing vegetation in Siberia. Environmental Research Letters, 6(10): 45210.

DOI

[49]
Simard M, Pinto N, Fisher J et al., 2011. Mapping forest canopy height globally with spaceborne lidar. Journal of Geophysical Research, 116(12): G04021.

[50]
Sun H, Wang X, Fan D et al., 2022. Contrasting vegetation response to climate change between two monsoon regions in southwest China: The roles of climate condition and vegetation height. Science of the Total Environment, 802(1): 149643.

DOI

[51]
University of East Anglia Climatic Research Unit, Harris I C, Jones P D et al., 2020. CRU TS4.04: Climatic research unit (CRU) time-series (TS) version 4.04 of high-resolution gridded data of month-by-month variation in climate. Centre for Environmental Data Analysis.

[52]
Welp L, Patra P, Piper S et al., 2016. Increasing summer net CO2 uptake in high northern ecosystems inferred from atmospheric inversions and comparisons to remote-sensing NDVI. Atmospheric Chemistry and Physics, 16(7): 9047-9066.

[53]
West G, Brown J, Enquist B, 1999. A general model for the structure and allometry of plant vascular systems. Nature, 400(8): 664-667.

DOI

[54]
Wu X, Wang X, Wu Y et al., 2015. Forest biomass is strongly shaped by forest height across boreal to tropical forests in China. Journal of Plant Ecology, 8(12): 559-567.

[55]
Xiao Z, Liang S, Jiang B, 2017. Evaluation of four long time-series global leaf area index products. Agricultural and Forest Meteorology, 246(11): 218-230.

DOI

[56]
Xu B, Li J, Park T et al., 2018. An integrated method for validating long-term leaf area index products using global networks of site-based measurements. Remote Sensing of Environment, 209(5): 134-151.

DOI

[57]
Zhang G, Ganguly S, Nemanl R et al., 2014. Estimation of forest aboveground biomass in California using canopy height and leaf area index estimated from satellite data. Remote Sensing of Environment, 151(8): 44-56.

DOI

Outlines

/