
Journal of Geographical Sciences >
Carbon sink response of terrestrial vegetation ecosystems in the Yangtze River Delta and its driving mechanism
Received date: 2023-03-13
Accepted date: 2023-07-28
Online published: 2024-01-08
Supported by
National Key R&D Program of China(2018YFD1100101)
The carbon cycle of terrestrial ecosystems is influenced by global climate change and human activities. Using remote sensing data and land cover products, the spatio-temporal variation characteristics and trends of NEP in the Yangtze River Delta from 2000 to 2020 were analyzed based on the soil respiration model. The driving influences of ecosystem structure evolution, temperature, rainfall, and human activities on NEP were studied. The results show that the NEP shows an overall distribution pattern of high in the southeast and low in the northwest. The area of carbon sinks is larger than that of the carbon sources. NEP spatial heterogeneity is significant. NEP change trend is basically unchanged or significantly better. The future change trend in most areas will be continuous decrease. Compared with temperature, NEP are more sensitive to precipitation. The positive influence of human activities on NEP is mainly observed in north-central Anhui and northern Jiangsu coastal areas, while the negative influence is mainly found in highly urbanized areas. In the process of ecosystem structure, the contribution of unchanged areas to NEP change is greater than that of changed areas.
ZHAO Haixia , FAN Jinding , GU Binjie , CHEN Yijiang . Carbon sink response of terrestrial vegetation ecosystems in the Yangtze River Delta and its driving mechanism[J]. Journal of Geographical Sciences, 2024 , 34(1) : 112 -130 . DOI: 10.1007/s11442-024-2197-z
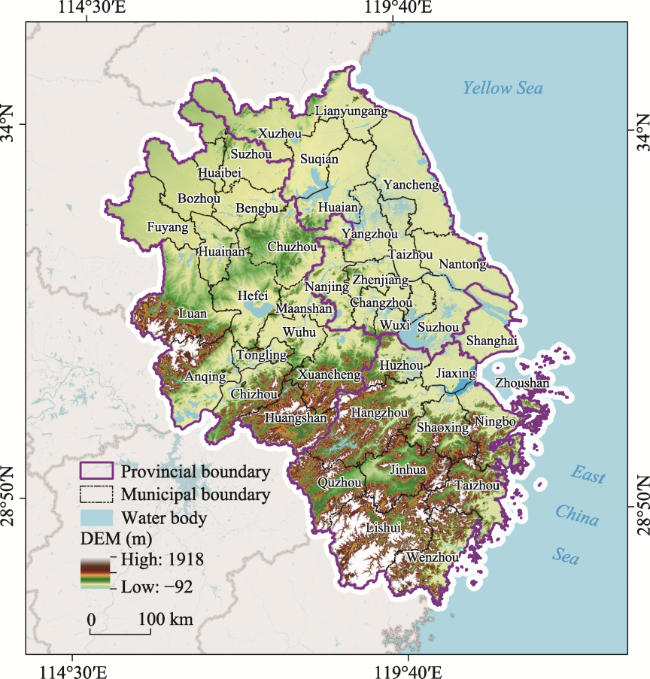
Figure 1 Location of the Yangtze River Delta region |
Table 1 Data source specific information and pre-processing |
| Data | Sources | Resolution | Pre-processing | |
|---|---|---|---|---|
| Land use | GlobleLand30 (http://www.globallandcover.com/) | 30 m | Classified into eight categories, including cultivated land, forest, shrubland, grassland, wetland, water body, developed land, and bare land | |
| DEM | Shuttle Radar Topography Mission (SRTM) | 30 m | / | |
| NPP | MOD17A3HGF V6 product on the NASA website | 500 m | GEE platform pre-processing | |
| Meteorolo- gical data | Rainfall | National Earth System Science Data Center (http://www.geodata.cn) | 1 km | Resampling to 500 m resolution |
| Temperature | GPRChinaTemp1km | 1 km | ||
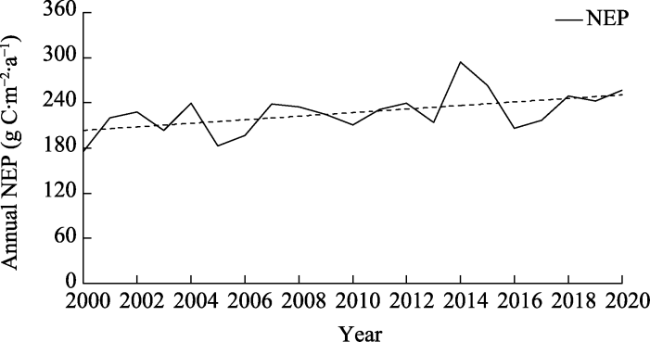
Figure 2 Time series variation of annual mean NEP values in the Yangtze River Delta |
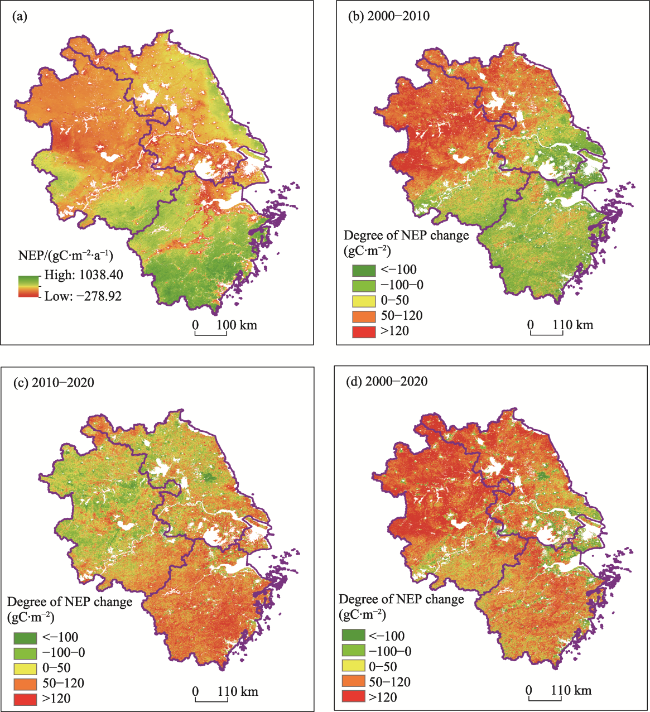
Figure 3 Spatial distribution of NEP changes and multi-year mean values in the Yangtze River Delta from 2000 to 2020 |
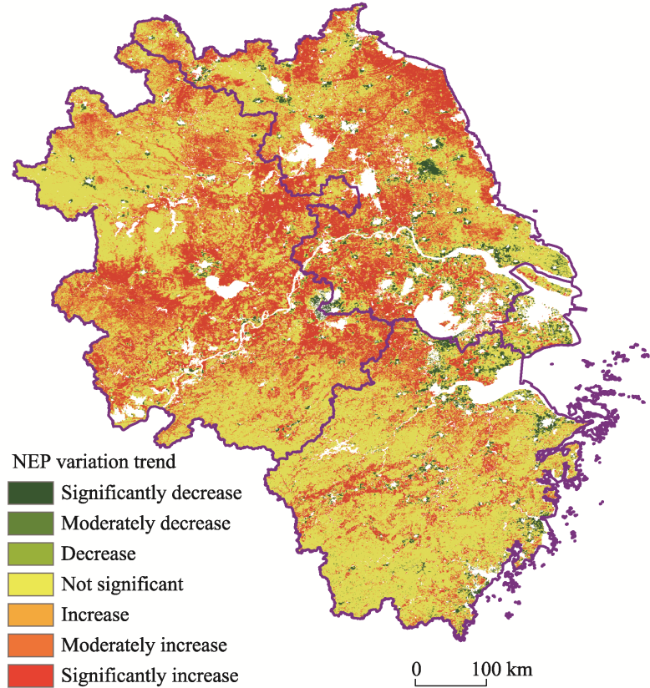
Figure 4 NEP trends in the Yangtze River Delta from 2000 to 2020 |
Table 2 Area share of different NEP trends |
| Slope β | Z | NEP trends | Proportion of change area (%) | |||
|---|---|---|---|---|---|---|
| Shanghai | Jiangsu | Zhejiang | Auhui | |||
| β>0 | 2.58<Z | Significant decrease | 11.40 | 4.24 | 4.00 | 0.91 |
| 1.96<Z≤2.58 | Moderate decrease | 7.25 | 2.02 | 1.86 | 0.64 | |
| 1.65<Z≤1.96 | Decrease | 4.32 | 1.10 | 1.20 | 0.29 | |
| β=0 | Z≤1.65 | Not significant | 54.40 | 38.56 | 65.82 | 45.91 |
| β<0 | 1.65<Z≤1.96 | Increase | 4.32 | 8.37 | 5.94 | 10.81 |
| 1.96<Z≤2.58 | Moderate increase | 7.43 | 18.63 | 9.28 | 18.47 | |
| 2.58<Z | Significant increase | 10.88 | 27.07 | 11.89 | 22.96 | |
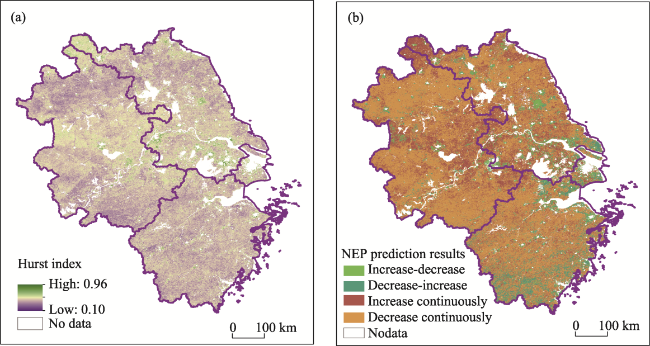
Figure 5 Hurst Index and future trend changes of NEP in the Yangtze River Delta |
Table 3 Area share of the future trend of NEP in the Yangtze River Delta |
| Slope β | H index | Future trends | Proportion of change area (%) | |||
|---|---|---|---|---|---|---|
| Shanghai | Jiangsu | Zhejiang | Auhui | |||
| β>0 | H>0.5 | Continuous increase | 16.58 | 24.56 | 12.21 | 21.34 |
| β<0 | H>0.5 | Increase-decrease | 20.55 | 8.75 | 7.231 | 2.85 |
| β>0 | H<0.5 | Continuous decrease | 30.57 | 58.92 | 58.32 | 71.69 |
| β<0 | H<0.5 | Decrease-increase | 32.30 | 7.77 | 22.24 | 4.12 |
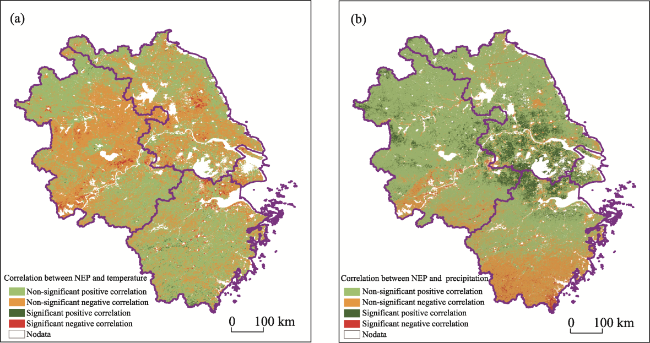
Figure 6 NEP partial correlation with temperature and precipitation of the Yangtze River Delta |
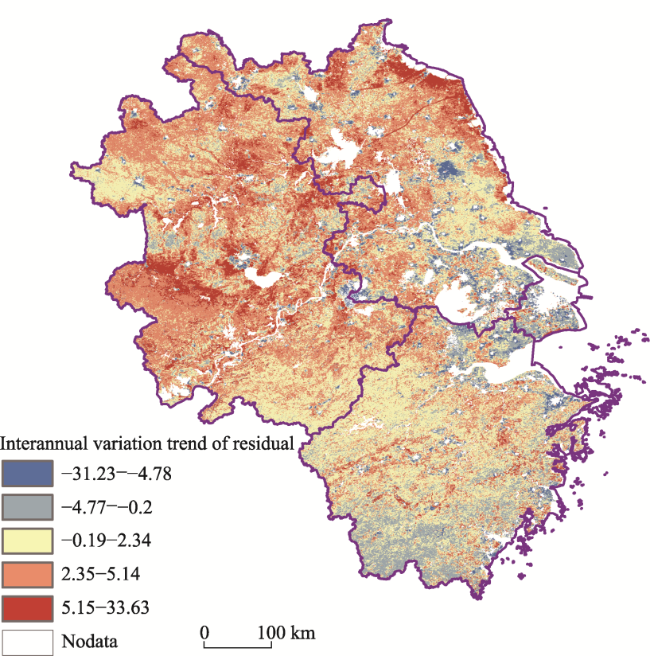
Figure 7 Effects of human activities on NEP in the Yangtze River Delta in 2000-2020 |
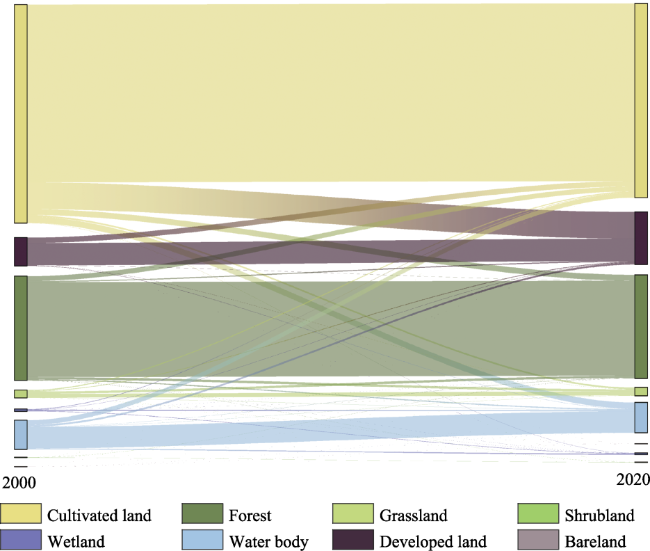
Figure 8 Ecosystem transformation matrix of the Yangtze River Delta in 2000-2020 |
Table 4 Influential proportion of ecosystem-type transformation on NEP (%) |
| 2000 | 2020 | |||||||
|---|---|---|---|---|---|---|---|---|
| Cultivated land | Forest | Grassland | Shrubland | Wetland | Water body | Developed land | Bareland | |
| Cultivated land | 55.72 | 1.83 | 0.43 | 0.01 | 0.04 | 0.40 | 1.12 | 0.00 |
| Forest | 1.51 | 25.72 | 0.71 | 0.04 | 0.01 | 0.14 | 0.04 | 0.00 |
| Grassland | 0.28 | 0.71 | 1.22 | 0.00 | 0.02 | 0.03 | 0.01 | 0.00 |
| Shrubland | 0.00 | 0.05 | 0.00 | 0.05 | 0.00 | 0.00 | 0.00 | 0.00 |
| Wetland | 0.06 | 0.00 | 0.01 | 0.00 | 0.03 | 0.02 | 0.00 | 0.00 |
| Water body | 0.84 | 0.05 | 0.03 | 0.00 | 0.08 | 1.10 | 0.05 | 0.00 |
| Developed land | 1.92 | 0.03 | 0.02 | 0.00 | 0.00 | 0.01 | 5.64 | 0.00 |
| Bareland | 0.00 | 0.00 | 0.00 | 0.00 | 0.00 | 0.00 | 0.00 | 0.01 |
| [1] |
|
| [2] |
|
| [3] |
|
| [4] |
|
| [5] |
|
| [6] |
|
| [7] |
|
| [8] |
|
| [9] |
|
| [10] |
|
| [11] |
|
| [12] |
|
| [13] |
|
| [14] |
|
| [15] |
|
| [16] |
|
| [17] |
|
| [18] |
|
| [19] |
|
| [20] |
|
| [21] |
|
| [22] |
|
| [23] |
|
| [24] |
|
| [25] |
|
| [26] |
|
| [27] |
|
| [28] |
|
| [29] |
|
| [30] |
|
| [31] |
|
| [32] |
|
| [33] |
|
| [34] |
|
| [35] |
|
| [36] |
|
| [37] |
|
| [38] |
|
| [39] |
|
| [40] |
|
| [41] |
|
| [42] |
|
| [43] |
|
| [44] |
|
| [45] |
|
| [46] |
|
| [47] |
|
| [48] |
|
| [49] |
|
| [50] |
|
| [51] |
|
/
| 〈 |
|
〉 |