Research Articles

Road network expansion and its impact on landscape patterns in the Dongzhi tableland of the Chinese Loess Plateau

  • YANG Siqi , 1, 2 ,
  • JIN Zhao , 1, 3, 5, * ,
  • LUO Da 1, 4 ,
  • FENG Li 5
Expand
  • 1. State Key Laboratory of Loess and Quaternary Geology, Institute of Earth Environment, CAS, Xi’an 710061, China
  • 2. State Key Laboratory of Earth Surface Processes and Resource Ecology, Faculty of Geographical Science, Beijing Normal University, Beijing 100875, China
  • 3. CAS Center for Excellence in Quaternary Science and Global Change, Xi’an 710061, China
  • 4. University of Chinese Academy of Sciences, Beijing 100049, China
  • 5. Institute of Global Environmental Change, Xi’an Jiaotong University, Xi’an 710049, China
* Jin Zhao, Professor, E-mail:

Yang Siqi, PhD Candidate, specialized in earth surface processes. E-mail:

Received date: 2022-10-24

  Accepted date: 2023-07-19

  Online published: 2023-12-14

Supported by

National Natural Science Foundation of China(41790444)

Strategic Priority Research Program of Chinese Academy of Sciences(XDB40000000)

National Key Research and Development Program(2018YFC1504701)

Abstract

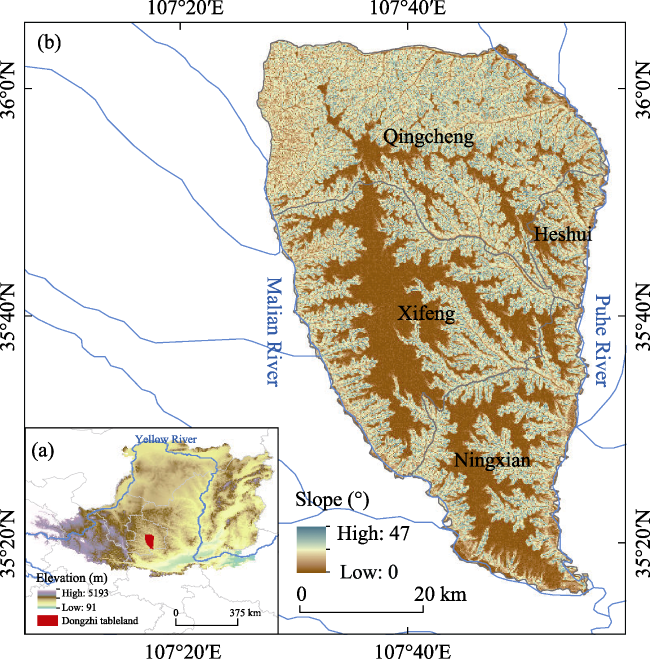
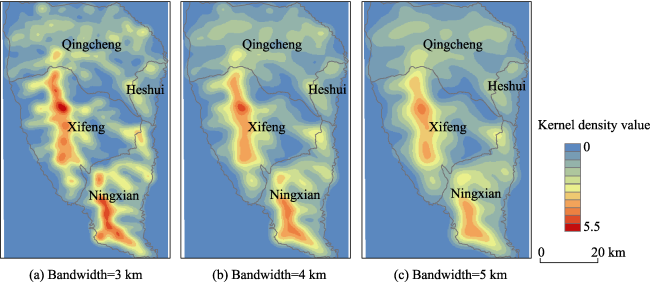
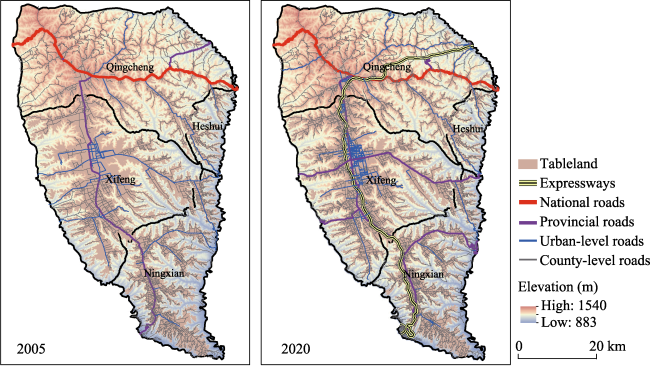
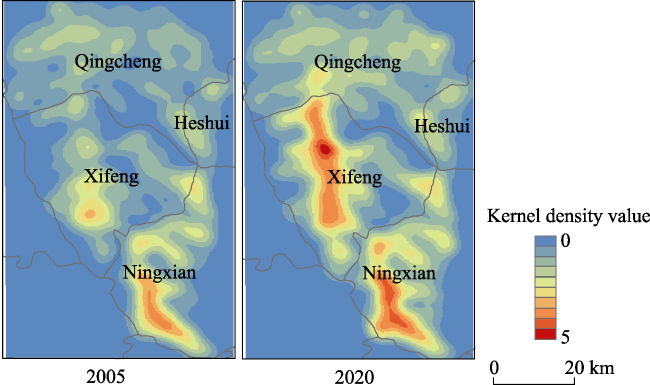
Road network expansion can result in the fragmentation of ecological landscapes due to the transformation of landscape processes and patterns. However, knowledge about these processes and patterns is scarce. In this study, the road network and landscape patterns in the Dongzhi tableland of the Chinese Loess Plateau (CLP) between 2005 and 2020 were characterized, and their spatial relationships were analyzed. The results showed that (1) the kernel density estimation (KDE) method is useful in characterizing road network density. When the bandwidth value is four, the boundary of the road network kernel can be distinguished clearly. (2) The road network in the tableland expanded greatly over the past 15 years, and the total area of road kernels in the Dongzhi tableland increased from 55.73 km2 in 2005 to 223.55 km2 in 2020. (3) High-density road networks were generally distributed on cultivated and constructed lands where the slopes were generally 0°-5°, while low- and medium-density road networks were mostly distributed in grassland areas where the slopes were greater than 5°. (4) Road network density is closely related to the coverage of cultivated and constructed lands. The results of this study are helpful in understanding the potential impact of road network evolution on the landscape at a regional scale.

Cite this article

YANG Siqi , JIN Zhao , LUO Da , FENG Li . Road network expansion and its impact on landscape patterns in the Dongzhi tableland of the Chinese Loess Plateau[J]. Journal of Geographical Sciences, 2023 , 33(12) : 2549 -2566 . DOI: 10.1007/s11442-023-2189-4

1 Introduction

A road network refers to a system with specific spatial characteristics that are closely related to human activities and can be observed within a certain distance along the landscape (Forman and Alexander, 1998). Road networks can create “effect zones” along roads, where environmental characteristics differ substantially from the control location (Müller et al., 2010; Kleinschroth et al., 2019). With the expansion of road network areas, the range of human activities has also expanded, increasing the impact of human beings on landscape patterns and ecosystem stability (Karlson and Mörtberg, 2015; Ganin et al., 2017). Previous studies have demonstrated that approximately 15%-20% of the land surface in the United States of America is affected by road construction (Forman and Deblinger, 2000). In China, the areas influenced by road networks account for 18% of the total land surface (Li, 2004). Moreover, nearly 25 million kilometres of roads are projected globally by the year 2050, and developing nations are expected to contribute approximately 90% of road construction (Laurance et al., 2014). Road construction and growth induce landscape fragmentation and accelerate soil erosion and surface hydrologic change, eventually increasing extinction risk (Li and Zhou, 2015; Mauri et al., 2022).
Road ecology is the interaction among roads, traffic, and the surrounding environment (Bennett, 2017). Therefore, it embraces several fields of research, including wildlife-vehicle collisions, changes in animal behaviour such as road avoidance, landscape connectivity, fragmentation, barrier effects, pathways for biological invasions, and pollution (Trombulak and Frissell, 2000; Ren et al., 2019). Studies of the interaction of road network expansion and landscape pattern changes have boomed since the 1990s (Wang et al., 2007). Currently, research on the impact of roads on forest landscapes is maturing, but there are few studies on the impact of transportation network development on land use change and potential ecological risks (Song and Zhou, 2017). In China, the rapid development of the economy has led to the noticeable expansion of road networks, which will damage the natural landscape and ecosystem to some extent, especially changing the patterns of large-scale landscapes (Li et al., 2005). However, knowledge of the interactions between road network expansion and landscape fragmentation and potential ecological risks is limited.
Since the end of the 20th century, geographic information systems (GIS) and remote sensing (RS) have been widely used in spatial analysis (Terzi and Bolen, 2009). For example, various GIS-based spatial analysis methods are used to characterize the relationships between transportation development and environmental impacts. Kernel density estimation (KDE) was proposed early to describe the spatial distribution of the density of a particular flux or the impact of a process across space among these methods (Rosenblatt, 1956; Silverman, 1988). Common tools, such as ArcGIS, have point density analyses that provide a quantitative value and visual display capability that shows the concentration of points. For line density, the concentration of linear features in a neighbourhood is used, similar to points. Compared with point and kernel density measures, kernel density estimation can prevent problems related to the arbitrary choice of the grid and obtain a smoothly curved surface that is fitted over each point or linear element (Lin et al., 2020). In recent years, this method has been used to characterize the spatial structure and impact of road construction (Borruso, 2003; Xie and Yan, 2008; Liu et al., 2011; Cai et al., 2013). By applying a 2-dimensional distance attenuation model for the samples, KDE can describe the spatial patterns of density changes both along and perpendicular to a line (e.g., road, river) (Ying, 2014).
The Chinese Loess Plateau (CLP) is a unique geographical area in China that has an extensive and loose loess distribution, as well as complex topography, intensive summer monsoon rainfall, and strong anthropogenic disturbances (Fu and Gulinck, 1994; Xiong et al., 2014). The hydrogeomorphologic characteristics of the CLP make it the most severe area of soil erosion in the world (Liu, 1985). The Dongzhi tableland is the largest tableland on the CLP (Jin et al., 2023). Due to the influence of strong human activity and substantial gully erosion, the plateau surface of the Dongzhi tableland has suffered severe soil and water losses (Yao, 2009; Che, 2012; Yan, 2014). It is estimated that the erosion-affected area occupies approximately 96% of the area of the plateau surface (Yan, 2014). Since 2000, urbanization and road construction on the Dongzhi tableland has been booming with the initiation of the national policy of China’s Western Development Program (Meng, 2013). The construction of roads and urban areas notably increased overland runoff and exacerbated soil erosion on the plateau’s surface (Jin et al., 2023). However, the impact of road network expansion on landscape patterns in tablelands has been inadequately addressed, which limits our understanding of the potential impact of road construction and the resulting landscape fragmentation on ecological risk at the regional scale. Thus, quantitative characterization of road network expansion and its latent influence can provide useful information for road construction and ecosystem management.
In this study, road network density in the Dongzhi tableland was quantified using the KDE method. Meanwhile, landscape metrics were calculated, and these landscape indices and kernel density were spatialized. Finally, the relationship between road networks and landscape indices was characterized. The objective of this study was to (1) quantify the spatial characteristics of road network expansion and landscape fragmentation changes in the Dongzhi tableland between 2005 and 2020; and (2) analyze the patterns of landscape fragmentation changes caused by road network expansion. This study can assist in understanding the potential influence of road network evolution on landscape risks at the regional scale and proffer a theoretical basis for the rational protection of the CLP and other similar areas on Earth.

2 Materials and methods

2.1 Study region

The Dongzhi tableland (34°50′-37°19′N, 106°14′-108°42′E) lies in Qingyang city, Gansu province, China, with an area of 910 km2 and a slope of 0°-5° in the southern part of the CLP (Figure 1). The loess thickness in the Dongzhi tableland ranges from 100 m to 300 m (Zhu et al., 2018) and consists of aeolian dust deposition during the Quaternary era (Edward et al., 1995). The average elevation of the Dongzhi tableland is approximately 1450 m and inclines from the northeast to the southwest. The area has a typical Forman continental monsoon climate, with 80%-90% of annual precipitation occurring between June and September. The annual precipitation is 450-600 mm, and the annual evaporation is 1000-3000 mm. The slopes ranging from 0° to 5° are concentrated in the center of the tableland (Figure 1b). The Dongzhi tableland is now facing the threat of severe gully erosion due to rapid urbanization.
Figure 1 Location of the Dongzhi tableland in the Chinese Loess Plateau (CLP) (a. Digital elevation model of the CLP; b. The slope of the Dongzhi tableland)

2.2 Data sources and preprocessing

2.2.1 Road network data and preprocessing

The road network data of the Dongzhi tableland in 2005 were provided by the Soil and Water Conservation Bureau of Qingyang City, Gansu Province. The road network data in 2020 were obtained from Google Earth images in 2020 (2 m resolution) based on OpenStreetMap (OSM) data, which were downloaded from the 91 satellite map database (Beijing Qianfan Shijing Technology Co., Ltd). However, the OSM data included much redundant information and lacked the latest road data, so we removed redundant data and added new road information by overlaying Google images from 2020. Then, the vector data of the road network were grouped into five functional classes: expressways, national roads, provincial roads, urban-level roads, and county-level roads. All images were treated based on the WGS-1984 coordinate system.

2.2.2 Land use and land cover data

The land use and land cover (LULC) vector data of the Dongzhi tableland in 2005 were provided by the Soil and Water Conservation Bureau of Qingyang City, Gansu Province. The LULC data for 2020 were downloaded from Globeland 30 (http://www.globallandcover.com). The LULC data were extracted from the Landsat Operational Land Imager (OLI) using the Google Earth Engine. The data were used in related landscape pattern studies, with a total accuracy of 85.72% and a Kappa coefficient greater than 0.82 (Zhang et al., 2021). Referencing the current land use classification (GBT21010-2017) and national remote sensing of LULC classification, the whole study area is categorized into six categories: construction land, cultivated land, woodland, waterbody, grassland, and unused land.

2.3 Research methods

2.3.1 Kernel density analysis

In this study, the kernel density estimation was superimposed onto the road networks. According to the KDE method, the density of points or lines is calculated through shifting windows provided by the Spatial Analyst module of GIS software (Ying, 2014). x1xn is a random sample taken from a continuous, univariate density f (Parzen, 1962; Rosenblatt, 1956)
$~{{f}_{n}}\left( x \right)=\frac{1}{nh}\underset{i=1}{\overset{n}{\mathop \sum }}\,k\left( \frac{x-{{x}_{i}}}{h} \right)~~~~$
where the function k() refers to the kernel; h is the bandwidth (larger than 0); x - xi is the distance from x to xi; and n is the total number of samples.
In the calculation of kernel density, the identification and selection of the bandwidth of the kernel function is crucial in density estimation. With the increase in the value of $h$, the change in the estimation of grid density in the space is smoother, which will cover up the structure of the kernel density. When the bandwidth decreases, the change in the point density becomes uneven. In the specific application, the value of bandwidth is elastic and needs to be carried out according to different values to explore the smooth degree of the estimated point density surface (Mo et al., 2017). The KDE analysis could generate a default bandwidth automatically in ArcGIS, and the default value is computed specifically to the input dataset using a spatial variant of Silverman’s Rule of Thumb that is robust to spatial outliers. In this study, we took the default-generated 4 km bandwidth and compared it with 3 km and 5 km bandwidths (Figure 2). When the bandwidth value was 4 km, the boundary of the road network kernel could be distinguished clearly, and the differences in kernel density grades could be discerned. The road density value estimated by KDE was continuous. The density value can be grouped into four grades with an interval of 1 km/km2, and the extremely high-density road network was defined as the main kernel.
Figure 2 Density of road networks with bandwidths of 3 km (a), 4 km (b), and 5 km (c) on the Dongzhi tableland in 2020

2.3.2 Construction of landscape pattern indices

There are many indicators that can be used to analyze regional landscape patterns, mostly expressed by scale, density, shape, aggregation, diversity, and connectivity (Xie et al., 2016). These factors are sufficient to reflect the temporal and spatial changes in land use type at the class and landscape levels (Song and Zhou, 2017). In this study, we converted the LULC data in 2005 from vector to grid format and calculated the landscape indices on the Dongzhi tableland in 2005 and 2020 with FRAGSTATS 4.2 software. Moreover, to quantify the spatial pattern of the landscape and its relationship with road network kernel density, three metrics were selected in this study, including the largest patch index (LPI), patch density (PD), and aggregation index (AI) (Table 1), which could reflect their conceptual basis and reduce correlation and redundancy.
Table 1 Landscape index and ecological implications
Justification Name (abbreviation) Description Unit
Dominance index largest patch index (LPI) It can be used to determine the dominant type of landscape and reflect the direction and strength of human activities. %
Fragmentation index patch density (PD) The number of patches per 100 ha. With a higher value, the landscape fragmentation and spatial heterogeneity are greater. n/100 ha
Aggregation index Aggregation index (AI) Aggregation degree indicates the degree of aggregation among landscape patches. With a higher value, the aggregation is larger. %

Note: For details, refer to McGarigal et al. (2012).

2.3.3 Correlation analysis

The Pearson correlation coefficient was used to explore the relationship between road density and landscape index a. The specific formula is as follows:
${{\rho }_{\left( x,y \right)}}=\frac{cov\left( x,y \right)}{{{\delta }_{x}}\times {{\delta }_{x}}}$
where ρ(x, y) refers to the correlation coefficient between x and y; cov(x, y) refers to the covariance between x and y; and δx and δy represent the standard deviation of x and y, respectively.
To match the spatial data of the road kernel density values and landscape indices, the FishNet tool of ArcGIS was used to divide the study area into 702 square grids of 2 km × 2 km, and then the Spearman rank correlation coefficient was analyzed by SPSS 22.

3 Results

3.1 Spatial distribution and changes in road density

Road maps of the Dongzhi tableland in 2005 and 2020 showed that most of the roads were distributed on flat plateau surfaces with slopes of 0°-5°. The road density increased significantly from 2005 to 2020 (Figure 3). In 2005, the total road length on the Dongzhi tableland was approximately 3095 km, with a density of 1.09 km/km2. The county-level roads showed the highest density (0.93 km/km2) among the five types of roads. In 2020, the total length of roads on the Dongzhi tableland was approximately 4274 km, with a density of 1.51 km/km2. The county-level roads also showed the highest density among the five types of roads with a total of 1.24 km/km2. During the past 15 years, the total length of roads on the Dongzhi tableland increased by 38.1%, and the annual growth rates of the five types of roads were 7.29 km/a for expressways, 0 km/a for national roads, 5.95 km/a for provincial roads, 6.45 km/a for urban-level roads and 58.86 km/a for county-level roads (Table 2).
Figure 3 Road maps of Dongzhi tableland in 2005 (a) and 2020 (b)
Table 2 The lengths of different types of roads on the Dongzhi tableland between 2005 and 2020
Road level Length of road network (km) Road density (D, km/km2) Road expansion (km) Annual growth rate
(AR, km/a)
2005 2020 2005 2020
Expressways 0 109.41 0 0.039 109.41 7.29
National roads 66.31 66.31 0.023 0.023 0.00 0
Provincial roads 89.46 178.77 0.032 0.063 89.31 5.95
Urban-level roads 307.65 404.42 0.108 0.142 96.76 6.45
County-level roads 2631.68 3514.61 0.927 1.238 882.93 58.86
Total 3095.11 4273.52 1.090 1.505 1178.41 78.56
For the density mapping, the KDE results demonstrated that the road kernel density of the Dongzhi tableland significantly increased from 2005 to 2020. The geometrical shape of the kernel density distribution showed a concentrated line, with the highest density spread occurring along the flat plateau surface of the tableland (Figure 4). In 2005, the downtown areas of Ningxian, Xifeng, and Qingcheng counties showed the highest kernel density. In 2020, the regions with a high kernel density of roads greatly expanded and spread around the former areas, indicating that the road network on the Dongzhi tableland had rapidly expanded during the past 15 years. Xifeng district exhibited fast road kernel development, while Qingcheng and Heshui counties showed only a small enhancement in the road network in their suburban regions. In 2005, the low-density road network accounted for 54.28% of the total area, and the extremely high-density road network accounted for only 1.98% of the total area. In 2020, the area ratio of medium-density areas showed the largest proportion, accounting for 44.96% of the total area, and the area ratio of extremely high-density areas increased to 7.88% (Table 3).
Figure 4 Road kernel density changes on the Dongzhi tableland between 2005 and 2020
Table 3 Changes in the proportion of different road density grades on the Dongzhi tableland from 2005 to 2020
Kernels Kernel density
grade
Kernel density value
(km/km2)
Area proportion (%)
2005 2020
Sub-kernels Low 0<Kernel density<1 54.28 34.34
Medium 1≤Kernel density<2 36.78 44.96
High 2≤Kernel density<3 6.96 12.82
Main kernels Extremely high 3≤Kernel density 1.98 7.88

3.2 Spatial and temporal changes in landscape patterns

The observed land use changes showed that the main land use types on the Dongzhi tableland were grassland and cultivated land in 2005 and 2020, and the area of constructed land had increased greatly by 82.24 km2 over the 15-year period (Figure 5). Land use transformation analysis showed that 5.34% of the cultivated land and 6.97% of the grassland had been converted to construction land from 2005 to 2020 (Figure 6). According to the change in landscape indices on the Dongzhi tableland from 2005 to 2020, the landscape indices of LPI, PD, and AI decreased from 28.28, 7.06, and 90.6 to 21.55, 6.95, and 90.4, respectively (Table 4). These ecological factors decreased from 2005 to 2020 in almost all the counties, except the PD value in Xifeng district, which increased by 2.47. This indicated that the landscape pattern of Xifeng district had been continuously segmented and broken and showed strong landscape heterogeneity in spatial form. Meanwhile, landscape analysis demonstrated that different land use types had different landscape metrics (Table 5). For the land use type of cultivated land, the area decreased by 2.64%, and the landscape metrics of LPI, PD, and AI synchronously decreased by 6.73, 0.05, and 0.5, respectively. Contrary to the cultivated land area, the area of constructed land increased by 2.9%, which resulted in the landscape metrics of LPI, PD, and AI increasing by 0.69, 0.06, and 0.27, respectively. However, there was no significant change in the landscape metrics of other land use types between 2005 and 2020.
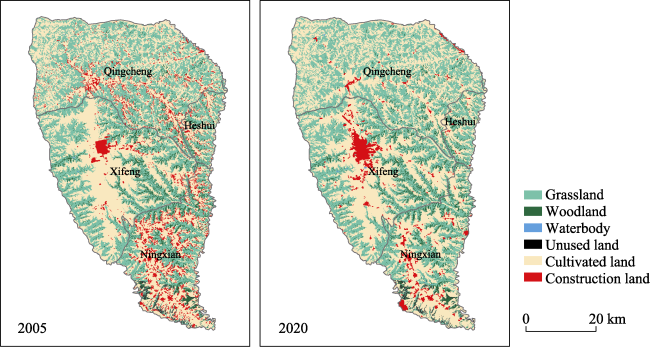
Figure 5 Land use change in the Dongzhi tableland between 2005 (a) and 2020 (b)
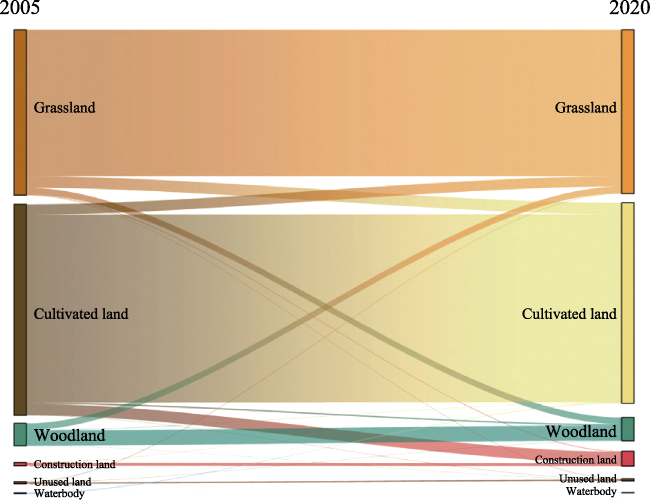
Figure 6 Changes between different land use types in 2005-2020
Table 4 Changes in landscape indices on the Dongzhi tableland from 2005 to 2020
Region LPI (%) PD (n/100ha) AI (%)
2005 2020 2005 2020 2005 2020
Qingcheng 31.34 29.72 5.22 5.15 90.64 90.59
Xifeng 49.77 46.83 6.79 9.26 91.51 85.94
Heshui 45.11 41.77 10.03 9.76 89.58 89.25
Ningxian 20.63 20.29 11.62 11.41 88.15 88.06
Total 28.28 21.55 7.06 6.95 90.6 90.4
Table 5 Changes in landscape metrics of different land use types on the Dongzhi tableland from 2005 to 2020
Landscape types Year Landscape metrics Area proportion (% land)
LPI PD AI
Cultivated land 2005 28.28 0.26 94.51 52.10
2020 21.55 0.21 94.01 49.46
Woodland 2005 0.10 4.75 66.35 5.58
2020 0.10 4.74 66.31 5.70
Grassland 2005 7.84 1.65 89.41 40.80
2020 7.81 1.62 89.40 40.40
Unused land 2005 0.04 0.29 68.96 0.52
2020 0.04 0.28 69.34 0.53
Waterbody 2005 0.01 0.08 62.01 0.20
2020 0.01 0.01 62.37 0.21
Construction land 2005 0.39 0.03 93.31 0.80
2020 1.08 0.09 93.58 3.70

3.3 Relationships between road network expansion and changes in landscape patterns

The area proportion of different land use types exhibiting different degrees of road kernel density in 2005 and 2020 showed that the low- and medium-density road network classes were mostly distributed in grassland, while the high-density road network class was mainly distributed in cultivated land (Figure 7). Over the past 15 years, the proportion of constructed land characterized by the extremely high-density class significantly increased in area by 21.85%. The spatial variations in road kernel density and landscape metrics showed that the landscape patterns on the Dongzhi tableland were greatly affected by the expansion of the road network. The results demonstrated that the road network kernel density was positively and significantly correlated with LPI and AI (p < 0.01) but negatively correlated with PD (p < 0.01). Meanwhile, the correlation coefficients between road density and landscape metrics increased from 2005 to 2020 (Table 6).
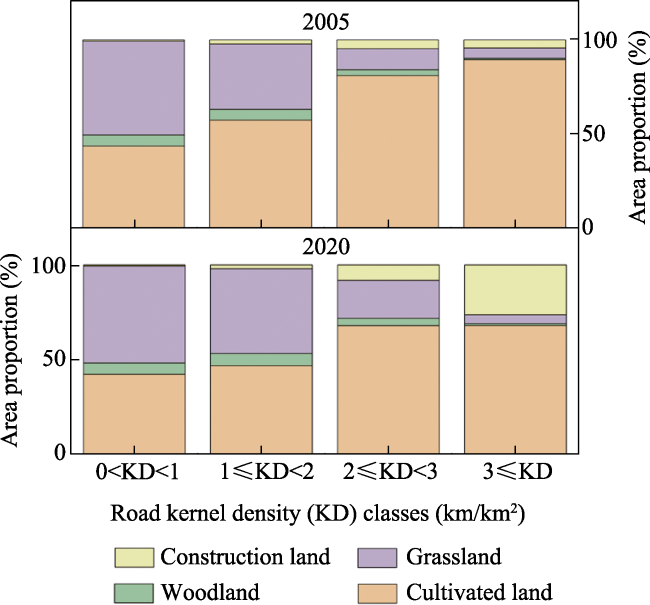
Figure 7 Area proportion of different land use types in different degrees of road kernel density in 2005 and 2020
Table 6 Correlation of landscape indices with road density
Correlation coefficient Year LPI PD AI
Road density and landscape index 2005 0.394** -0.360** 0.315**
2020 0.467** -0.463** 0.394**

Note: ** p < 0.01.

4 Discussion

4.1 The evolution of landscape ecology and road density on the Dongzhi tableland

The Dongzhi tableland is the main agricultural area on the CLP. In the area, cultivated land is the primary type of land use (Figure 5). Taking the edge line of the tableland as the boundary, the cultivated land and constructed land were mainly distributed across the flat terrain, with slopes ranging from 0° to 5°, while the grassland and woodland areas were mostly distributed in areas with slopes greater than 5°. Due to rapid urbanization, the area of cultivated land has decreased by 2.64% over the past 15 years on the Dongzhi tableland. The landscape metrics of the cultivated land, e.g., LPI, PD, and AI, also decreased, which indicated that the cultivated land had become more fragmented. As the cultivated land was mainly converted to constructed land, the aggregation degree of constructed land and the associated landscape metrics (LPI, PD, and AI) increased.
For the road kernel density analysis, old kernels were mainly distributed in Xifeng district and Ningxian county in 2005. New kernels extended along the old kernel in Xifeng, and a new kernel occurred in Ningxian. Over the past 15 years, the number of main kernels increased from 2 to 3. Meanwhile, the total area of the main kernels on the Dongzhi tableland increased from 55.73 km2 in 2005 to 223.55 km2 in 2020, representing a 4-fold increase. In Xifeng, there is one main kernel, and that number did not change between 2005 and 2020, while the kernel area greatly expanded from 3.66 to 134.83 km2, representing a 36.9-fold increase (Figure 8). Moreover, road networks were mostly distributed throughout areas with slopes between 0° and 5°, while the low and medium densities of road networks were mostly distributed in grassland areas with slopes greater than 5°. This phenomenon is similar to previous findings. Fischer (2018) found that road networks with high density were generally distributed in plain areas with a large population, while the road network in steep terrain tended to be branched and had low density. In this study, it was determined that road network expansion has a close relationship with urban development. For example, the proportion of constructed land with an extremely high density of road networks had increased by 21.85% over the past 15 years (Figure 9). Moreover, Nyssen et al. (2002) noted that road developers generally avoid toe slopes to reduce the cost of bridge construction, but there were implicit costs accompanied by gullying in slope land and pediments, such as soil erosion.
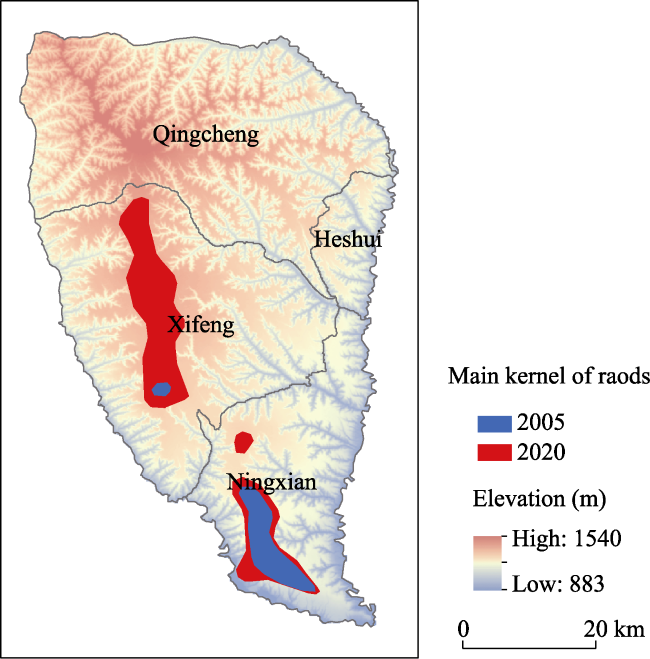
Figure 8 The spatial expansion patterns of the main road network kernel (KD value above 2 km/km2) on the Dongzhi tableland between 2005 and 2020
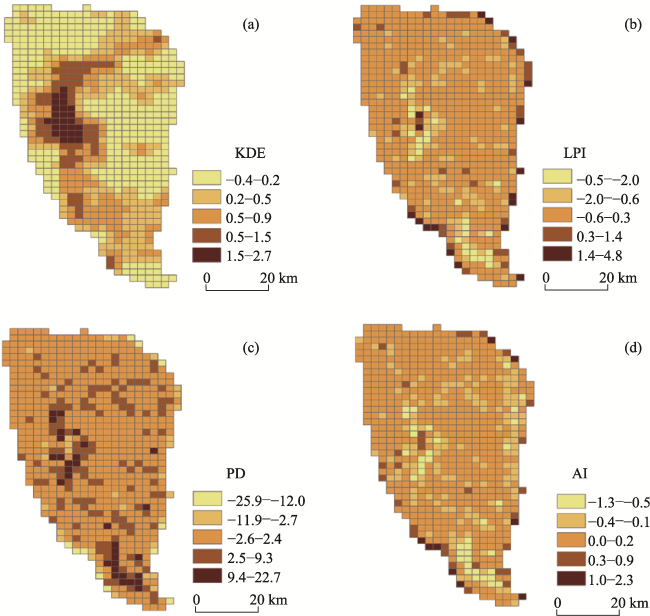
Figure 9 Spatial changes in road kernel density (a) and main landscape metrics (b-d) on the Dongzhi tableland between 2005 and 2020

4.2 Effects of road network expansion on landscape pattern changes

As a precedent and superseding infrastructural requirement for urban growth, road construction would result in substantial landscape changes (Liu et al., 2008). Mann et al. (2021) demonstrated that there were significant relationships between road networks, landscape ecological risks, and topographic factors. In this study, we found similar results to those of Mann et al. (2021). On the Dongzhi tableland, the kernel density and landscape metric changes were concentrated in the flat area from 2005 to 2020, and the road kernel density exhibited significant relationships with the landscape metrics (Figure 9).
With the expansion of the road network, we found that the tableland area was rapidly shrinking. The Dongzhi tableland was reduced by a total of 83.14 km2 between 1972 and 2020. In 1972-2005, the average rate of tableland retreat was 0.92 km2/a, and the retreat rate increased to 3.5 km2/a from 2005 to 2020 (Jin et al., 2023). In our previous study, we found that there was a significantly positive relationship between gully expansion and urban area development (Yang et al., 2020). Although the study only characterized a typical gully near the urban area of the Xifeng on the Dongzhi tableland, it may reflect that urbanization has a strong impact on gully expansion and tableland retreat. In this study, we can conclude that such significant tableland retreat is probably related to the rapid expansion of road networks and urban construction in the area, which can decrease rainfall infiltration, increase surface runoff and consequently exacerbate headward erosion and gully expansion. Furthermore, cultivated and constructed land had a stronger impact on road kernel density than other landscape types because the high-density road network was mostly distributed in the cultivated and constructed lands. The two land use types exhibited high degrees of aggregation. Thus, the road kernel density was positively and significantly correlated with the landscape index of the AI (p < 0.01). The urban areas are generally concentrated in the tableland, and their fragmentation degrees are low because they have fewer patches. In contrast, forestland and grassland are located far away from urban areas and are easily affected by terrain conditions (Mo et al., 2017). Therefore, the fragmentation degrees of forestland and grassland are high because they have more patches. Although road network expansion is often reported to induce landscape fragmentation, road networks could also allow construction land to continually expand (Cai et al., 2013). Thus, although the number of construction land patches is small, its area is large, which consequently leads to a relationship between PD enhancement and road kernel density reduction.

4.3 Potential impact of landscape pattern changes on gully erosion

Road construction can permanently alter the geomorphic and hydrological settings of the landscape and elevate the potential risk of soil erosion. Previous studies have demonstrated that road construction is an important factor in accelerating gully erosion (Ziegler and Giambelluca, 1997; Kakembo, 2000; Zhang et al., 2009). Nyssen et al. (2002) showed that a 6.5 km long road segment had formed 16 new gullies and caused five small gullies to become inactive. Moreover, the road kernel density was negatively correlated with the gully kernel density. For a clearer interpretation, the gully distribution along a national road of 66.31 km was analyzed on the Dongzhi tableland (Figure 10a). A buffer analysis was conducted, and the threshold value was set to 500 m. We found that 130 gullies were located in the buffering area and that the gully density was 1.02 km/km2. In the buffering area, the gully distribution is stable, and the degree of crushing is severe (Figure 10b). Although remote sensing images cannot identify the area change in specific gullies between 2005 and 2020 on the Dongzhi tableland, the area of the Dongzhi tableland decreased from 990.63 km2 in 1972 to 960.08 km2 in 2005 due to gully erosion. With the acceleration of headward erosion and bank collapse, the tableland further retreated, and the area decreased to 907.49 km2 in 2020. In total, the area of the Dongzhi tableland shrank by 83.14 km2 between 1972 and 2020, which was 30.55 km2 in 1972-2005 and 52.59 km2 in 2005-2020 (Jin et al., 2023). Through an investigation of soil erosion control practices on the Dongzhi tableland, it can be observed that the use of culverts is the main drainage method; these culverts receive runoff along the road and channels the water into the gully, which could greatly increase the speed of gravitational erosion and cause landslides (Figure 10c). Thus, appropriate facility designs should be established to avoid new gully formation and development during road design and building processes. At present, there are four kinds of gully consolidation and tableland protection modes on the CLP: (1) simple backfill of the gully head; (2) backfill of the gully head associated with drainage facilities; (3) backfill of the gully head combined with drainage facilities and slope protection; and (4) backfill of the gully head combined with drainage facilities and ecological slope protection, among which the fourth mode is the most effective in tableland protection and gully erosion control (Wang et al., 2019).
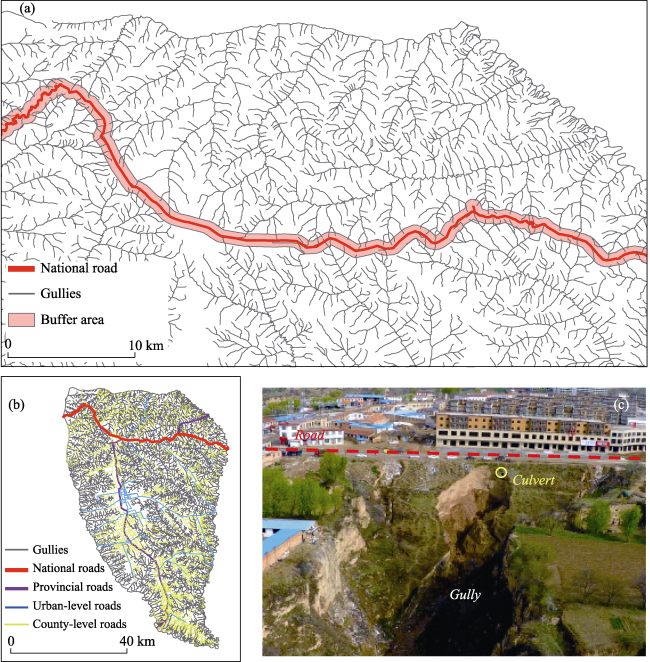
Figure 10 The gully distribution along a national road on the Dongzhi tableland (a. Gully distribution along the national road in 2005; b. Gully and road network map; c. Drainage culvert in the road)

4.4 Limitations and outlook

This study is valuable for road network construction and ecosystem management, and the kernel density method can provide a basis for exploring the relationship between road network expansion and landscape change. However, the complexity of road network expansion and its impacts on regional landscape patterns and risks are diverse (Barandica et al., 2014; Staab et al., 2015). Studies on road network structure include either a single main road or a complex road network. Thus, more methods should be explored to assess the complex relationships between roads and landscape ecology (Gong et al., 2021). Many studies have demonstrated that unpaved rural roads can facilitate hydrological connectivity, pollutant mobility, and sediment transport in the drainage network and may impact water quality in streams and reservoirs (Mamede et al., 2018), as well as damage ecosystem health (Wemple et al., 2018). Meanwhile, road construction, building activity, and unreasonable land use accelerate soil erosion and consequently lead to land degradation (Song et al., 2018; Kuklina et al., 2021; Mauri et al., 2022). Thus, it is necessary to analyze the relationships between unpaved rural roads and soil erosion sensitivity on the Dongzhi tableland in the future. Moreover, since the late 1980s, the Dongzhi tableland has experienced dramatic land use and land cover changes due to rapid urbanization and ecological project initiation (Cai et al., 2019; Song et al., 2020). This study only analyzed the road network and land use change between 2005 and 2020 due to limited source data. More time samples should be used to study the road network evolution and regional ecological risk in the tableland area.

5 Conclusions

In this study, the kernel density estimation was used to calculate the road density and analyze the temporal and spatial changes in the road kernel area. Meanwhile, the landscape indices on the Dongzhi tableland in 2005 and 2020 were calculated with FRAGSTATS 4.2 software. With this approach, we conducted comparative research on the ecological risk index through spatial interpolation to explore the influence of road network expansion on regional landscape patterns.
(1) Between 2005 and 2020, the road density on the Dongzhi tableland has significantly increased over the past 15 years. High-density road networks were generally distributed throughout cultivated and constructed lands, where the slopes were generally within the range of 0°-5°, while the low- and medium-density road networks were mostly distributed in the grassland, where the slopes were greater than 5°.
(2) The road network kernel density was positively and significantly correlated with LPI and AI (p < 0.01) but negatively correlated with PD (p < 0.01). The landscape ecological risk on the Dongzhi tableland increased with increasing road network density, which aggravated the risk of gully erosion and fragmentation of the tableland.
(3) The density of road networks has a close relationship with the distribution of cultivated and constructed lands, while the density of gully networks has a close relationship with the distribution of grassland and woodland. Such spatial characteristics of roads, landscapes, and gullies can be used to determine the relationship between road network expansion efforts, landscape patterns, and gully network distribution trends.
[1]
Barandica J M, Delgado J A, Berzosa Á et al., 2014. Estimation of CO2 emissions in the life cycle of roads through the disruption and restoration of environmental systems. Ecological Engineering, 71(10): 154-164.

DOI

[2]
Bennett V J, 2017. Effects of road density and pattern on the conservation of species and biodiversity. Current Landscape Ecology Reports, 2(1): 1-11.

DOI

[3]
Borruso G, 2003. Network density and the delimitation of urban areas. Transactions in GIS, 7(2): 177-191.

DOI

[4]
Cai J Y, Zhou Z H, Liu J J et al., 2019. A three-process-based distributed soil erosion model at catchment scale on the Loess Plateau of China. Journal of Hydrology, 578: 124005.

DOI

[5]
Cai X J, Wu Z, Cheng J, 2013. Using kernel density estimation to assess the spatial pattern of road density and its impact on landscape fragmentation. International Journal of Geographical Information Science, 27(2): 222-230.

DOI

[6]
Che X L, 2012. Study of the distribution characteristic and evolution of headward erosion on Dongzhiyuan of loess gully region[D]. Yangling: Northwest A&F University. (in Chinese)

[7]
Edward D, Theo V A, Armelle B, 1995. Modelling the erosional susceptibility of landslide catchments in thick loess. Catena, 25(4): 315-331.

DOI

[8]
Fischer A P, 2018. Forest landscapes as social-ecological systems and implications for management. Landscape and Urban Planning, 177(5): 138-147.

DOI

[9]
Forman R T T, Alexander L E, 1998. Roads and their major ecological effects. Annual Review of Ecology and Systematics, 29(1): 207-231.

DOI

[10]
Forman R T T, Deblinger R D, 2000. The ecological road effect zone of a Massachusetts (U.S.A.) Suburban Highway. Conservation Biology, 14(1): 36-46.

DOI

[11]
Fu B J, Gulinck H, 1994. Land evaluation in an area of severe erosion: The Loess Plateau of China. Land Degradation & Development, 5(1): 33-40.

DOI

[12]
Ganin A A, Kitsak M, Marchese D et al., 2017. Resilience and efficiency in transportation networks. Science Advances, 3(12): e1701079.

DOI

[13]
Gong J, Cao E J, Xie Y C et al., 2021. Integrating ecosystem services and landscape ecological risk into adaptive management: Insights from a western mountain-basin area, China. Journal of Environmental Management, 281(6): 111817.

DOI

[14]
Jin Z, Peng J B, Zhuang J Q et al., 2023. Gully erosion and expansion mechanisms in loess tablelands and the scientific basis of gully consolidation and tableland protection. Science China: Earth Science, 66(2): 821-839.

DOI

[15]
Kakembo V, 2000. Artificial drainage induced erosion: The case of railway culverts on the Kwezaba ridge, near Alice, eastern cape. South African Geographical Journal, 82(3): 149-153.

DOI

[16]
Karlson M, Mörtberg U, 2015. A spatial ecological assessment of fragmentation and disturbance effects of the Swedish road network. Landscape and Urban Planning, 134(1): 53-65.

DOI

[17]
Kleinschroth F, Laporte N, Laurance W F et al., 2019. Road expansion and persistence in forests of the Congo Basin. Nature Sustainability, 2(7): 628-634.

DOI

[18]
Kuklina V, Irina B, Viktor B et al., 2021. Informal road networks and sustainability of Siberian boreal forest landscapes: Case study of the Vershina Khandy taiga. Environmental Research Letters, 16(11): 115001

DOI

[19]
Laurance W F, Clements G R, Sloan S O et al., 2014. A global strategy for road building. Nature, 513(8): 229-232.

DOI

[20]
Li J, Zhou Z X, 2015. Coupled analysis on landscape pattern and hydrological processes in Yanhe watershed of China. Science of The Total Environment, 505C: 927-938.

[21]
Li S C, Xu Y Q, Zhou Q F, 2004. Statistical analysis on the relationship between road network and ecosystem fragmentation in China. Progress in Geography, 23(5): 78-85. (in Chinese)

DOI

[22]
Li S C, Zhou Q F, Wang L, 2005. Road construction and landscape fragmentation in China. Journal of Geographical Sciences, 15(1): 123-128.

DOI

[23]
Lin Y Y, Hu X S, Liu M S, 2020. Spatial paradigms in road networks and their delimitation of urban boundaries based on KDE. International Journal of Geo-information, 9(4): 204-221.

[24]
Liu R, Hu W P, Wang H L, 2011. The road network evolution analysis of Guangzhou-Foshan metropolitan area based on kernel density estimation. International Conference on Computational and Information Sciences, 31(1): 81-86.

[25]
Liu S L, Cui B S, Dong S K, 2008. Evaluating the influence of road networks on landscape and regional ecological risk: A case study in Lancang river valley of southwest China. Ecological Engineering, 34(2): 91-99.

DOI

[26]
Liu T S, 1985. Loess and Environment. Beijing: Science Press. (in Chinese)

[27]
Mamede G L, Guentner A, Medeiros P H A et al., 2018. Modeling the effects of multiple reservoirs on water and sediment dynamics in a semiarid catchment in Brazil. Journal of Hydrologic Engineering, 23(12): 05018020.

DOI

[28]
Mann D, Anees M M, Rankavat S, 2021. Spatio-temporal variations in landscape ecological risk related to road network in the Central Himalaya. Human and Ecological Risk Assessment, 27(2): 289-306.

DOI

[29]
Mauri L, Straffelini E, Tarolli P, 2022. Multi-temporal modeling of road-induced overland flow alterations in a terraced landscape characterized by shallow landslides. International Soil and Water Conservation Research, 10(2): 240-253.

DOI

[30]
McGarigal K, Cushman S A, Ene E, 2012. FRAGSTATS v4: Spatial pattern analysis program for categorical and continuous maps. Computer software program produced by the authors at the University of Massachusetts, Amherst. Retrieved from http://www.umass.edu/landeco/research/fragstats/fragstats.html.

[31]
Meng Y X, 2013. Dong Zhi tableland typical pit settlement research[D]. Xi’an: Xi’an University of Architecture and Technology. (in Chinese)

[32]
Mo W, Wang Y, Zhang Y et al., 2017. Impacts of road network expansion on landscape ecological risk in a megacity, China: A case study of Beijing. Science of The Total Environment, 574(1): 1000-1011.

DOI

[33]
Müller K, Steinmeier C, Küchler M, 2010. Urban growth along motorways in Switzerland. Landscape and Urban Planning, 98(1): 3-12.

DOI

[34]
Nyssen J, Poesen J, Moeyersons J, 2002. Impact of road building on gully erosion risk: A case study from the Northern Ethiopian Highlands. Earth Surface Processes & Landforms, 27(12): 1267-1283.

[35]
Parzen E, 1962. On estimation of a probability density function and mode. Annals of Mathematical Statistics, 33(3): 1065-1076.

DOI

[36]
Rosenblatt M, 1956. Remarks on some nonparametric estimates of a density function. Annals of Mathematical Statistics, 27(3): 832-837.

DOI

[37]
Silverman B W, 1986. Density Estimation for Statistics and Data Analysis. New York: Chapman & Hall, 175.

[38]
Song B J, Zhou Z X, 2017. Influence of road network on landscape pattern in Xi’an metropolitan zone. Journal of Jilin University (Earth Science Edition), 47(5): 1521-1532. (in Chinese)

[39]
Song X P, Hansen M C, Stehman S V et al., 2018. Global land change from 1982 to 2016. Nature, 560(8): 639-643.

DOI

[40]
Song Y Y, Xue D Q, Dai L H et al., 2020. Land cover change and eco-environmental quality response of different geomorphic units on the Chinese Loess Plateau. Journal of Arid Land, 12(1): 29-43.

DOI

[41]
Staab K, Yannelli F A, Lang M et al., 2015. Bioengineering effectiveness of seed mixtures for road verges: Functional composition as a predictor of grassland diversity and invasion resistance. Ecological Engineering, 84(11): 104-112.

DOI

[42]
Terzi F, Bolen F, 2009. Urban sprawl measurement of Istanbul. European Planning Studies, 17(10): 1559-1570.

DOI

[43]
Trombulak S C, Frissell C A, 2000. Review of ecological effects of roads on terrestrial and aquatic communities. Conservation Biology, 14(1): 18-30.

DOI

[44]
Wang X F, Huo A D, Zhu X H et al., 2019. Study on governance mode of gully consolidation and highland protection project in East Gansu. Yellow River, 41(9): 106-109. (in Chinese)

[45]
Wang Z S, Zeng H, Wei J B, 2007. Some landscape ecological issues in road ecology. Chinese Journal of Ecology, 26(10): 1665-1670. (in Chinese)

[46]
Wemple B C, Browning T, Ziegler A D et al., 2018. Ecohydrological disturbances associated with roads: Current knowledge, research needs, and management concerns with reference to the tropics. Ecohydrology, 11: e1881.

[47]
Xie Y, Gong J, Sun P, 2016. Impacts of major vehicular roads on urban landscape and urban growth in an arid region: A case study of Jiuquan city in Gansu province, China. Journal of Arid Environments, 127(4): 235-244.

DOI

[48]
Xie Z X, Yan J, 2008. Kernel density estimation of traffic accidents in a network space. Computers Environment & Urban Systems, 32(5): 396-406.

[49]
Xiong L Y, Tang G A, Li F Y, 2014. Modeling the evolution of loess-covered landforms in the Loess Plateau of China using a DEM of underground bedrock surface. Geomorphology, 209(15): 18-26.

DOI

[50]
Yan H Z, Feng Q, Cui F, 2014. A Plan for Gully Consolidation and Tableland Protection (GCTP) in Qingyang City (2015-2020). (in Chinese)

[51]
Yang R, Xu Q, Xu X F. et al., 2019. Rural settlement spatial patterns and effects: Road traffic accessibility and geographic factors in Guangdong province, China. Journal of Geographical Sciences, 29(2): 213-230.

DOI

[52]
Yang S Q, Jin Z, Luo D et al., 2020. Effects of urban expansion on gully landform evolution in the Dongzhiyuan loess tableland of the Chinese Loess Plateau. Quaternary Sciences, 40(5): 1359-1370. (in Chinese)

[53]
Yao W B, 2009. Geomorphological evolution and its causes of Dongzhiyuan in historical period[D]. Xi’an: Shaanxi Normal University. (in Chinese)

[54]
Ying L S, Shen Z H, Chen J D, 2014. Spatiotemporal patterns of road network and road development priority in Three Parallel Rivers Region in Yunnan, China: An evaluation based on modified kernel distance estimate. Chinese Geographical Science, 24(1): 39-49.

DOI

[55]
Zhang X, Liu L, Chen X et al., 2021. GLC_FCS30: Global landcover product with fine classification system at 30 m using time-series Landsat imagery. Earth System Science Data, 13(6): 2753-2776.

DOI

[56]
Zhang Z, Liu S, Dong S et al., 2009. Spatio-temporal analysis of different levels of road expansion on soil erosion distribution: A case study of Fengqing county, Southwest China. Frontiers of Earth Science in China, 3(4): 389.

DOI

[57]
Zhu Y J, Jia X X, Shao M A, 2018. Loess thickness variations across the Loess Plateau of China. Surveys in Geophysics, 39(1): 715-727.

DOI

[58]
Ziegler A D, Giambelluca T W, 1997. Importance of rural roads as source areas for runoff in mountainous areas of northern Thailand. Journal of Hydrology, 196(1): 204-229.

DOI

Outlines

/