
Journal of Geographical Sciences >
Factors influencing the recessive morphology of farmland use under labor changes based on production input willingness and behavior of farmers
|
Liao Liuwen (1990-), PhD, specialized in urban-rural development and land use. E-mail: liaoliuwen_12@163.com |
Received date: 2023-03-02
Accepted date: 2023-09-12
Online published: 2023-12-14
Supported by
National Natural Science Foundation of China(42101198)
National Natural Science Foundation of China(42101267)
Hunan Social Science Review Committee Program(XSP22YBZ182)
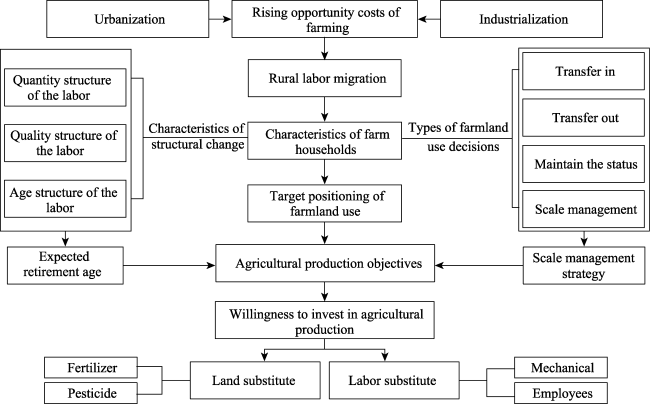
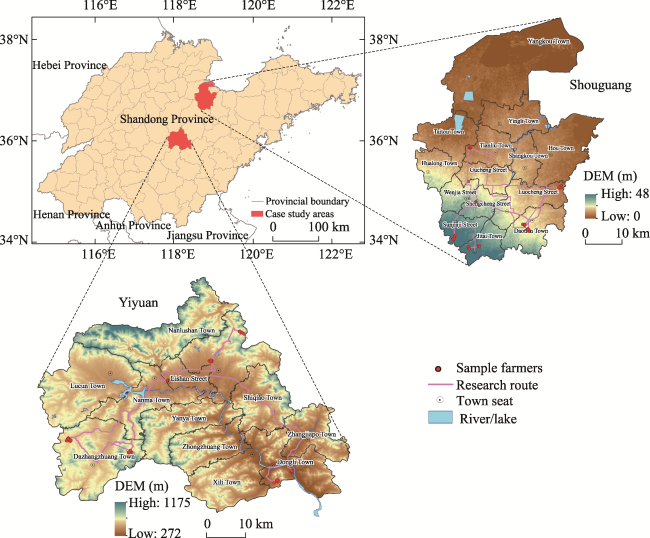
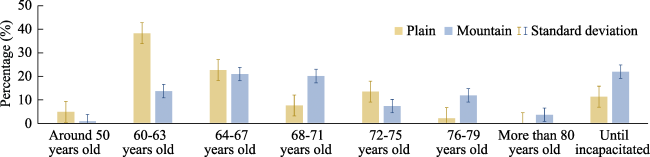
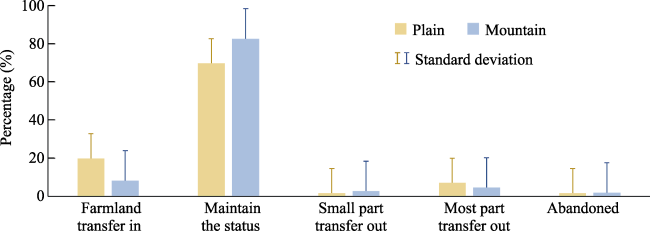
Land use transition occurs through changes in land use morphologies. The decision-making and land use behavior of farmers is the main factor that causes changes in the land use system and subsequent transitions of land use. This study focused on the recessive morphologies of farmland based on the investment in agricultural production inputs by farmers, and established an analytical framework based on induced technological innovation theory and farmers’ behavior theory, which followed the pathway of “objective-willingness- behavior.” Using survey data for farming households in two counties (Shouguang and Yiyuan) in Shandong province, the main factors influencing farmers’ willingness to invest in agricultural production and their differences under the background of labor force changes were comprehensively analyzed with a binary logistic model and ordinary least squares (OLS) regression model. The aim was to provide decision-making guidance for promoting farmland use transition. There were three key results. (1) The scale management objectives of a farmer were limited, with 75% of farmers intending to maintain the current farmland management scale, and planning to retire at an advanced age, although there were regional differences in these phenomena. (2) Farmers’ willingness to invest in agricultural production inputs was closely related to agricultural production objectives, farmland use, and agricultural production, whereas the labor structure had no significant effect. Farmers’ behavior toward investment in agricultural production inputs was negatively related to their expected retirement age. Changes in the household labor structure were an important factor boosting farmers’ investment in agricultural production inputs. (3) It is essential to better understand the cognitive level and structure of farmers, and the characteristics of the labor structure and type of agricultural development could be combined to improve the farmers’ cognitive level and willingness to adopt scale management objectives and generate behavioral responses. Using the dual scale of “land + service” would overcome the structural obstacles faced by farmers, and effectively play the role of providing both policy incentives and regulation.
LIAO Liuwen , LONG Hualou , MA Enpu . Factors influencing the recessive morphology of farmland use under labor changes based on production input willingness and behavior of farmers[J]. Journal of Geographical Sciences, 2023 , 33(12) : 2467 -2488 . DOI: 10.1007/s11442-023-2185-8
Figure 1 Farmers’ objectives and willingness to invest in agricultural production |
Figure 2 Case area location and sample distribution |
Table 1 Details of the sample villages |
| Town | Investigated villages | Social and economic situation |
|---|---|---|
| Sunjiaji Street | Sanyuanzhu village | The birthplace of Chinese winter warm vegetable greenhouses. There are 267 households in the village with 1009 people, a farmland area of 85.67 ha, and more than 530 winter warm vegetable greenhouses. The main corps planted are cucumber, bitter gourd, luffa and other vegetables, as well as cherries. |
| Fanyuxin village | Located in southern Shouguang. The main crops planted are cucumber and bitter gourd, 319 households, 1112 people, with a total income of 2.79 million yuan, and the per capita net income of farmers is 39,404 yuan. | |
| Jitai town | Mengjiaguanzhuang village | Located in the northeast of the town, there are 400 households and 1400 people in the village. The main crops planted are red pepper and eggplant. |
| Lvjiayi village | Located in the west of the town. The main crop planted is eggplant. There are more than 300 households in the village with approximately 1000 people. | |
| Luocheng Street | Dongzhenguan village | Located in the eastern Shouguang. There are 586 households and 2073 people in the village. The area of farmland is 299.06 ha. The main crop planted is colored peppers. The products have achieved the national “green food” certification. |
| Dongdanhe village | The main crops planted are tomato and melon. | |
| Tianliu Town | Cuilingxi village | Located in the south of Daotian Town, with 226 households, 876 people, and 100 ha of farmland. The main crops planted are tomatoes, colored peppers, melon, and other crops. |
| Tangjiazhuang village | A total of 165 households in the village with 514 people. The main crop planted is tomato. | |
| Hualong Town | Gaojia village | Located in the southeast of Hualong Town. The main crops planted are pumpkin and radish. |
| Lijiazhuang village | Located in the east of Hualong Town. The main crops planted are green beans and lettuce. | |
| Daotian Town | Nanqi village | Located in the southeast of Daotian Town. The main agricultural products include carrots, apples, yam, and broccoli. |
| Gucheng Street | Wamiao village | Located in the west of Gucheng Street. The main agricultural products include moss, strawberry, green apple, artichoke, and potherb mustard. |
| Dazhangzhuang Town | Hongxing village | Peanut planting base, while peach, grape, and pear production is also high. |
| Fuyu village | The eastern part of the Dazhangzhuang Town belongs to the planting area of yellow tobacco and medicinal materials. The main economic crops are peach, ginseng, peanut and apple. | |
| Yuezhuang Town | Zhujiazhuang village | Located in the southwest of Yiyuan, 1485 people, 487 households, annual labor output of 200 people, 93.33 ha of farmland. The main crops planted are leek, eggplant, apple and other crops. |
| Dongbaozhuang village | There are 1108 villagers in 326 households. The per capita income of the villagers is 8700 yuan. The area of basic farmland is 74 ha, which is mainly planted with medicinal materials and peach. | |
| Dongli Town | Xialiugou village | The village has a total of 260 households and 747 people. It has an area of 56 ha of farmland and an additional 58 ha of forest fruit. Apple, peach, and other forest fruit are the leading economic crops. |
| Xichangwang village | In the middle and low hilly area, there are 546 households with about 1,600 people, mainly producing orchard fruit products, such as apple, hawthorn and peach, and the Xichangwang white lotus root as a geographical indication product. |
Table 2 Variable selection and description |
| Variable name | Code | Variable description | Max | Min | Mean | Variance | |
|---|---|---|---|---|---|---|---|
| Explained variables | |||||||
| Willingness to change agricultural inputs | P | 1=Yes; 0=No | 1 | 0 | 0.865 | 0.342 | |
| Agricultural input behavior | Z | Agricultural production input/ten thousand yuan | 20 | 0.100 | 2.985 | 3.227 | |
| Explanatory variables | |||||||
| Agricultural production objectives | Planned retirement age | X1 | 0=Around 50 years old; 1=60-63 years old; 2=64-67 years old; 3=68-71 years old; 4=72-75 years old; 5=76-79 years old; 6=More than 80 years old; 7=Until incapacitated | 7 | 0 | 2.973 | 2.144 |
| Scale management objectives | X2 | 0=Farmland transfer in; 1=Maintain the status; 2=Small part transfer out; 3=Most part transfer out; 4=Abandoned | 4 | 0 | 1.037 | 0.756 | |
| Labor structure | Quantity | X3 | Proportion of agricultural labor | 1 | 0.125 | 0.627 | 0.226 |
| Quality | X4 | Per capita education years of agricultural labor | 15.500 | 0 | 6.951 | 3.575 | |
| Age structure | X5 | Proportion of agricultural labor aged 60 and above | 1 | 0 | 0.302 | 0.430 | |
| Family characteristics | Householder gender | X6 | 0=Male; 1=Female | 1 | 0 | 0.378 | 0.486 |
| Householder education level | X7 | 0=Below primary school; 1=Primary school; 2=Junior high school; 3=Senior High School (technical secondary school); 4=College or above | 4 | 0 | 1.517 | 1.002 | |
| Proportion of living expenses | X8 | Living expenses/total household expenses | 0.962 | 0.059 | 0.493 | 0.177 | |
| Farmland use and agricultural production | Farmland area | X9 | Survey data/ha | 4.020 | 0.034 | 0.372 | 0.338 |
| Irrigation type | X10 | 0=Drip irrigation; 1=Sprinkler irrigation; 2=Flood irrigation; 3=Other | 3 | 0 | 1.277 | 1.110 | |
| Soil fertility | X11 | 0=Good; 1=General; 2=Bad | 2 | 0 | 1.054 | 0.227 | |
| Frequency of technical training | X12 | 0=Never; 1=Sometimes; 2=Often | 2 | 0 | 0.348 | 0.537 | |
Table 3 The overall characteristics of interviewed farmers |
| Questions | Options | Number of households | Proportion (%) | Questions | Options | Number of households | Proportion (%) |
|---|---|---|---|---|---|---|---|
| Planned retirement age | <60 | 10 | 3.378 | Irrigation type | Drip irrigation | 113 | 38.176 |
| 60-71 | 187 | 63.176 | Sprinkler irrigation | 27 | 9.122 | ||
| 72-79 | 50 | 16.892 | Flood irrigation | 117 | 39.527 | ||
| ≥80 | 4 | 1.351 | Other | 39 | 13.176 | ||
| Until incapacitated | 45 | 15.203 | Proportion of agricultural labor | ≤0.5 | 144 | 48.649 | |
| Scale management objectives | Farmland transfer in | 46 | 15.541 | (0.5-1) | 90 | 30.405 | |
| Farmland transfer out | 24 | 8.108 | 1 | 62 | 20.946 | ||
| Maintain the status | 221 | 74.662 | Agricultural labor per capita years of education | ≤6 | 122 | 41.216 | |
| Abandoned | 5 | 1.689 | (6-9] | 121 | 40.878 | ||
| Whether to change agricultural inputs | Yes | 256 | 86.486 | (9-12] | 50 | 16.892 | |
| No | 40 | 13.514 | >12 | 3 | 1.014 | ||
| Farmland management scale (ha) | ≤0.134 | 52 | 17.568 | Proportion of agricultural labor aged 60 and above | 0 | 190 | 64.189 |
| (0.134-0.402] | 163 | 55.068 | (0-1) | 33 | 11.149 | ||
| (0.402-0.67] | 56 | 18.919 | 1 | 73 | 24.662 | ||
| >0.67 | 25 | 8.446 | Agricultural production input/ten thousand yuan | <1 | 54 | 18.243 | |
| Soil fertility | Good | 0 | 0.000 | [1-3) | 131 | 44.257 | |
| General | 280 | 94.595 | [3-5) | 58 | 19.595 | ||
| Bad | 16 | 5.405 | ≥5 | 53 | 17.905 |
Note: The proportion of the elderly agricultural labor aged 60 and above = number of agricultural labor aged 60 and above/total agricultural labor, 0 is a non-elderly farming family (the labor engaged in agricultural production is all middle-aged or young people under 60), (0, 1) is a mixed family (the family agricultural labor includes both young and middle-aged or older people), 1 is a purely elderly farming family (the family agricultural labor is the elderly over 60 years old). |
Figure 3 Planned retirement age of farmers |
Figure 4 Farmer scale management objectives |
Table 4 The regression model of farmers’ willingness to invest in agriculture |
| Explanatory variables | Code | Odds Ratio | S.E | Z-statistic | Significance level | |
|---|---|---|---|---|---|---|
| Agricultural production objectives | Planned retirement age | X1 | 1.241 | 0.128 | 2.100 | 0.035 |
| Scale management objectives | X2 | 2.246 | 0.761 | 2.390 | 0.017 | |
| Labor structure | Quantity | X3 | 0.541 | 0.487 | -0.680 | 0.495 |
| Quality | X4 | 0.886 | 0.384 | -0.280 | 0.781 | |
| Age structure | X 5 | 2.266 | 1.389 | 1.330 | 0.182 | |
| Family characteristics | Householder gender | X 6 | 0.588 | 0.251 | -1.250 | 0.213 |
| Householder education level | X 7 | 1.595 | 0.575 | 1.290 | 0.195 | |
| Proportion of living expenses | X 8 | 0.078 | 0.095 | -2.100 | 0.036 | |
| Farmland use and agricultural production | Farmland area | X 9 | 0.891 | 0.036 | -2.860 | 0.004 |
| Irrigation type | X 10 | 1.762 | 0.383 | 2.600 | 0.009 | |
| Soil fertility | X 11 | 0.179 | 0.169 | -1.820 | 0.069 | |
| Frequency of technical training | X 12 | 0.509 | 0.168 | -2.050 | 0.041 | |
| Constants | 28.782 | 55.479 | 1.740 | 0.081 | ||
| Log likelihood | -93.556 | |||||
| Pseudo R2 | 0.202 | |||||
| Samples | 296 | |||||
Table 5 Regression model of farmers’ behavior in investing in agricultural production inputs |
| Explanatory variables | Model 1 | Model 2 | Model 3 | ||||||
|---|---|---|---|---|---|---|---|---|---|
| Coefficient | t | Coefficient | t | Coefficient | t | ||||
| Agricultural production objectives | Planned retirement age | X1 | -0.142 | -2.030** | -0.152 | -2.170** | -0.146 | -2.100** | |
| Scale management objectives | X2 | -0.237 | -1.180 | -0.297 | -1.470 | -0.174 | -0.860 | ||
| Labor structure | Quantity | X3 | -1.227 | -1.830* | — | — | — | — | |
| Quality | X4 | — | — | 0.198 | 0.610 | — | — | ||
| Age structure | X5 | — | — | — | — | -0.908 | -2.520*** | ||
| Family characteristics | Householder gender | X6 | 0.212 | 0.660 | 0.234 | 0.720 | 0.267 | 0.840 | |
| Householder education level | X7 | 0.262 | 1.600* | 0.165 | 0.640 | 0.213 | 1.300 | ||
| Proportion of living expenses | X8 | -7.411 | -8.600*** | -7.289 | -8.430*** | -7.316 | -8.570*** | ||
| Farmland use and agricultural production | Farmland area | X9 | 0.315 | 7.110*** | 0.317 | 7.110*** | 0.297 | 6.660*** | |
| Irrigation type | X10 | -0.560 | -3.790*** | -0.601 | -4.100*** | -0.540 | -3.680*** | ||
| Soil fertility | X11 | 0.568 | 0.840 | 0.481 | 0.710 | 0.472 | 0.700 | ||
| Frequency of technical training | X12 | -0.450 | -1.570 | -0.477 | -1.650* | -0.464 | -1.630 | ||
| Constants | 7.055 | 5.240*** | 6.458 | 4.920*** | 6.621 | 5.090*** | |||
| R2 | 0.517 | 0.511 | 0.523 | ||||||
| F | 26.22 | 25.61 | 26.83 | ||||||
| Samples | 256 | 256 | 256 | ||||||
Note: *, **, *** represent significant at the confidence level of 0.1, 0.05 and 0.01, respectively. |
| [1] |
|
| [2] |
|
| [3] |
|
| [4] |
|
| [5] |
|
| [6] |
|
| [7] |
|
| [8] |
|
| [9] |
|
| [10] |
|
| [11] |
|
| [12] |
|
| [13] |
|
| [14] |
|
| [15] |
|
| [16] |
|
| [17] |
|
| [18] |
|
| [19] |
|
| [20] |
|
| [21] |
|
| [22] |
|
| [23] |
|
| [24] |
|
| [25] |
|
| [26] |
|
| [27] |
|
| [28] |
|
| [29] |
|
| [30] |
|
| [31] |
|
| [32] |
|
| [33] |
|
| [34] |
|
| [35] |
|
| [36] |
|
| [37] |
|
| [38] |
|
| [39] |
|
| [40] |
|
| [41] |
|
/
| 〈 |
|
〉 |