Research Articles

Zoning framework and policy implications of sustainable development by coupling multilevel in Beijing, China

  • WANG Wenxue , 1 ,
  • DENG Yu , 1, 2, *
Expand
  • 1. Institute of Geographic Sciences and Natural Resources Research, CAS, Beijing 100101, China
  • 2. Key Laboratory of Regional Sustainable Development Modelling, CAS, Beijing 100101, China
* Deng Yu (1985-), PhD and Associate Professor, specialized in urban development and spatial governance. E-mail:

Wang Wenxue (1998-), Master, specialized in urban geography and sustainable urban development. E-mail:

Received date: 2023-07-26

  Accepted date: 2023-10-25

  Online published: 2023-12-14

Supported by

National Key R&D Program of China(2022YFC3800803)

National Natural Science Foundation of China(42271218)

Abstract

Accurately diagnosing and assessing complicated spatial linkages at various scales has become a crucial strategy for enhancing the efficacy of urban government policies and initiatives in the modern era. There is still room for improvement in identifying spatial scale disparities and coupling linkages in cities, although the standard research paradigm on urban sustainability has produced numerous positive outcomes. To advance urban sustainability research from the perspective of spatial coupling, this study used cluster and cross-tabulation analyses for considering urban sustainable development patterns from the requirements of both development scale and spatial accuracy. Subsequently, the spatial unit coupling relationship between district and street scales was explored. Our findings indicated significant scale dependence in the spatial divergence between the built environment sustainability levels of streets and the economic, social, and environmental sustainability levels of districts. The implication is that significant differences exist in the built environment levels of various sustainable development type districts. The scale effect of the spatial coupling relationship influences urban planning and the transition of sustainable development. Maintaining reasonable population density and maximizing the structure and quality of social public resources supply are priorities for streets with the highest habitat sustainability that are located in low-growth type districts. Priority should be given to population deconcentration for high habitat sustainable streets located in synergistic development type districts to increase the level of public service protection. Supporting facilities should be added to medium sustainable streets in low-growth areas to increase the mix of land use, which should encourage additional production activity concentration, thereby fostering overall economic strength. Further, increasing the accessibility of local public service facilities for low and medium sustainable streets located in ecologically biased areas should be prioritized, but a green and low-carbon orientation should be maintained during building.

Cite this article

WANG Wenxue , DENG Yu . Zoning framework and policy implications of sustainable development by coupling multilevel in Beijing, China[J]. Journal of Geographical Sciences, 2023 , 33(12) : 2425 -2445 . DOI: 10.1007/s11442-023-2183-x

1 Introduction

Research on sustainable cities is moving away from multi-objective thinking and toward multidimensional synergy and multiscale interaction. The requirement to, “Make cities and human settlements inclusive, safe, resilient, and sustainable” is stated specifically as one of the 17 Sustainable Development Goals (SDGs) of the 2030 Agenda for Sustainable Development of the United Nations (UN, 2015). The fundamental tenet of sustainable urban development currently centers on achieving economic growth, social fairness, and environmental protection (Hassan and Lee, 2015; Frini et al., 2020). The cornerstone for creating sustainable cities is maintaining economic prosperity and steady development, with economic growth, industrial development, consumption levels, and innovation ability all playing significant roles in the process of urban economic development (Grodach, 2011; Hodson and Marvin, 2017; Yi et al., 2021). Building a sustainable city requires upholding equality and justice and advancing social progress, with relevant academic study primarily focusing on job status, social security, and human well-being (Ding et al., 2015; Gonzalez-Garcia et al., 2018; Deng et al., 2019). The goal of creating sustainable cities is providing a good living environment and harmony between people and nature, with environmental health, air quality, resource consumption, and pollution emission being major topics (Xie et al., 2016; Deng et al., 2020; Dong et al., 2022). Communities serve as fundamental territorial units for urban activities, and theories and practices for creating sustainable communities have been established mainly based on analyses of the ‘built environment’. Study has indicated that the crucial element in urban development is addressing issues such as overpriced and subpar housing, and the overcrowding brought about by population increase. Therefore, eliminating these negative factors would improve the physical and mental well-being of the inhabitants (Winston, 2022). High-density cities with diverse land uses, created by overlapping functions, could increase resource efficiency and increase land use diversity (Xia et al., 2021). Greater road connectivity improves travel conditions, offering more transportation options to local populations (Jing et al., 2010). The premise that better transportation improves the movement of people and materials by improving microspatial connectedness (Haider et al., 2018) is supported by research on enhancing ‘community efficiency’ (Too and Earl, 2010). The degree of interaction between various spaces within cities has increased recently because of the frequent movement of elements within cities. Consequently, a shift in urban governance was necessary, i.e., from elemental to systemic governance and the removal of the research bottleneck in which each region is divided and various systems function independently (Bouzguenda et al., 2019; Frini et al., 2020).
A trend of scale interaction in sustainable urban research has become increasingly prominent, driven by a requirement for multiscale spatial linkage governance. The degree of growth of distinct spaces determines the improvement of the sustainability level; however, nearby spaces also exert influence (Berardi, 2013; Xiao et al., 2022). A positive correlation is mostly found between a functional mix of microspaces and their development dynamics, whereas the few regions showing negative correlation effects are mostly situated close to spatial units with high regression coefficients. This finding indicates that areas with a high functional mix tend to be more dynamic and draw resident activities from nearby spaces (Wang B et al., 2022). The phenomenon is a concrete embodiment of the interactions of various spaces (Chen and Chi, 2022). Clarifying the mechanism of action of such spillover phenomena for encouraging synergistic spatial growth is related to the development process and enhancement of the integrated sustainability level of each metropolitan region (Feng et al., 2022). However, disparities exist between the development objectives, optimization tactics, and future directions and realization paths of cities and communities demonstrating characteristics of mutual influence (Zumelzu et al., 2019). This factor requires multiscale integration and a layered thinking approach to comprehending and rebuilding sustainable cities, as well as close examination of the development traits and patterns of cities and communities (Wu, 2013; Yigitcanlar et al., 2015; Wang W et al., 2022). For instance, the relocation of the Shougang Group is a significant effort toward improving the environmental quality in microspace and a substantial contribution to the aim of the city of Beijing for achieving environmental sustainability in the process of upgrading local industries. Under the combined influence of urban regulations and community behaviors, the relocation of the Shougang Group is an investigation of sustainable development pathways. In accordance with this development, the focus of research on sustainable cities has centered more on their nested qualities, i.e., how communities are integrated into cities and interact at diverse sizes.
Accurately diagnosing and assessing complicated spatial linkages at various scales has emerged as a crucial strategy for enhancing the efficacy of urban government policies and initiatives in the modern era. The traditional approach to evaluating sustainable cities frequently concentrates on identifying ‘urban diseases’ at city level, and lacks a thorough understanding of sustainable development zoning and control policy research and judgment based on the multiscale spatial coupling of cities (Xue et al., 2021; Halla and Merino-Saum, 2022; Zhang et al., 2022). On the one hand, a lack of spatially differentiated management could result from disregarding the uniqueness of urban macro- and microregions in terms of present issues, development objectives, and implementation paths. The issue of a major mismatch between ecological space (Zheng et al., 2023), public resources (Li et al., 2023), and population size is more likely to emerge in large cities with unequal internal spatial development, such as Beijing, Shanghai, and Guangzhou. The development policies for local conditions cannot be optimized effectively without appropriately assessing microspatial development issues and utilizing their growth potential. On the other hand, the absence of spatial coupling relationship analysis ignores the effects brought about by various spatial scale of the research object, which could result in loose urban nesting linkages and lead to a misestimate of the degree of urban sustainability (Bolster et al., 2007; Mayer, 2008). A study on the equity of the spatial supply of urban infrastructure in Singapore, for instance, demonstrated that it was more challenging to determine the equity of facility distribution at the micro- than the macroscale, and emphasized the importance of leveraging the scale effect to effectively advance the implementation of multiscale spatial planning schemes (Tan and Samsudin, 2017). However, the current research frameworks are insufficient for cross-scale integrated control mechanisms and urban refinement, and adaptive theoretical and methodological innovations are required urgently. Promoting thorough study on urban sustainability zoning from the standpoint of spatial coupling based on the distinctions and relationships between macro- and microscales is therefore imperative.
Based on this context, the current study used the city of Beijing as a case study, developed a thorough sustainability index system at district and street scales, and performed cluster analyses based on each index and evaluation score. Subsequently, areas with diverse characteristics were classified into one type zone, and the division of sustainable development type zones based on district and street scales was investigated. Second, from the requirements of cities in terms of development scale and spatial accuracy, the relationship between district and street scales was investigated. Finally, the spatial unit coupling relationship between district and street scales was combined to offer policy recommendations for urban refinement management from a multiscale viewpoint.

2 Research framework based on scale differences and interactions

2.1 Spatial scale within a city

The ‘scale effect’ is a major issue in geographic research and a significant worry for geographers (Petrović et al., 2022; Andersson et al., 2023). Numerous empirical studies have shown that research adhering to the fundamental paradigm of geographic research, such as spatial patterns, temporal characteristics, elemental coupling, and the like, are dependent on scale (Wang et al., 2013, 2021; Qu et al., 2018). The finding implies that in such processes, the research object has temporal or spatial scale differentiation characteristics (Yigitcanlar et al., 2015), making it difficult to reveal the scientific essence of the research problem if the scale is not selected properly (Wu, 2013; Shirazi et al., 2020). Issues such as a lack of urban spatial differentiation management, loose nested urban system relationships, and the challenges associated with implementing multiscale planning schemes must be resolved to fully improve the territorial spatial governance system and increase the capacity of modern governance. As regards geographical heterogeneity and multiscale spatial inter-feeding processes, the classification of urban sustainable development type zones from the standpoint of spatial coupling is crucial for fine-grained analysis of complex urban systems.
An urban district is a collection of streets. Districts are the management space for urban development and construction and, in comparison with streets and communities, form a relatively complete socioeconomic development system, have distinctive regional functional positioning (Zhou et al., 2016), and primarily conduct urban key project construction, public resource allocation, and other responsibilities (Tian et al., 2010). A street is typically the primary spatial carrier for implementing urban programs. Streets have to carry out relatively independent urban activities including housing, employment, transit, and recreation (Huang et al., 2023), i.e., the everyday life of urban residents is heavily dependent on the streets where they reside. The community is the basic cellular unit of urban development and has the highest sensitivity and the smallest spatial granularity. The people of a community might have comparable economic and social traits, but the community itself typically concentrates on residential functions rather than entire urban functions (Berardi, 2013; Shirazi et al., 2020), which cannot fully define the meaning of sustainable development.

2.2 Research framework at district and street scales

This study combined the differences in focus and the interdependence between the spatial scales at district and street levels to meet the needs of cities in terms of both development scale and spatial accuracy (Figure 1). The focus was on the central issue of sustainable urban development and urban sustainability research was developed from two scales, i.e., management scale and utilization scale at district and street levels. The functional coordination of microspace is the support path of macrospace sustainability, whereas the economic, social, and environmental sustainability of macrospace is the main aim of microspace development. For instance, improving production efficiency is necessary for sustainable economic development at the macrolevel, which pushes the production space toward intensive development, whereas choosing localized business patterns in microspace supports the optimal arrangement of urban industries and leads to more sustainable industrial development (O’Connor et al., 2018). Improved living conditions, traffic accessibility, and practical and efficient transportation, i.e., all the requirements for improving the quality of life of residents, would increase the total livability and sustainability of a city (Zhu et al., 2020). The conditions for pedestrians in communities could be improved by rationalizing road design, enhancing the effectiveness of public transportation, and lowering private car trips, thereby also cutting back on carbon emissions (Mouratidis, 2021). Rationalization of the labor market would attract more people and resource concentrations, but could also lead to social unrest and an increase in crime, which would be detrimental to long-term social progress (Shirazi et al., 2020).
Figure 1 District- and street-scale research framework
Our study area comprises 16 districts based on the administrative boundaries of the districts of Beijing, and 330 streets overall based on the administrative divisions at street level and data from the seventh census in 2020. Urban areas were assessed in terms of economic, social, and environmental development scales based on the selection of spatial scales for urban sustainability evaluation and analysis of the hierarchical structure of spatial units. Streets were measured in terms of the degree of suitability of the built environment for living conditions. As regards healthcare, e.g., urban scale focuses on the overall standard of care, leading to the indicator ‘number of healthcare beds per 10,000 people’ being chosen. However, street scale should concentrate on the accessibility of healthcare facilities in various spatial units to reflect the habitat experience of residents at microscopic scale. The distinction between district and street size sustainability evaluation could contribute to the fining of urban governance, deepening understanding of the complex urban system, and broadening understanding of what urban sustainability evaluation means.

3 Materials and methodology

3.1 Study area

As mentioned, Beijing was chosen as the case study for this research (Figure 2). Beijing has made outstanding advancements in economic and social construction after more than 40 years of swift growth in the reform and opening up. At the end of 2020, the regional GDP of the city was 3,610.26 billion RMB (Chinese yuan), or 3.56% of the total GDP of the country. The city had a population of 21.89 million, with 19.164 million living in urban areas, and the urbanization rate was 87.55%. The city has a total area of 16,410.54 km2, and is divided into 16 administrative districts, namely Dongcheng, Xicheng, Chaoyang, Haidian, Shijingshan, Fengtai, Fangshan, Tongzhou, Shunyi, Changping, Daxing, Mentougou, Huairou, Pinggu, Miyun, and Yanqing.
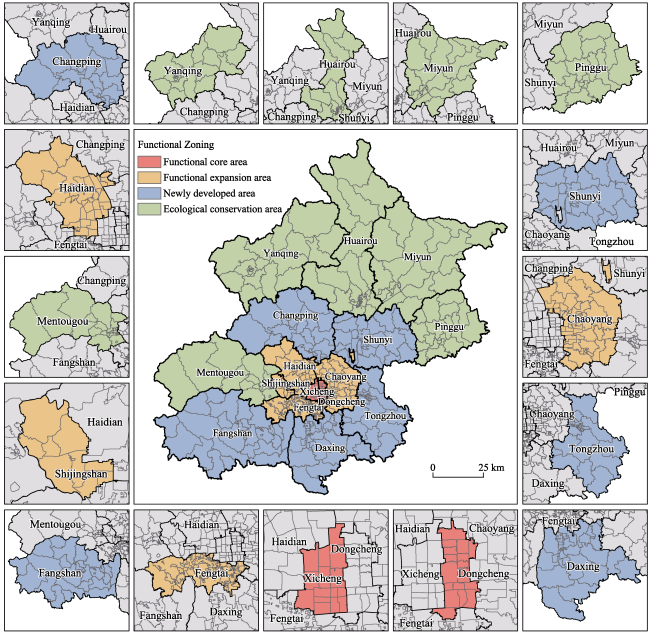
Figure 2 Study area (Beijing, China)
Beijing, the capital of China, is considered and ideal area for research. The city has a developed economy and sizable population and contributes nearly 4% to the national GDP despite occupying only 0.17 percent of the total land area of the country. However, as the population of the capital slowly increases toward overcrowding, resource depletion and infrastructure overload will increase the cost of urban development, i.e., create agglomeration diseconomies. The city will deteriorate once these agglomeration diseconomies take hold. A number of industries with high pollution levels and high energy consumption as prominent characteristics have been removed gradually from the capital in accordance with the proposal “to clarify the strategic positioning of the capital city, adhere to and strengthen the core functions of the capital, and adjust and decentralize non-capital core functions.” Whereas the demands for the design of urban infrastructure, urban governance, habitat construction, and ecological environment have increased gradually, the pursuit of economic rewards in urban development has decreased (Li and Zhang, 2015). The districts of Beijing have gradually improved their functions over the past number of years, displaying diverse characteristics, complex functions, and high development levels. However, new challenges to sustainable development have emerged, such as significant regional development differences, a lack of spatially differentiated management, loose nested relationships of urban systems, and challenges for implementing multiscale planning schemes, which all urgently require in-depth research.

3.2 Sustainability evaluation index system

3.2.1 Indicator system at district scale

A sustainable city is defined as, “a city that has a sustainable supply of natural resources to meet its development needs, is resilient to potential environmental risks, and develops in a sustainable manner in its social, economic, and physical environment” at the second United Nations Conference on Human Settlements (UN-Habitat, 2001). The academic community overwhelmingly supports this concept, which considers the triple bottom line (economic, society, and environment) of sustainable development. Twenty indicators encompassing the three subsystems of economics, society, and environment were chosen together with information from pertinent literature (Li and Yi, 2020; Michalina et al., 2021; Liang et al., 2022), and taking into account the scientific, extensive, and easily accessible quality of the data (Table 1). The economic component emphasizes the capacity for innovation, as well as economic scale, structure, revenue, and consumption. The availability of public resources and the level of social security are the main topics of the social component. The environmental component focuses on energy use, sanitation, and investments in environmental conservation. Every indicator influences how sustainably cities develop, both positively (+) and negatively (-), with larger positive values favoring sustainable urban development and vice versa.
Table 1 Indicator system of urban district sustainability evaluation
Subsystem layer Indicator layer Indicator weights
Economic subsystem (subsystem weights: 0.45) Gross domestic product per capita (yuan/person) 0.19 (+)
Proportion of tertiary industry output value to GDP (%) 0.07 (+)
Disposable income per urban resident (yuan) 0.10 (+)
Total retail sales of social consumer goods per capita (yuan) 0.12 (+)
Fiscal revenue per capita (yuan) 0.16 (+)
Fixed asset investment per capita (yuan) 0.08 (+)
Number of patents granted 0.28 (+)
Social subsystem (subsystem weights: 0.33) Urban registered unemployment rate (%) 0.02 (-)
Number of medical beds per 10,000 city residents 0.16 (+)
Number of primary and secondary school teachers per 10,000 city residents 0.13 (+)
Number of vehicles per 10,000 city residents 0.19 (+)
Collection of books per capita in the city 0.33 (+)
Share of social security and employment expenditure in the GDP (%) 0.17 (+)
Environment subsystem (subsystem weights: 0.22) Per capita green space area in the city (m3/person) 0.19 (+)
Green coverage ratio (%) 0.10 (+)
Annual average concentration value of respirable particulate matter (µg/m3) 0.12 (-)
Annual average concentration value of sulfur dioxide (µg/m3) 0.05 (-)
Per capita domestic electricity consumption (kWh/person) 0.07 (-)
Energy consumption per unit of GDP (ton of standard coal/million yuan) 0.03 (-)
Environmental protection investment as proportion of the GDP (%) 0.44 (+)

3.2.2 Indicator system at street scale

After meticulously researching the built environment, Cervero and Kockelman (1997) presented three crucial dimensions (3D), namely density, diversity, and design. Ewing and Cervero (2010) later added the two dimensions of distance to public transportation and distance to destination, bringing the total to five (5D). Eight indicators were chosen to represent these 5D dimensions, as indicated in Table 2, considering the reliability, representativeness, and accessibility of the data. Density was employed as the indicator of street resident population density. The point of interest (POI) entropy index was employed as a measure of diversity. The ratio of the road area of ‘non-main’ roads was used as an indicator for design. The average journey time to bus and subway stations was used to gauge the accessibility of public transit. Owing to similarity in the distribution pattern of various public service facilities in the city, three representative types of infrastructure, namely educational and cultural facilities, medical and health facilities, and parks and green areas, were chosen in this study for calculating destination accessibility. Each indicator affects the built environment of a street both positively (+) and negatively (-), with higher positive values promoting the sustainable development of the street and vice versa.
Table 2 Indicator system of street built environment evaluation
Subsystem layer Indicator weights Indicator attributes Indicator layer Calculation method
Density 0.089 Population density Street resident population/area of the street (persons/km2)
Diversity 0.255 + POI entropy index EI=ΣXiln(1/Xi), where Xi is the proportion of POIs of category i in the study area to the total POIs
Design 0.229 + The ratio of non-main roads area Non-principal road area / total road area
Distance to public transportation 0.217 + Accessibility of bus stops Average journey time to bus stops
Accessibility of subway stations Average journey time to subway stations
Distance to destination 0.210 + Accessibility of educational and cultural facilities Average journey time to educational and cultural facilities
Accessibility of medical and health facilities Average journey time to medical and health facilities
Accessibility of parks and green areas Average journey time to parks and green areas

3.3 Research methodology

3.3.1 Entropy weight method

In the entropy weighting approach, calculations are based on the idea that the weight of each indicator should be proportionate to its individual value (Zhao et al., 2018; Liu and Lin, 2019). Therefore, the assignment method prevents information from being overlapped by other indications. Entropy was originally a thermodynamic notion used in physics to describe the extent of chaos of a system. In the evaluation system developed in this study, the weight corresponded to the influence of the indicators on the overall evaluation, where the larger the weight, the smaller would be the entropy value (Wang et al., 2020).

3.3.2 Ward system clustering method

The Ward system clustering method is an alternative clustering technique for multifactor and multi-indicator classification and feature identification, also known as the sum of squares method. This method considers both homogeneity within the type area and differences beyond the type area (Jahn et al., 2022). The approach is based on the concept of analysis of variance, using Euclidean distance as the criterion. First, each sample in the set is clustered, and subsequently the categories are merged by calculating the variance between the center of gravity of each class separately (Lurka, 2021; Ogasawara and Kon, 2021).
The sum of squared deviations of the samples in ${{G}_{t}}$ after dividing n samples into G1, G2, …, Gk total k classes is
${{S}_{t}}=\underset{i=1}{\overset{{{n}_{t}}}{\mathop \sum }}\,\left( x_{i}^{t}-{{{\bar{x}}}^{(t)}} \right)'\left( x_{i}^{t}-{{{\bar{x}}}^{(t)}} \right)$
where the i-th sample in Gt is denoted by $x_{i}^{(t)} $. The term “nt” stands for “nt samples in Gt”. The gravity of Gt is centered at $\bar{x}_{i}^{(t)} $. The deviation intra-class sum of the squares of the k classes is
S=$\underset{t=1}{\overset{k}{\mathop \sum }}\,{{s}_{t}}$

3.3.3 K-means clustering

K-means clustering is a distance-based iterative solution clustering technique, meaning that the similarity of two research samples increases when they are clustered closer together (Carvalho et al., 2016; Sinaga and Yang, 2020). The procedures are shown in Figure 3. All study samples are divided into k groups, and k study samples are chosen at random to serve as the initial cluster centers. Subsequently, the distance between each study sample and the subcluster centers is calculated, and each sample is assigned to the cluster center that is closest to it. Finally, the cluster centers are recalculated using the study samples that are already present in the newly assigned clusters. Once the termination criteria are satisfied (no or a minimal number of samples present are reassigned, no or a minimal number of cluster centers present change, and the error squared and locally minimized), the procedure is terminated (Zhou et al., 2022).
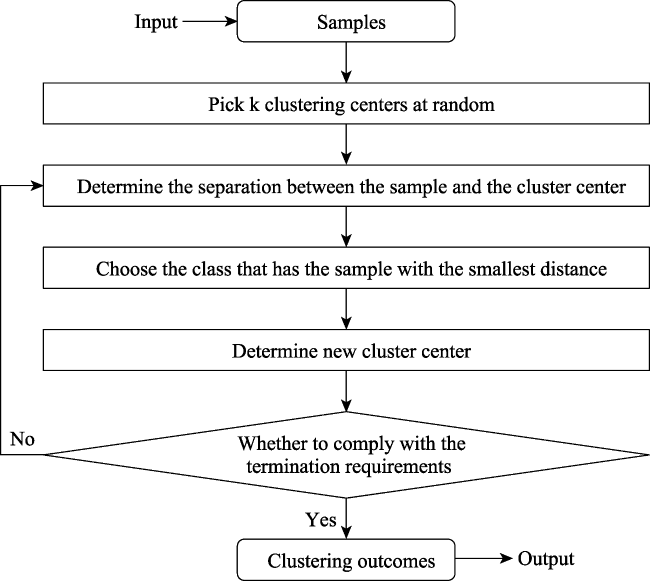
Figure 3 K-means clustering flow chart

3.4 Data source

The database for this study was divided into three sections, namely, first, vector data for administrative districts, e.g., the municipal, county, and street boundaries of Beijing. These data derive from the Resource and Environment Science and Data Center of the Chinese Academy of Sciences. Second, statistical data covering the period 2011-2020, sourced from, e.g., statistical yearbooks published by the governments of Beijing and each district, statistical bulletins, and the seventh population census in 2020. Third, to create the POI database, the coordinates of various facilities, including bus stops, hospitals, parks, and green spaces in Beijing were obtained from the POI database of AutoNavi.

4 Results

4.1 Classification of sustainable development type zones in Beijing

Figure 4 shows the spatial distribution characteristics of sustainable development type zones of Beijing based on district and street scales.
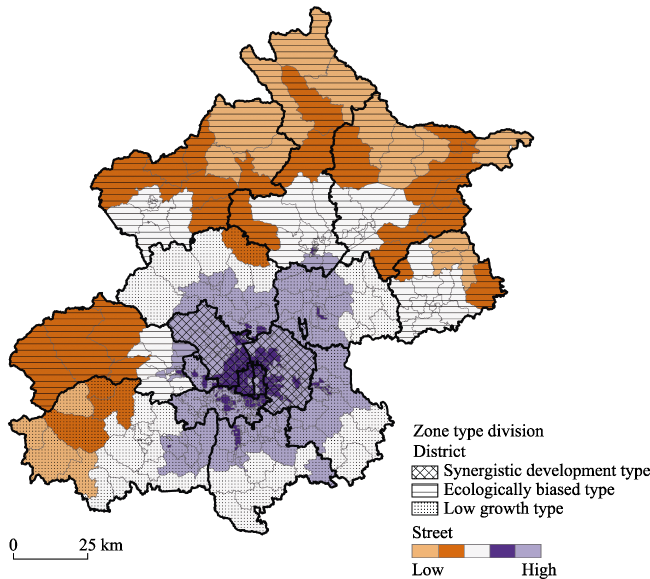
Figure 4 Classification of sustainable development type zones in Beijing
The Z-scores of each factor were standardized, clustered, and partitioned using the Ward system clustering method, and each municipal district in Beijing was classified into three types based on the clustering, namely synergistic development, ecologically biased, and low growth. These classifications were made at district level using the economic, social, and environmental subsystem scores and the overall scores of each municipal district in Beijing from 2011 to 2020 as classification factors. The average indices for the districts of synergistic development, including Dongcheng, Xicheng, Chaoyang, and Haidian, were 0.411, 0.308, 0.235, and 0.478. These four districts had the highest total scores because of their major economic advantages, as well as achieving good scores for social and environmental factors. For ecologically biased areas, including Mentougou, Huairou, Pinggu, Miyun, and Yanqing, the average indices of each categorization component were 0.107, 0.239, 0.489, and 0.309. The environmental subsystem scores for these five districts were the highest and differed significantly from the economic and social subsystem values. The average categorization factor indices for low-growth areas, including Shijingshan, Fengtai, Fangshan, Tongzhou, Shunyi, Changping, and Daxing, were 0.144, 0.126, 0.339, and 0.200. These seven districts lack clear benefits in all areas of the economy, society, and environment, and their degree of overall sustainability was constantly poor or even declining.
The evaluation indices and complete scores of the built environment were aggregated at street level using K-means to create five different habitat sustainability zones, namely highest, high, medium, low, and lowest. The highest habitat sustainability zone had the best built environment, with 111 streets distributed in a ring around the central regions of Xicheng and Dongcheng, and a mean value of 0.826. This type of location had high scores overall; however, the average non-main road area score was only 77.78%, placing it third among the five types of areas and showing a somewhat weak street network design for a region of this type. The two core districts of Xicheng and Dongcheng dominated the monocentric distribution of the 95 streets that made up the mean built environment score of 0.823 of this high habitat sustainability type area. The key element restricting the sustainability of the built environment in this area was the unusually high population density of this type of district, with a mean value of 21,621 persons/square kilometer. With 80 streets distributed in a ring pattern outside the sixth ring road of Beijing, the mean value of the built environment score of the medium habitat sustainability type area was 0.697. With 27 streets, mostly in the far-flung outskirts of the city, the mean value of the built environment score of the low habitat sustainability zone was 0.492. The mean value of the built environment score of the lowest habitat sustainability area, with 17 streets distributed in a dotted pattern in the urban perimeter, was 0.416. The medium, low, and lowest habitat sustainability zones eventually experienced a decline in population density. The provision of public service facilities, such as schools and hospitals, was insufficient owing to the progressive distance from the urban center, with comparatively few bus and subway stops, thereby detrimentally affecting the convenience of travel of the residents. The diversity and accessibility of facilities were, therefore, key elements limiting the sustainable growth of the built environment.

4.2 Relationship between district and street sustainability levels

For the cross-tabulation study, district-scale sustainability type zones were allocated to each street, and the frequency of occurrence of street built environment type zones in each category was counted (Table 3). With a significance level of 0.000, the findings passed the chi-square test, indicating substantial differences between the built environment levels of various sustainable development type zones.
Table 3 Cross-tabulation analysis of the district sustainable type area and the street built environment type area
Street type division District type division Total
Synergistic development type Ecologically biased type Low-growth type
Highest habitat sustainability type Number 35 5 71 111
Percentage (%) 33.98 5.75 50.71 33.64
High habitat sustainability type Number 68 2 25 95
Percentage (%) 66.02 2.30 17.86 28.79
Medium habitat sustainability type Number 0 44 36 80
Percentage (%) 0.00 50.57 25.71 24.24
Low habitat sustainability type Number 0 23 4 27
Percentage (%) 0.00 26.44 2.86 8.18
Lowest habitat sustainability type Number 0 13 4 17
Percentage (%) 0.00 14.94 2.86 5.15

Note: χ2 = 230.492, df =8, sig. = 0.000

The value of each row, measured horizontally, represents the percentage of each sustainable development type zone in each built environment type zone. The type zone with the highest value corresponded to the primary sustainable development pattern of the built environment type zone. Districts with low-growth types overlapped with streets with highest habitat sustainability types, and districts with synergistic development overlapped more with streets with high habitat sustainability types. Streets with medium habitat sustainability had the highest overlap with ecologically biased areas, followed by those with low habitat sustainability and lowest habitat sustainability. Districts focused on synergistic development had the largest proportion of high habitat sustainability streets overall (66.02%). Medium and low habitat sustainable streets accounted for a higher percentage (50.57% and 26.44%, respectively) in ecologically biased districts. In low-growth type zones, there were more highest and medium habitat sustainable streets (50.71% and 25.71%, respectively). Overall, ecologically biased and low-growth type districts were mixed with various street built environment type areas, as shown by the greater number of all types of street built environment type areas in both types of regions.
Based on the findings of the cross-tabulation analysis and spatial location, the spatial distribution maps of the district sustainable development type areas and the street built environment type areas were abstracted into a conceptual map (Figure 5) to identify the spatial coupling relationship between them. The synergistic development type areas primarily overlapped with high habitat sustainability type areas, ascribed to the areas with coordinated development of the three subsystems of economy-society-environment having rich and diverse public service facilities and high accessibility, giving residents relatively convenient living conditions and a good overall level of built environment. Although human density was relatively low in places with high ecological quality, these areas lacked diversity and accessibility owing to their distance from urban facilities. Therefore, ecologically biased areas primarily overlapped with areas with medium and low built environments. The highest habitat sustainability streets, primarily located on the periphery of the city, had lower population densities than the city center but better infrastructure development and easier access to public services, overlapping with the low-growth zones.
Figure 5 Correlation between sustainable development type areas and built environment type areas

4.3 Implications of spatial coupling relationship for urban planning and management

Specific sustainable development type zones are created by the law of spatial differentiation of economic, social, and environmental factors. The functions of these zones in various locational areas affect how the physical environment of the street is constructed. Specific built environment type zones are created as a result of the spatial distribution of different infrastructure types, resulting in variances in built environment conditions. The economic, social, and environmental development of a region is influenced by the production and living activities of the residents living in various built environment conditions. The interplay between street-scale spatial units and spatial units at the district level creates sustainable development type zones and built environment type zones. Figure 6 shows the scores for the different zone types. A city is a massive, intricate system comprising nested combinations of various levels of space (Sharifi and Murayama, 2013; Zumelzu et al., 2019), and economic, social, policy, spatial, and other factors influence spatial coupling (Kong et al., 2022). The resultant scale-space effects have implications for urban planning and the transformation of sustainable development.
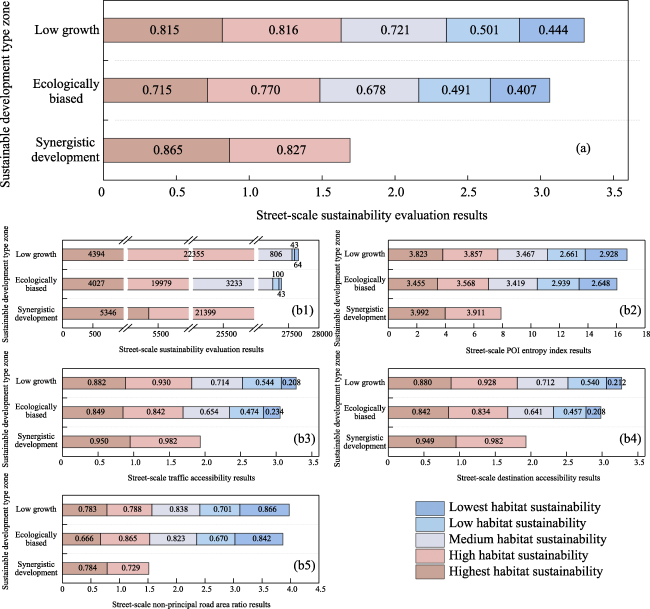
Figure 6 Score results for each sustainability type zone
The supply of social public resources should be optimized in terms of both structure and quality in the highest habitat sustainability streets found in the low-growth districts. These streets did not excel in any economic, social, or environmental areas relative to the extent of development at district level, and their overall sustainability levels were constantly poor. Interestingly, after 2016, the social subsystem scores for each district changed, with the average score falling by 0.023 over the course of the five-year period. This finding was ascribed to the growing population of the category, which exacerbated the lack of social and public resources and detrimentally affected the quality of life. Such streets have a POI entropy of 3.823 and a wealth of infrastructure. Accessibility to basic services and public transportation was good (0.882 and 0.880, respectively), but the architecture of the road network was somewhat poor, which made commuting more difficult. In the future, this type of street should manage population density while implementing the decentralization of the primary activities of the capital city and ensuring a sufficient supply of varied resources for public services. Focusing even more on the microspace, pedestrian paths for the built-up area should be designed carefully to avoid cutting across any street precincts and to enhance the quality of the walking environment.
Priority should be given to population deconcentration for high habitat sustainability streets situated in synergistic development-type districts to increase the level of public service protection. These streets performed well in social and environmental aspects and had major economic advantages at the district-level development scale. The economic, social, and environmental subsystem scores of such areas recorded average annual growth rates of 9.33%, 6.22%, and 4.11% from 2011 to 2020, respectively. However, with time, a decline occurred in their improvement levels for social and environmental sustainability. The social security and employment expenditures as a percentage of GDP performed poorly among all the districts, indicating the shortcomings of sustainable development of this type of region. With a mean POI entropy score of 3.911 and an average travel time to diverse public facilities of approximately 30 minutes, these streets counted among the best in terms of public facility diversity and accessibility. However, the extraordinarily high population density was a significant barrier to sustainable development of the built environment. In the future, the emphasis of this type of street should be on social well-being, particularly to increase investment in employment and social security. Further emphasizing the microspace, the focus should be on population decongestion, encouraging residents of urban centers to move to nearby neighborhoods and cities, thereby lowering population density and enhancing livability.
The land use mix for medium sustainable streets in the low-growth region should be improved by adding more supporting facilities, which would result in a greater concentration of different production activities to boost overall economic strength. These streets scored poorly on the development scale in terms of economic, social, and environmental factors, as well as integrated sustainability. Over the five-year period from 2016 to 2020, the social and environmental subsystem scores of low-growth areas declined on average by 2.30% and 13.01%, respectively. This result was ascribed to the general economic strength of this type of street, leading to, on the one hand, an insufficient supply of various public resources within the streets, and its level of social well-being lagging behind that of the synergistic development type of district. On the other hand, its environmental protection and pollution prevention pressure was high, which restrained sustainable environmental development to some extent. The lack of diversity and accessibility of public service facilities, with a POI entropy index of 3.467 and an average travel time to various infrastructure facilities of nearly an hour, was the most significant barrier to the improvement of the built environment quality of these streets. By increasing the density of different amenities and enhancing their diversity and accessibility, this type of street could enhance the daily life for residents in the future. Such actions could also direct the clustering of business types in microspace through the logical arrangement of additional facilities, thereby driving economic growth and encouraging overall development strength.
Priority should be given to increasing the accessibility of all public services in the area while maintaining a green and low-carbon orientation in the construction process for medium, low, and lowest habitat sustainability streets located in ecologically biased zones. The average growth value of the environmental subsystem score for such locations from 2011 to 2020 was 0.489, whereas the average increases for the economic and social subsystem scores were only 0.107 and 0.239, respectively. These streets had excellent environmental advantages. In future, the emphasis should be on energy conservation and use, as well as increasing investment in environmental protection, along with per capita domestic electricity consumption rising and the proportion of GDP invested in environmental protection declining among environmental subsystem indicators. Low population density and good adaptability for road network design characterized such streets. The average journey time to various forms of infrastructure, however, was more than an hour, i.e., travel convenience was low owing to relatively few metro stations and bus stops on the periphery of the city. Whereas the POI entropy index of both low and lowest habitat sustainability type streets was lower than 3, with clear stratification from other regions, the provision of public service facilities such as education and medical care was insufficient owing to the distance from the city center. To further increase the accessibility of facilities in such regions, this type of street should concentrate on expanding the allocation of public transportation and services such as education and medical care. However, the issue of energy consumption must be considered when building infrastructure, and high technology could be employed to boost energy usage efficiency, thereby retaining the environmental benefits.

5 Discussions and conclusions

5.1 Main findings

Sustainable urban research is currently more concerned with multiscale spatial governance than with the long-term viability of urban subsystems. This study adopted a multiscale perspective to condense the factors influencing the development of urban spatial units at various scales, built a theoretical framework for evaluating urban sustainability based on inter-scale differences and correlations, thoroughly evaluated the urban sustainability level, explored the patterns of urban sustainable development, and proposed targeted development strategies to assist decision-makers in taking appropriate development measures.
The study discovered that at district scale, the sustainability level of the economic, social, and environmental subsystems in each district of Beijing showed alternating trends and could be classified into three types of areas through cluster analysis, namely synergistic development, ecological biased, and low-growth types. At street scale, the spatial circle structure of the built environment sustainability level of Beijing was obvious. The areas with the highest scores were located mostly in the second circle, showing an ‘inverse core’ trend. These areas were divided into five types of zones, namely highest, high, medium, low, and lowest habitat sustainability. The built environment sustainability levels of streets and the economic, social, and environmental sustainability levels of districts were differentiated spatially at a large scale, i.e., there were notable differences in the built environment sustainability levels of various sustainable development type districts. Each sustainable development type zone featured built environment type zones with a high degree of overlap. The streets in the synergistic development type zones were all of the highest and high habitat sustainability types, ascribed to areas with coordinated economic, social, and environmental development having highly diverse and accessible public service facilities within their streets and a good overall level of built environment. Owing to a lack of diversity and accessibility in ecologically high-quality areas of the capital city, despite their relatively low population density, as a result of their distance from various urban facilities, ecologically biased districts primarily overlapped with medium and low habitability sustainable streets. Compared with the city center, outlying areas were mainly low-growth areas, with good infrastructure development, easy access to public services, and relatively moderate population densities, which accounted for the highest percentage of highest habitat sustainable streets being located in such low-growth areas.

5.2 Rethinking the value orientation of sustainable urban development

As cities first started to form, the idea of sustainable development emerged. The objectives of sustainable urban development have changed gradually, and the scale of the research focus has evolved dramatically, as contemporary urban challenges have grown more complicated (Figure 7). Early on, the concept of sustainability was conveyed primarily through the wise use of resources. Although the concept of sustainability did not originate until the 20th Century, agrarian societies had long expressed concepts similar to it (Gong, 1996). Environmental problems, such as air, water, and noise pollution, and resource waste have evolved since the Industrial Revolution owing to accelerated urban expansion. The United Nations Conference on the Human Environment urged, “…an urgent need to regulate urbanization, pay attention to population growth, and design human settlements to avoid adverse environmental impacts” in recognition of the significant burden that population growth places on the environment. An important development in understanding urban population capacity is the carrying capacity of resources and the environment (Sun et al., 2020; Hsu et al., 2021; Wang, 2022). After World War II, capitalist nations experienced rapid economic growth, but the ecological limitations of dense populations, intensive production, and expanding transportation systems were primary barriers to urban development (Fu et al., 2020). There is broad consensus among academics that the interaction between urbanization and natural restrictions is a main factor contributing to urban problems (Seto et al., 2011). A reduced level of living comfort, lack of competitive investment environment, and slowing of economic growth are the main effects of the deteriorating ecological environment on urbanization (Fang et al., 2017). Maintaining sustainable economic, social, and ecological well-being and progressing toward a dynamic balance of the three factors have become the emphasis of sustainable urban construction because of the social and environmental effects of the rapid urbanization process are recognized (Mori and Yamashita, 2015; Liang et al., 2022). By the 1990s, the spatial imbalance of economic and social activities brought about by rapid urban growth had become so dire that sustainable urban development had to be extended down to the neighborhood level (Luederitz et al., 2013). “The Bristol Accord” stipulates that sustainable communities should, “meet the demands of existing and future people, and provide quality services, equitable opportunities, and a good quality of life for all” (UK Presidency, 2005). Over time, urban governance has been improved by increasing microspatial sustainability. The degree of connection between diverse areas has increased progressively in recent years as a result of the regular mobility of various elements within cities. It is critical to conclude the shift from elemental governance to systemic governance and to break the research bottleneck of isolated work in which each region is divided and various systems are independent to meet the practical needs of ‘one map’ of territorial spatial governance. The modern era has made accurate diagnosis and evaluation of complicated multiscale spatial relationships a critical road to increasing the efficacy of urban government policies and initiatives. The status quo issues, development objectives, and realization paths vary greatly between various urban locations in megacities like Beijing, Shanghai, and Shenzhen, and the spatial coupling interactions are intricate and varied. Each metropolitan area’s distinctiveness and continuity are taken into account by the multi-scale evaluation framework of sustainable cities, which also offers a thorough multi-scale control system for implementation.
Figure 7 History of studies on sustainable cities
[1]
Andersson E, Janssen H, Ham M V et al., 2023. Contextual poverty and obtained educational level and income in Sweden and the Netherlands: A multi-scale and longitudinal study. Urban Studies, 60(5): 885-903.

DOI

[2]
Berardi U, 2013. Sustainability assessment of urban communities through rating systems. Environment, Development and Sustainability, 15(6): 1573-1591.

DOI

[3]
Bolster A, Burgess S, Johnston R et al., 2007. Neighbourhoods, households and income dynamics: A semi-parametric investigation of neighbourhood effects. Journal of Economic Geography, 7(1): 1-38.

DOI

[4]
Bouzguenda I, Alalouch C, Fava N, 2019. Towards smart sustainable cities: A review of the role digital citizen participation could play in advancing social sustainability. Sustainable Cities and Society, 50: 101627.

DOI

[5]
Carvalho M J, Melo-Gonçalves P, Teixeira J C et al., 2016. Regionalization of Europe based on a K-Means Cluster Analysis of the climate change of temperatures and precipitation. Physics and Chemistry of the Earth, Parts A/B/C, 94: 22-28.

DOI

[6]
Cervero R, Kockelman K, 1997. Travel demand and the 3Ds: Density, design and diversity. Transportation Research Part D, 2(3): 199-219.

DOI

[7]
Chen W, Chi G, 2022. Urbanization and ecosystem services: The multi-scale spatial spillover effects and spatial variations. Land Use Policy, 114: 105964.

DOI

[8]
Deng W, Peng Z, Tang Y, 2019. A quick assessment method to evaluate sustainability of urban built environment: Case studies of four large-sized Chinese cities. Cities, 89: 57-69.

DOI

[9]
Deng Y, Qi W, Fu B et al., 2020. Geographical transformations of urban sprawl: Exploring the spatial heterogeneity across cities in China 1992-2015. Cities, 105: 102415.

DOI

[10]
Ding X, Zhong W, Shearmur R G et al., 2015. An inclusive model for assessing the sustainability of cities in developing countries: Trinity of Cities’ Sustainability from Spatial, Logical and Time Dimensions (TCS-SLTD). Journal of Cleaner Production, 109: 62-75.

DOI

[11]
Dong Q, Yi P, Li W et al., 2022. Evaluation of city sustainability using the HGRW method: A case study of urban agglomeration on the West Side of the Straits, China. Journal of Cleaner Production, 358: 132008.

DOI

[12]
Ewing R, Cervero R, 2010. Travel and the Built Environment. Journal of the American Planning Association, 76(3): 265-294.

DOI

[13]
Fang C, Zhou C, Gu C et al., 2017. A proposal for the theoretical analysis of the interactive coupled effects between urbanization and the eco-environment in mega-urban agglomerations. Journal of Geographical Sciences, 27(12): 1431-1449.

DOI

[14]
Feng Y, Zou L, Yuan H et al., 2022. The spatial spillover effects and impact paths of financial agglomeration on green development: Evidence from 285 prefecture-level cities in China. Journal of Cleaner Production, 340: 130816.

DOI

[15]
Frini A, Benamor S, Urli B, 2020. Temporal MCDA methods for decision-making in sustainable development context. In: Kulshreshtha S N (ed.), Sustainability Concept in Developing Countries. IntechOpen, Rijeka.

[16]
Fu S, Zhuo H, Song H et al., 2020. Examination of a coupling coordination relationship between urbanization and the eco-environment: A case study in Qingdao, China. Environmental Science and Pollution Research, 27(19): 23981-23993.

DOI

[17]
Gong J, 1996. On the idea and concept of sustainable development. China Population, Resources and Environment, ( 3): 9-13.

[18]
Gonzalez-Garcia S, Manteiga R, Moreira M T et al., 2018. Assessing the sustainability of Spanish cities considering environmental and socio-economic indicators. Journal of Cleaner Production, 178: 599-610.

DOI

[19]
Grodach C, 2011. Barriers to sustainable economic development: The Dallas-Fort Worth experience. Cities, 28(4): 300-309.

DOI

[20]
Haider H, Hewage K, Umer A et al., 2018. Sustainability assessment framework for small-sized urban neighbourhoods: An application of fuzzy synthetic evaluation. Sustainable Cities and Society, 36: 21-32.

DOI

[21]
Halla P, Merino-Saum A, 2022. Conceptual frameworks in indicator‐based assessments of urban sustainability: An analysis based on 67 initiatives. Sustainable Development, 30(5): 1056-1071.

DOI

[22]
Hassan A M, Lee H, 2015. The paradox of the sustainable city: Definitions and examples. Environment, Development and Sustainability, 17(6): 1267-1285.

[23]
Hodson M, Marvin S, 2017. Intensifying or transforming sustainable cities? Fragmented logics of urban environmentalism. Local Environment, 22(Suppl.1): 8-22.

DOI

[24]
Hsu W-L, Shen X, Xu H et al., 2021. Integrated evaluations of resource and environment carrying capacity of the Huaihe River Ecological and Economic Belt in China. Land, 10(11): 1168.

DOI

[25]
Huang J, Hu X, Wang J et al., 2023. How diversity and accessibility affect street vitality in historic districts? Land, 12(1): 219.

DOI

[26]
Jahn S, Newig J, Lang D J et al., 2022. Demarcating transdisciplinary research in sustainability science: Five clusters of research modes based on evidence from 59 research projects. Sustainable Development, 30(2): 343-357.

DOI

[27]
Jing F, Glass T A, Curriero F C et al., 2010. The built environment and obesity: A systematic review of the epidemiologic evidence. Health & Place, 16(2): 175-190.

[28]
Kong Q, Kong H, Miao S et al., 2022. Spatial coupling coordination evaluation between population growth, land use and housing supply of urban agglomeration in China. Land, 11(9): 1396.

DOI

[29]
Li G, Zhang J, 2015. Research on the transformation characteristic and driving mechanism of Chinese capital economy and the countermeasures on that. China Business and Market, 29(8): 40-46.

[30]
Li L, Li X, Niu N et al., 2023. Uneven impacts of COVID-19 on residents’ utilization of urban parks: A case study of Guangzhou, China. Applied Geography, 153: 102905.

DOI

[31]
Li W, Yi P, 2020. Assessment of city sustainability: Coupling coordinated development among economy, society and environment. Journal of Cleaner Production, 256: 120453.

DOI

[32]
Liang Y, Yi P, Li W et al., 2022. Evaluation of urban sustainability based on GO-SRA: Case study of Ha-Chang and mid-southern Liaoning urban agglomerations in northeastern China. Sustainable Cities and Society, 87: 104234.

DOI

[33]
Liu K, Lin B, 2019. Research on influencing factors of environmental pollution in China: A spatial econometric analysis. Journal of Cleaner Production, 206: 356-364.

DOI

[34]
Luederitz C, Lang D J, Von Wehrden H, 2013. A systematic review of guiding principles for sustainable urban neighborhood development. Landscape and Urban Planning, 118: 40-52.

DOI

[35]
Lurka A, 2021. Spatio-temporal hierarchical cluster analysis of mining-induced seismicity in coal mines using Ward’s minimum variance method. Journal of Applied Geophysics, 184: 104249.

DOI

[36]
Mayer A L, 2008. Strengths and weaknesses of common sustainability indices for multidimensional systems. Environment International, 34(2): 277-291.

PMID

[37]
Michalina D, Mederly P, Diefenbacher H et al., 2021. Sustainable urban development: A review of urban sustainability indicator frameworks. Sustainability, 13(16): 9348.

DOI

[38]
Mori K, Yamashita T, 2015. Methodological framework of sustainability assessment in city sustainability index (CSI): A concept of constraint and maximisation indicators. Habitat International, 45: 10-14.

DOI

[39]
Mouratidis K, 2021. Urban planning and quality of life: A review of pathways linking the built environment to subjective well-being. Cities, 115: 103229.

DOI

[40]
O’Connor S, Doyle E, Doran J, 2018. Diversity, employment growth and spatial spillovers amongst Irish regions. Regional Science and Urban Economics, 68: 260-267.

DOI

[41]
Ogasawara Y, Kon M, 2021. Two clustering methods based on the Ward’s method and dendrograms with interval-valued dissimilarities for interval-valued data. International Journal of Approximate Reasoning, 129: 103-121.

DOI

[42]
Petrović A, Van Ham M, Manley D, 2022. Where do neighborhood effects end? Moving to multiscale spatial contextual effects. Annals of the American Association of Geographers, 112(2): 581-601.

DOI

[43]
Qu Y, Jiang G, Yang Y et al., 2018. Multi-scale analysis on spatial morphology differentiation and formation mechanism of rural residential land: A case study in Shandong province, China. Habitat International, 71: 135-146.

DOI

[44]
Seto K C, Fragkias M, Güneralp B et al., 2011. A meta-analysis of global urban land expansion. PLoS ONE, 6(8): e23777.

DOI

[45]
Sharifi A, Murayama A, 2013. A critical review of seven selected neighborhood sustainability assessment tools. Environmental Impact Assessment Review, 38: 73-87.

DOI

[46]
Shirazi M R, Keivani R, Brownill S et al., 2020. Promoting social sustainability of urban neighbourhoods: The case of Bethnal Green, London. International Journal of Urban and Regional Research, 1468-2427.12946.

[47]
Sinaga K P, Yang M-S, 2020. Unsupervised K-Means Clustering Algorithm. IEEE Access, 8: 80716-80727.

DOI

[48]
Sun M, Wang J, He K, 2020. Analysis on the urban land resources carrying capacity during urbanization: A case study of Chinese YRD. Applied Geography, 116: 102170.

DOI

[49]
Tan P Y, Samsudin R, 2017. Effects of spatial scale on assessment of spatial equity of urban park provision. Landscape and Urban Planning, 158: 139-154.

DOI

[50]
Tian G, Wu J, Yang Z, 2010. Spatial pattern of urban functions in the Beijing metropolitan region. Habitat International, 34(2): 249-255.

DOI

[51]
Too L, Earl G, 2010. Public transport service quality and sustainable development: A community stakeholder perspective. Sustainable Development, 18(1): 51-61.

DOI

[52]
UK Presidency, 2005. Conclusions of ministerial informal meeting on sustainable communities in Europe [known as Bristol Accord]. London: ODPM.

[53]
UN, 2015. Transforming Our World: The 2030 Agenda for Sustainable Development. New York: United Nations.

[54]
UN-Habitat, 2001. Sustainable Cities Programme 1990-2000: A decade of United Nations support to broad-based participatory management of urban development. Nairobi: UN-Habitat.

[55]
Wang B, Lei Y, Wang C et al., 2022. The spatio-temporal impacts of the built environment on urban vitality: A study based on big data. Scientia Geographica Sinica, 42(2): 274-283. (in Chinese)

DOI

[56]
Wang B, Tian J, Yang P et al., 2021. Multi-scale features of regional poverty and the impact of geographic capital: A case study of Yanbian Korean autonomous prefecture in Jilin province, China. Land, 10(12): 1406.

DOI

[57]
Wang Q, Xu Z, Yuan Q et al., 2020. Evaluation and countermeasures of sustainable development for urban energy-economy-environment system: A case study of Jinan in China. Sustainable Development, 28(6): 1663-1677.

DOI

[58]
Wang S, Yang F-L, Xu L et al., 2013. Multi-scale analysis of the water resources carrying capacity of the Liaohe Basin based on ecological footprints. Journal of Cleaner Production, 53: 158-166.

DOI

[59]
Wang W, Cao K, Lin J, 2022. Research progress and prospects for multiscale assessment framework and indicator system for sustainable cities. Urban Development Studies, 29(11): 1-7.

[60]
Wang X, 2022. Managing land carrying capacity: Key to achieving sustainable production systems for food security. Land, 11(4): 484.

DOI

[61]
Winston N, 2022. Sustainable community development: Integrating social and environmental sustainability for sustainable housing and communities. Sustainable Development, 30(1): 191-202.

DOI

[62]
Wu J, 2013. Landscape sustainability science: Ecosystem services and human well-being in changing landscapes. Landscape Ecology, 28(6): 999-1023.

DOI

[63]
Xia X, Lin K, Ding Y et al., 2021. Research on the coupling coordination relationships between urban function mixing degree and urbanization development level based on information entropy. International Journal of Environmental Research and Public Health, 18(1): 242.

DOI

[64]
Xiao Y, Chen J, Wang X et al., 2022. Regional green development level and its spatial spillover effects: Empirical evidence from Hubei province, China. Ecological Indicators, 143: 109312.

DOI

[65]
Xie Y, Dai H, Dong H et al., 2016. Economic impacts from PM2.5 pollution-related health effects in China: A provincial-level analysis. Environmental Science & Technology, 50(9): 4836-4843.

DOI

[66]
Xue B, Liu B, Yang Q et al., 2021. Formalizing an evaluation-prediction based roadmap towards urban sustainability: A case study of Chenzhou, China. Habitat International, 112: 102376.

DOI

[67]
Yi P, Li W, Zhang D, 2021. Sustainability assessment and key factors identification of first-tier cities in China. Journal of Cleaner Production, 281: 125369.

DOI

[68]
Yigitcanlar T, Dur F, Dizdaroglu D, 2015. Towards prosperous sustainable cities: A multiscalar urban sustainability assessment approach. Habitat International, 45: 36-46.

DOI

[69]
Zhang X, Liu Y, Tleubergenova A et al., 2022. Evaluation of urban sustainability based on development structures and economic aggregates: A case study of Jiaxing, China. Sustainability, 14(17): 10683.

DOI

[70]
Zhao J, Ji G, Tian Y et al., 2018. Environmental vulnerability assessment for mainland of China based on entropy method. Ecological Indicators, 91: 410-422.

DOI

[71]
Zheng S, Yang S, Ma M et al., 2023. Linking cultural ecosystem service and urban ecological-space planning for a sustainable city: Case study of the core areas of Beijing under the context of urban relieving and renewal. Sustainable Cities and Society, 89: 104292.

DOI

[72]
Zhou G, Li C, Li M et al., 2016. Agglomeration and diffusion of urban functions: An approach based on urban land use conversion. Habitat International, 56: 20-30.

DOI

[73]
Zhou Y, Wu T, Wang Y, 2022. Urban expansion simulation and development-oriented zoning of rapidly urbanising areas: A case study of Hangzhou. Science of The Total Environment, 807: 150813.

DOI

[74]
Zhu Z, He Q, Qin W, 2020. Spatial livability of residential areas in Changsha city. Scientia Geographica Sinica, 40(11): 1859-1867. (in Chinese)

DOI

[75]
Zumelzu A, Gruehn D, Hosni J, 2019. Assessment of sustainability of the built environment in Latin American neighbourhoods: Five cases in southern Chile. IOP Conference Series: Earth and Environmental Science, 297(1): 012040.

Outlines

/