Research Articles

Polycentric urban development with state-led administrative division adjustment: A policy insight for urban spatial transformation

  • CHEN Youlin , 1, 2 ,
  • YU Peiheng , 3, * ,
  • WANG Lei 1, 2 ,
  • CHEN Yiyun 4 ,
  • YUNG Hiu Kwan Esther 3
Expand
  • 1. School of Economics and Management, Wuhan University, Wuhan 430072, China
  • 2. Institute of Central China Development, Wuhan University, Wuhan 430072, China
  • 3. Department of Building and Real Estate, Research Institute of Sustainable Urban Development, The Hong Kong Polytechnic University, Hong Kong 999077, China
  • 4. School of Resource and Environmental Science, Wuhan University, Wuhan 430079, China
* Yu Peiheng (1997-), PhD Candidate, specialized in human geography and urban sustainability. E-mail:

Chen Youlin (1997-), PhD Candidate, specialized in human geography and regional economy. E-mail:

Received date: 2023-02-10

  Accepted date: 2023-09-12

  Online published: 2023-12-14

Supported by

National Social Science Foundation of China(18ZDA040)

Humanities and Social Sciences Planning Project of the Ministry of Education in China(19YJA630079)

Abstract

Polycentric urban development has profound impacts on urban development worldwide. Most studies have identified its complex drivers of social economy and natural condition while ignoring the state-led policy factors. In recent years, China has undergone dramatic administrative division adjustment (ADA) during the process of unique state-led urbanization. However, as a crucial government strategy, the impacts of ADA on urban polycentricity remain unclear. This research investigates the relationship between ADA and urban polycentricity through spatial difference-in-differences models. The results reveal that ADA has contributed to the polycentric urban development in China. Specifically, boundary restructuring has more substantial impacts than hierarchy reorganization. In addition, ADA has significantly promoted urban polycentricity in local cities in central China and neighbouring cities in eastern China, while it has no significant effects in western China. Furthermore, ADA reshapes urban polycentricity mainly by the influencing mechanism of construction land and industrial structure. Policymakers should consider the various ADA’s impacts on urban polycentricity with socio-economic conditions. This research provides a deeper insight into urban spatial transformation with state-led drivers.

Cite this article

CHEN Youlin , YU Peiheng , WANG Lei , CHEN Yiyun , YUNG Hiu Kwan Esther . Polycentric urban development with state-led administrative division adjustment: A policy insight for urban spatial transformation[J]. Journal of Geographical Sciences, 2023 , 33(12) : 2400 -2424 . DOI: 10.1007/s11442-023-2182-y

1 Introduction

Since the beginning of the Anthropocene, the Earth has undergone unprecedented urbanization (Wakefield, 2022). 68% of the world’s population will migrate to urban regions by 2050, which may cause the evolution towards a compact urban form and bring urban issues such as energy inefficiency, heat island effect, traffic congestion and environmental pollution (Kaza, 2020). Urban planners and policymakers have long been dedicated to finding effective planning strategies to mitigate these issues caused by urban growth. The strategy of the polycentric urban structure is one of them. The strategies of urban polycentric structures are adopted worldwide, such as to understand regional gaps and regional cohesion in Europe (Meijers et al., 2007), to support the rise of employment sub-centers and urban sprawl in North America (Maldonado et al., 2014) and to alleviate the urban excessive centralization in Japan (Liu et al., 2020a). Urban polycentric structure, as a critical urban structure, has diverse impacts on regional development (Zhang et al., 2017). On the one hand, moderate urban polycentric structures have socio-economic competitiveness to improve accessibility, reduce congestion and enhance economic development (Parr, 2004). On the other hand, excessively decentralized polycentric structures also have negative impacts, such as unequal facilities, social and spatial segregation and economic disparities (Sun et al., 2019). Therefore, urban polycentricity plays an increasingly important role in city and regional development and it is necessary to further investigate the evolutionary process of urban polycentricity.
As a complex evolutionary process, polycentric urban development is the consequence of numerous elements. Compared with the natural, economic and social factors, the deep-rooted political interference in the administrative system is an important driving force for China’s urbanization development, which has profound influences on urban spatial transformation (Feng and Wang, 2021). Notably, the production of urban space and city-making in China are essentially state projects (Liu et al., 2012). By the administrative orders handed down through the highly effective administrative/spatial hierarchy of the local party-state, the polycentric urban structure may be affected by top-down government policies and urban planning (Cheng and Shaw, 2018). However, state-dominated factors such as government interventions and administrative structure changes have rarely been taken into account (Li and Derudder, 2022). Recently, China has undergone frequent administrative division adjustment (ADA), which offers an interesting analytical lens to comprehensively explore polycentric urban development.
China’s dramatic urbanization has compressed into a few decades which can hardly be seen in other countries, leading to population concentration, urban sprawl, industrial restructuring and land use alteration in the majority of cities (Friedmann, 2006; Chien and Woodworth, 2018). Such rapid urbanization has not only achieved great economic performance and successful urban development but also led to a mismatch between high urbanization levels and low administrative hierarchy, making irrational urban scale systems and resource allocation (Guan et al., 2018). To alleviate socio-economic inequalities caused by the mismatch between administrative division and urbanization development, China has implemented the ADA (Chen et al., 2023). During the implementation process of ADA, the urban structure may be reshaped and optimized by state intervention and power adjustment. In addition, ADA may shift the urban policy preferences in terms of resource distribution, taxation systems and government expenditure allocations, resulting in urban spatial transformation indirectly. Hence, further investigation is necessary to explore the impacts of ADA on China’s urban polycentricity, which will also help us further understand the state-led driving forces of urban spatial transformation.
Given the above, this study aims to explore the impact of state-led ADA on polycentric urban development in China. Theoretically, to the best of our knowledge, this is the first research to quantify the impact of ADA on China’s polycentric urban development. It provides new insight into the policy-driving mechanism of urban polycentric structure transformation. Practically, this study presents relevant recommendations and implications based on the research of spatial spillover effects, heterogeneity analysis and mechanism identification. It provides strong support for national ADA policy development and urban polycentric planning. Methodologically, the impact of ADA on urban polycentricity is examined by introducing a spatial difference-in-difference (SDID) model using ADA as a quasi-natural experiment. It can better contribute to a deeper understanding of policy evaluation through comparing differences between treated and nontreated cities of policy implementation.

2 Literature review

2.1 State-led polycentric urban development in the Chinese context

Due to the unique political system and urban planning strategies, the trajectory of urban polycentricity in China differs significantly from that of Western countries. In the Western context, the impacts of state-led factors on urban polycentricity are limited. The transformation of urban spatial structure is mainly shaped by spontaneous and anarchical urbanization (Li and Derudder, 2022). However, urban polycentricity in China has been largely governed by state-mandated urbanization. In pre-reform China, the command economy of the central government rather than the local governments played an important role in urban planning (Liu et al., 2012). Under the hierarchical administrative division system, the central government strictly controlled the population density, fiscal power and industrial structure of cities. Moreover, due to the dualistic urban-rural system, resources tended to be concentrated in urban areas, while the development of villages and towns around cities was restricted, making it difficult to form new growth poles (Chen et al., 2020). After the reform and opening up, the triple shift towards decentralization, marketization and globalization has reformed the urban growth process in China (Wei, 2012). Even though non-state factors such as foreign direct investors, global exchange networks and market economic systems have reconfigured urban spatial transformation, state factors including political and institutional powers remained overwhelming influences (He et al., 2008; Yu et al., 2023a). Thus, it is essential to analyse urban polycentricity with a view of state-led factors for deepening our understanding of the new type urbanization in China.

2.2 The impact of administrative division adjustment on urban function and urban form

Due to the positive role of ADA on regional governance and socio-economic development, most studies have interested in urban function rather than urban form (Wang and Feng, 2021). Numerous ADA-related research has focused on economic functions such as urban entrepreneurialism (Chien, 2013), economies of scale (Yarram et al., 2022), economic growth (Gao and Long, 2014) and fiscal independence (Jiang, 2022). The main social functions of ADA concern included population agglomeration (Ma and Cui, 1987; Yu et al., 2018), coordinated urban-rural development (Xu et al., 2018), housing market regulation (Zhang et al., 2022), transport networks (Wei et al., 2021) and regional accessibility (Zhu et al., 2012). As for ecological functions, the ADA is interested in air pollution control (Feng et al., 2022), water resources management (Martínez et al., 2012), land use intensity (Wang et al., 2021), land sprawl (Li et al., 2015) and landscape patterns (Fan et al., 2022). However, ADA is also associated with the spatial configuration of inhabitants and societies, resulting in a great influence on urban form (Živković, 2019). The polycentric structure of urban morphology could reflect the scale and spatial distribution of resource allocation and reveal the spatial effects of ADA. To date, little research has examined the effects of ADA on the polycentricity of urban form.

2.3 Scale characteristics of administrative division adjustment and urban polycentricity

Considering the urban spatial structure as a comprehensive concept, previous studies on the relationship between ADA and polycentricity can be mainly divided into macro and micro scale categories (Sharifi, 2019). Macro-scale studies emphasize the impact of the ADA on the overall structure and network relationship of regional areas and urban agglomerations, rather than on urban attributes only (Wang and Wang, 2020; Yu et al., 2023b). Some macro-scale elements are landscape pattern (Zeng et al., 2018), urban scale (Feng and Wang, 2021) and development type (Huxley, 2020). Micro-scale studies reveal the main effect of ADA on local linkages or local structure within cities (Li and Dang, 2008; Zhen et al., 2010) and concentrate on the impact of ADA on individual instance cities, rather than representing general objectivity. However, the meso-scale structure has been largely overlooked, which focuses on interrelated grouping characteristics within cities, including polycentric structures that account for core-periphery interactions (Rombach et al., 2014; Zhang and Thill, 2019). This research aims to identify the influences of the ADA in terms of meso-scale characteristics and to enrich the understanding of the factors that determine the urban spatial structure.

2.4 Mechanisms through which administrative division adjustment affects polycentric urban development

The ADA could affect the urban form mainly by the way of boundary restructuring and hierarchy reorganization. Boundary restructuring means the changes in administrative district spatial reorganization, which can break the fixed administrative boundaries and administrative space, reshaping urban form directly (Zeng et al., 2017). Hierarchy reorganization such as turning county into district refers to the administrative district types change, which can affect the fundamental level and management power of administrative divisions (Wang and Yeh, 2020). Different from globalized, marketization and decentralized approaches of regional governance, the ADA can influence spatial transformation by stimulating a shift in the socio-economic management and resource allocation of local governments through changes in administrative rank or territorial size. Under the influence of administrative changes by ADA, cities that increase in administrative rank and expand in size tend to enjoy more power and can therefore promote urban development through administrative means such as land and industrial policies (Yu et al., 2018). For example, the ADA changes the degree of autonomy and approval of land use planning, which in turn provides large-scale sites for urban development and changes its original spatial form (Wu and Zhang, 2012). In addition, the ADA has facilitated the transfer of the agricultural sector to the non-agricultural sector, stimulated the development of industry and infrastructure, and guided the functional division and spatial reconfiguration of cities (Feng and Wang, 2022). Through sub-urban development such as land expansion and industrial construction, most cities with ADA have generated financial income and achieved urban renewal, facilitating urban spatial transformation and polycentric form. However, the population and industrial demands of some cities have not kept pace with the speed of sub-urban development due to the blind expansion with ADA, which may have negative impacts on urban spatial transformation and polycentricity (Wang and Zhang, 2022). Therefore, there is an urgent need to identify the underlying mechanisms of the complex relationship between ADA and urban polycentricity.

2.5 Research approach of administrative division adjustment and urban polycentricity

Existing research approaches related to the influences of ADA on urban spatial structure are methodologically fragmented. Due to the unavailability of sufficient monitoring data, the major research paid attention to qualitative assessment of ADA, including questionnaires, in-depth interviews and case studies, while neglecting quantitative assessment (Liu and Lo, 2022). The few studies related to quantitative assessment have mostly focused on the spatiotemporal evolution of urbanization by geospatial analysis, but ignore the policy effects of ADA (Zeng et al., 2016; Yu et al., 2018). Econometric models associated with policy evaluation have been utilized less frequently to examine the quantitative influence of the ADA on the polycentric urban structure. In addition, spatial linkages of urban polycentric development between different cities are considerable (Chen et al., 2022). However, previous research disregarded the spatial spillover effects of ADA on urban polycentric structures. ADA exerts influence on urban polycentricity that extends beyond local regions, extending its impact to surrounding regions by reshaping the flow and spatial layout of resources. Consequently, ignoring spatial spillover effects cannot accurately reflect the ADA’s comprehensive effects. As a special type of spatial econometric model, the SDID model could both consider the policy effect and spatial spillover effects (Tan et al., 2022). This study adopts SDID to fill the gap in the research approach of policy evaluation and spatial relationship analysis of ADA and urban polycentricity.

3 Conceptual framework

Based on the literature review above, this study establishes a conceptual framework to examine the relationship between ADA and urban polycentric development. This conceptual framework could provide valuable guidance for achieving urban spatial transformation under state-led factors. As Figure 1 shows, we discuss the spatial spillover effects of ADA on polycentric urban by the SDID model. Notably, we not only explore the impact of ADA on polycentric urban form but also refine the types of ADA into boundary restructuring and hierarchy reorganization. Because ADA may affect urban polycentricity by reshaping the resource flow between cities, the impacts of ADA in local regions and surrounding regions are examined. Next, we divide the research samples into eastern, central and western regions by their geographical location to explore the heterogeneity of the impact of ADA, due to the different socio-economic development contexts across regions in China. Last, by incorporating the role of industrial structure and construction land into the analysis, we investigate the mechanism identification.
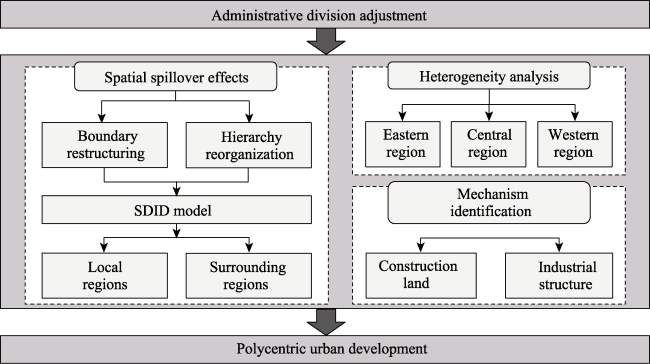
Figure 1 Conceptual framework of polycentric urban development with administrative division adjustment

4 Material and methods

4.1 Study area

Due to the availability of data, this study mainly explores the development of ADA and urban polycentricity at prefecture-level cities. Specifically, a total of 274 prefecture-level cities are selected as the primary research object (Figure 2). The policies of ADA have different emphases over time, focusing on increasing the number of cities between 1978 and 2003, on expanding the size of cities and towns from 2004 to 2012, and on improving the quality of urban development after 2013. Since urban polycentricity is usually considered a closely related structure to the quality of urban development, this study takes 2013 to 2018 as the main study period.
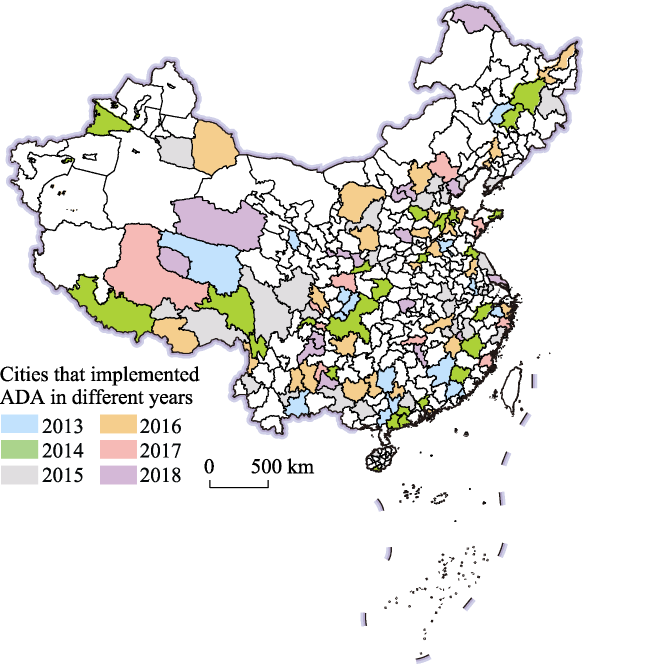
Figure 2 The geographic location of cities that implemented administrative division adjustment between 2013 and 2018

Note: This map is based on the standard map with approval number GS(2020)4619 downloaded from the standard map service website of the National Bureau of Surveying, Mapping, and Geographic Information, and the base map has not been modified.

4.2 Data source

The ADA was measured using the data from the national administrative division information inquiry platform (http://xzqh.mca.gov.cn/map). The high-resolution remote sensing data for identifying polycentric urban structures were sourced from the LandScan™ global population dataset (http://landscan.ornl.gov). Other socio-economic data were obtained from the China Statistical Yearbook and China City Statistics Yearbook (http://data.cnki.net/trade/Yearbook/Single/N2022040095?zcode=Z007).

4.3 Methods

4.3.1 Measurement of urban polycentricity

Although there is no universally accepted definition, most studies have defined and measured polycentric urban structure in terms of both morphological and functional dimensions. The size and distribution of the individual centers determine the polycentric morphological structure. The functional polycentric structure concerns the flow of socio-economic elements between individual centers (Sun et al., 2019). Given the difficulty of measuring intra-center flows between cities, a morphological definition of the polycentric structure was employed to identify the level of polycentric urban structure (POLY). The centers were determined by the spatial distribution of population size within the city from the LandScan™ population dataset. This study established a relatively minimal cut-off at the 95-percentile level of urban population density and selected the top 5% of the LandScan™ grid to obtain the most densely populated grid in the city. Because a population center should be a continuous area with a high population, following the approach of Liu and Wang (2016), grid clusters having a population of over 100,000 and an area of more than 3 km² were selected and designated as urban centers to improve the accuracy. Finally, the POLY was measured by examining the standard deviation between different centers (Green, 2007). The specific formula is expressed as:
$POLY=1-\frac{{{\sigma }_{obs}}}{{{\sigma }_{max}}}$
where POLY represents the level of polycentric urban structure within the city; σobs denotes the standard deviation of the population-based size of individual centers within the city; σmax is the standard deviation between zero and the maximum population-based size.

4.3.2 Exploratory spatial data analysis

Exploratory spatial data analysis (ESDA) is a collection of techniques used to explore and analyse spatial patterns in data. In this study, the spatial patterns of POLY was evaluated by ESDA based on GeoDa software (Anselin, 2010). Specifically, the spatial autocorrelations of POLY are revealed using global Moran’s I index. Global Moran’s I index reveals whether or not spatial clustering and spatial dispersion are present in the entire region (Yu, et al., 2022). The mathematical expression is as follows:
$GMI=\frac{n\mathop{\sum }_{i=1}^{n}\mathop{\sum }_{j=1}^{n}{{W}_{ij}}\left( {{x}_{i}}-\bar{x} \right)\left( {{x}_{j}}-\bar{x} \right)}{\mathop{\sum }_{i=1}^{n}\mathop{\sum }_{j=1}^{n}{{W}_{ij}}\mathop{\sum }_{i=1}^{n}{{\left( {{x}_{i}}-\bar{x} \right)}^{2}}}$
where GMI represents the global Moran’s I index. n denotes the total of observation cities. xi and xj denote the POLY levels in i th city and j th city, respectively. $\bar{x}$ is the average POLY level of all observation cities and Wij is the spatial weight matrix between i th city and j th city. The values of GMI ranges from –1 to 1. Near to 1 and –1 imply significant positive and negative spatial correlations, respectively, whereas close to 0 indicates weak spatial correlation.

4.3.3 Spatial difference-in-difference model

Although the spatial econometric model could effectively account for the spatial dependence that exists among observations, it neglects the causal effect of policy interventions (Jia et al., 2021). The difference-in-difference (DID) model is one of the frequently used methods for assessing policy effectiveness, but it focuses only on specific individuals affected by policy shocks and ignores spatial interactions among individuals (Anselin and Arribas-Bel, 2013). The SDID model is a combination of DID and spatial econometric models, which could both estimate the causal effect of policy interventions and control for the spatial dependence among units (Tan et al., 2022). Based on the spatial weight matrix and the dummy variables setting of time and region, the SDID model could compare the differences in policy and spatial effects between treated areas and nontreated areas before and after policy implementation (Du et al., 2021). The SDID model is adopted to identify the influences of ADA on POLY, and the formula is expressed as follows:
$POL{{Y}_{it}}=\alpha +\rho \sum\nolimits_{j}{{{w}_{ij}}}POL{{Y}_{jt}}+\beta AD{{A}_{it}}+\theta \sum\nolimits_{j}{{{w}_{ij}}}AD{{A}_{jt}}+\gamma {{X}_{it}}+\varphi \sum\nolimits_{j}{{{w}_{ij}}}{{X}_{jt}}+{{\mu }_{i}}+{{v}_{t}}+{{\varepsilon }_{it}}$
where POLYit denotes the polycentric morphological structure in city i and year t. ADA indicates whether or not a city has undergone administrative division adjustment, with values of 0 (did not occur) or 1 (occurred). X represents vectors of control variables. wij denotes spatial weight matrix, which was calculated based on the queen adjacency method. μ is the regional fixed effect; v is the time fixed effect. α denotes the constant. β is the coefficient for the independent variable. γ represents the coefficients of control variables. ρ, θ and φ denote the spatial lag coefficient of dependent, independent and control variables, respectively. ε is an error term.
In the SDID model, the dependent variable is POLY. The key independent variables are ADA, boundary restructuring and hierarchy reorganization. Moreover, the following control variables were employed after reviewing the research to increase the accuracy of this study. (1) The secondary sector of the economy (SE) is determined by the proportion of the secondary industry in the gross domestic product. (2) Road area (RA) is measured by paved road area per capita. (3) The population of the tertiary sector (TS) is calculated by a proportion of the total population in the tertiary sector. (4) Transport equipment (CA) is determined by the total number of cars in circulation. (5) Real estate development (IE) is assessed by total real estate investment. All variables listed above are described in Table 1.
Table 1 Definition and statistical description of the variables
Initials Variables Units Mean Standard deviation Min Max
POLY Urban polycentricity index 0.5199 0.1289 0.0093 0.9574
ADA Administrative division adjustment 0.2263 0.4185 0.0000 1.0000
BR Boundary restructuring 0.0882 0.2836 0.0000 1.0000
HR Hierarchy reorganization 0.1891 0.3917 0.0000 1.0000
SE Proportion of secondary industrial output in the national output % 0.4579 0.1136 0.0800 0.9205
RA Paved road area per capita 102 m 0.1364 0.0918 0.0117 1.0837
TS Ratio of population in tertiary sector to the total population % 0.5293 0.1441 0.1657 0.9448
CA Number of cars in circulation 104 cars 0.1699 0.3325 0.0046 3.8728
IE Net investment in real estate 1011 yuan 0.2739 0.5501 0.0007 4.2363

5 Empirical analysis

5.1 Spatiotemporal evolution of the urban polycentricity

Most of the cities that have undergone ADA during the study period also have experienced changes in their urban spatial structure. For example, Shanghai revoked Chongming county-level city to Chongming district in 2016. Hangzhou revoked Fuyang county-level city to Fuyang district in 2014. Chongqing revoked Bishan county-level city to Bishan district in 2014. Tianjin revoked Jinghai county-level city to Jinghai district in 2015. The ADA has not only promoted functional coverage and resource allocation but also facilitated the expansion of urban space. Furthermore, as shown in Figure 3, the regions with ADA in the case cities are more likely to have sub-centers, which may further affect the urban polycentric structure.
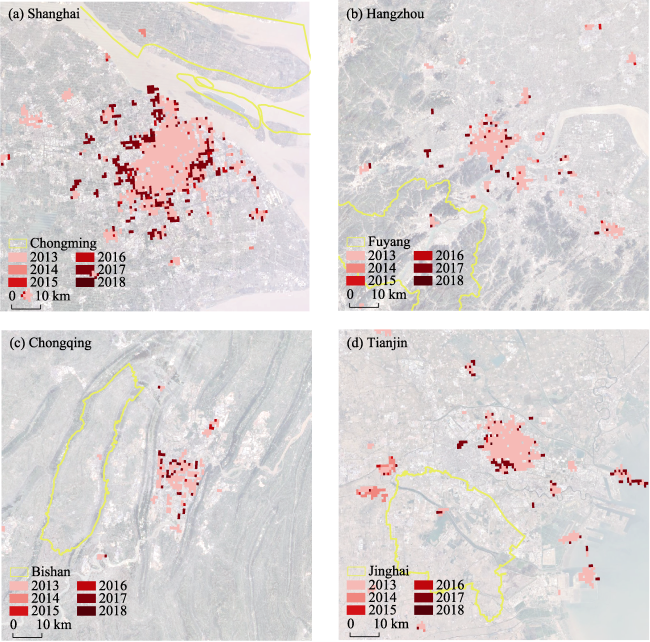
Figure 3 Regions with administrative division adjustment and population centers of four cities in China from 2013 to 2018. (a) Shanghai, (b) Hangzhou, (c) Chongqing and (d) Tianjin
The trends in the evolution of China’s polycentric urban structure between 2013 and 2018 are illustrated in Figure 4. Firstly, POLY indicates an upward trend in the majority of cities. Secondly, the eastern and north-eastern regions in China have higher POLY values, whereas central and western regions have lower POLY values. Thirdly, the growth rates of POLY vary by location. The growth of POLY along the economically developed eastern seaboard regions was insignificant. The economically underdeveloped region such as central and western China has greatly increased the POLY value. These findings indicate serious spatial inequality in developing China’s polycentric urban structures.
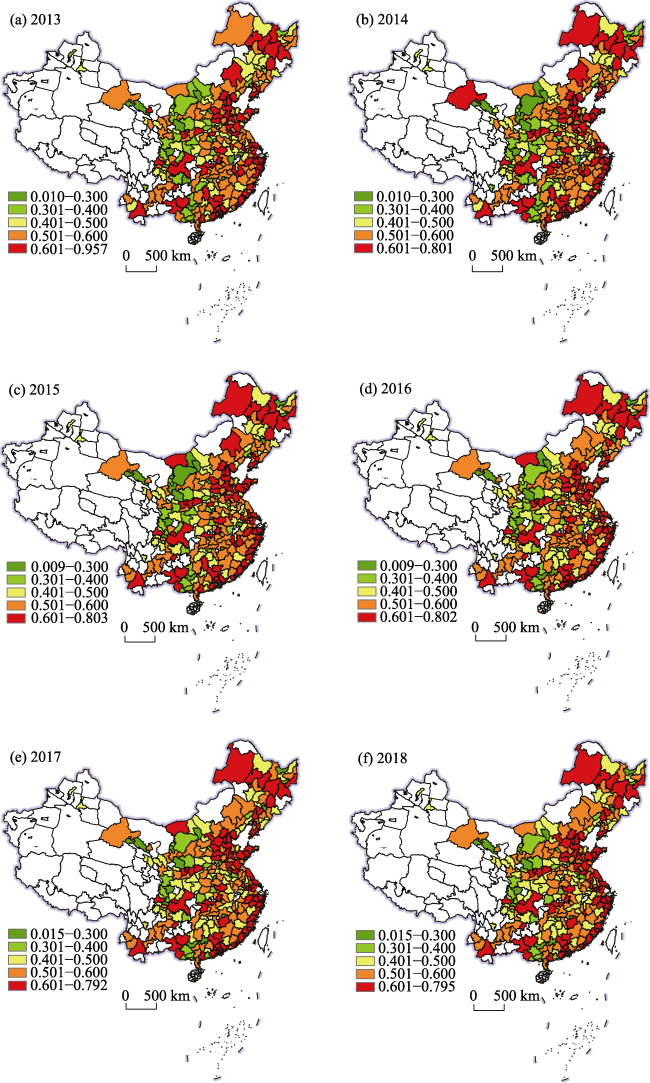
Figure 4 The spatiotemporal evolution of urban polycentricity in China in different years: (a) 2013, (b) 2014, (c) 2015, (d) 2016, (e) 2017 and (f) 2018

Note: This map is based on the standard map with approval number GS(2020)4619 downloaded from the standard map service website of the National Bureau of Surveying, Mapping, and Geographic Information, and the base map has not been modified.

The global Moran’s I index was applied to determine the spatial correlation of the entire region. The results in Table 2 reveal that the global Moran’s I index is considered positive during the study period, thereby demonstrating a positive spatial correlation of POLY amongst different cities. The types of spatial correlations of POLY display high-high and low-low aggregation, as illustrated by the scatter plot of the global Moran’s I index in Figure 5.
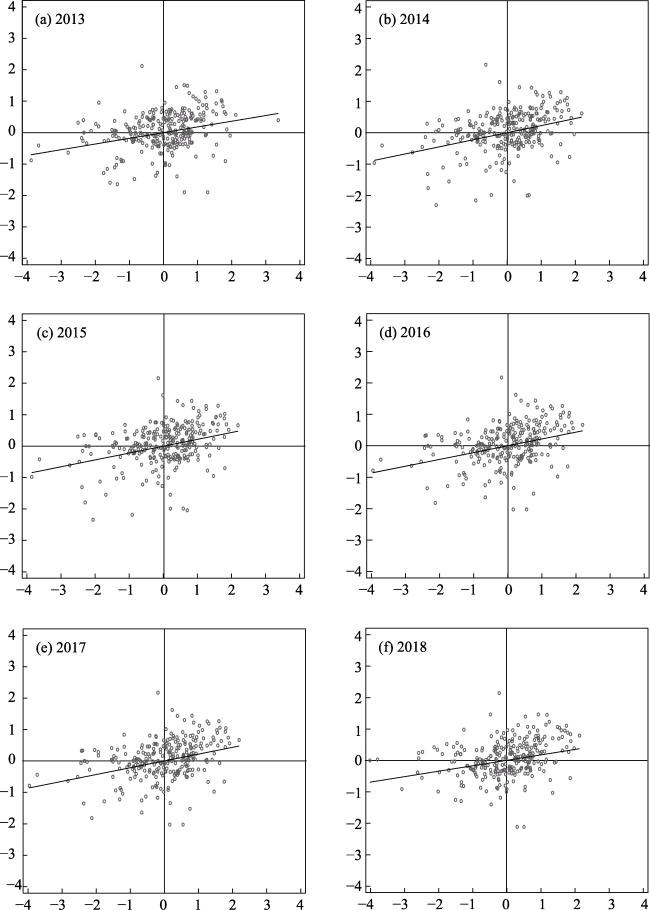
Table 2 The global Moran’s I index of polycentric urban structure
Year Moran’s I Z-score P-value Year Moran’s I Z-score P-value
2013 0.1853 4.5504 0.001*** 2014 0.2306 5.7033 0.001***
2015 0.2233 5.5953 0.001*** 2016 0.2229 5.5471 0.001***
2017 0.1831 4.6207 0.001*** 2018 0.1822 4.5747 0.001***

Note: *** reflects the significance of 1%.

Figure 5 The scatter plots of global Moran’s I index in different years: (a) 2013, (b) 2014, (c) 2015, (d) 2016, (e) 2017 and (f) 2018

5.2 Benchmark regression results

This study followed Jia’s (2021) approach to test the reliability of the SDID model and employed the parallel trend assumption as the following expression:
$POL{{Y}_{it}}={\alpha }'+{\rho }'\sum\nolimits_{j}{{{w}_{ij}}}POL{{Y}_{jt}}+\sum\nolimits_{-3}^{5}{{{\beta }_{k}}D_{it}^{k}}+\gamma '{{X}_{it}}+{\varphi }'\sum\nolimits_{j}{{{w}_{ij}}}{{X}_{jt}}+{{{\mu }'}_{i}}+{{{v}'}_{t}}+{{{\varepsilon }'}_{it}}$
where $D_{it}^{k}$ is a dummy variable related to the implementation of the ADA and the other variables are similar to those previously discussed. The horizontal axis in Figure 6 depicts the number of years before and after the ADA’s implementation. For example, –3 and 5 indicate 3 years before and 5 years following the initial implementation of the ADA, respectively. Before the implementation of ADA, there is no significant difference found in the time-varying trend of POLY between different cities with and without ADA. The results indicated that the parallel trend hypothesis passed the test and that the SDID model could be applied to this study.
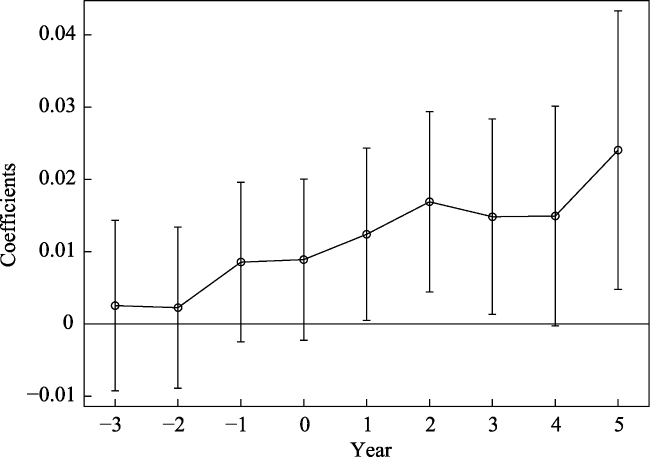
Figure 6 The parallel trend test results of the SDID model
In addition, it is necessary to perform the Lagrange multiplier (LM) test, Likelihood ratio (LR) test, Wald test and Hausman test before the spatial econometric model to further determine the choice of the SDID model (Table 3). Herein, the fixed effects model was adopted in this research because the results of the Hausman test rejected the null hypothesis. Furthermore, the LM, LR and Wald tests indicate that the spatial Durbin model (SDM) cannot be degraded into a spatial lag model or a spatial error model. Therefore, the SDM-based SDID with fixed effects was employed.
Table 3 The selection test of the SDID model
Variables Statistics Variables Statistics Variables Statistics
LM lag 26.778*** LR lag 22.98*** Wald lag 19.84**
LM error 20.354*** LR error 20.72*** Wald error 17.58**

Notes: ***, and ** respectively reflect the significance of 1%, and 5%.

The results in Table 4 present the benchmark regression. Both the mixed ordinary least squares (OLS) model and SDM-based SDID model were adopted to completely reflect the results. Columns (1), (2) and (3) display the results of the mixed OLS regression. The SDM-based SDID model is depicted in columns (4), (5) and (6). According to columns (1) and (4), the coefficients and spatial lag term of ADA are all significantly positive, suggesting that the implementation of ADA promotes POLY. The OLS results in columns (2) and (3) reveal that the coefficients for both BR and HR of the ADA could improve POLY, as the coefficients are all positive at the 1% level. Considering the spatial spillover effects, the SDID results in columns (5) and (6) indicate that the facilitation effect of BR to POLY is better than HR in local region. In addition, the spatial lag terms are both positive at the 1% level in neighbouring regions. Results across all six models show that ADA, BR and HR could all significantly affect POLY in Chinese cities.
Table 4 Benchmark regression results of the OLS and SDID models
Variables Mixed OLS Model SDM-based SDID Model
(1) (2) (3) (4) (5) (6)
ADA 0.0353***
(0.0074)
0.0065*
(0.0037)
BR 0.0445***
(0.0106)
0.0283***
(0.0063)
HR 0.0373***
(0.0078)
0.0061*
(0.0033)
SE 0.0083
(0.0321)
0.0165
(0.0322)
0.0092
(0.0321)
0.0338***
(0.0149)
0.0378**
(0.0148)
0.0349***
(0.0149)
RA -0.0257
(0.0329)
-0.0345
(0.0329)
-0.0214
(0.0331)
0.0007
(0.0314)
0.0035
(0.0306)
-0.0019
(0.0311)
TS -0.05654**
(0.0253)
-0.0466*
(0.0252)
-0.0516**
(0.0252)
0.0228
(0.0227)
0.0178
(0.0225)
0.0229
(0.0226)
CA 0.0422***
(0.0156)
0.0413***
(0.0156)
0.0451***
(0.0156)
-0.0077
(0.0142)
-0.0113
(0.0141)
-0.0075
(0.0141)
IE 0.0539***
(0.0095)
0.0584***
(0.0094)
0.0522***
(0.0095)
-0.0189***
(0.0066)
-0.0202***
(0.0066)
-0.0169***
(0.0066)
W ADA 0.1597***
(0.0571)
W BR 0.3073***
(0.0923)
W HR 0.2418***
(0.0554)
W SE -0.0696
(0.1001)
0.0774
(0.1039)
0.0408
(0.0994)
W RA 1.0822***
(0.3689)
0.6714**
(0.3181)
1.2121***
(0.3511)
W TS -0.1786
(0.3061)
-0.3325
(0.3012)
-0.0722
(0.3062)
W CA 0.0816
(0.2196)
-0.0012
(0.2191)
-0.0352
(0.2206)
W IE 0.0567
(0.0821)
-0.0005
(0.0828)
0.1507*
(0.0845)
cons 0.5196***
(0.0257)
0.5147***
(0.0258)
0.5168***
(0.0257)
City FE No No No Yes Yes Yes
Year FE No No No Yes Yes Yes
R2 0.1392 0.1365 0.1390 0.0104 0.0324 0.0105
Observations 1644 1644 1644 1644 1644 1644

Note: Inside the bracket is the standard error. ***, **, and * respectively reflect the significance of 1%, 5%, and 10%.

The results in Table 5 show that the direct, indirect and total effect of BR are all positive at a 1% level. In addition, the coefficients of BR are all higher than that of ADA and HR, thereby indicating that BR can promote POLY better compared to ADA and HR in both local and neighbour regions. This may be because BR could change the urban spatial areas and boundaries, which directly facilitates the reconstruction of urban form. However, HR only indirectly changes the POLY of cities by altering their hierarchy in terms of income distribution, economic levels, sectoral structure, financial systems and institutional settings.
Table 5 The direct, indirect and total effects of SDID model in columns (4), (5) and (6) of Table 4
Variables ADA BR HR SE RA TS CA IE
Direct effect (4) 0.0065*
(0.0038)
0.0332**
(0.0145)
0.0032
(0.0299)
0.0227
(0.0221)
-0.0076
(0.0138)
-0.0187***
(0.0066)
(5) 0.0279***
(0.0064)
0.0371***
(0.0144)
0.0055
(0.0292)
0.0182
(0.0218)
-0.0112
(0.0137)
-0.0198***
(0.0065)
(6) 0.0055
(0.0038)
0.0344**
(0.0144)
-0.0019
(0.0295)
0.0229
(0.0219)
-0.0073
(0.0137)
-0.0171***
(0.0065)
Indirect effect (4) 0.1515***
(0.0589)
-0.0702
(0.0925)
1.0515***
(0.3664)
-0.1538
(0.2922)
0.0756
(0.2112)
0.0611
(0.0824)
(5) 0.2611***
(0.0845)
0.0596
(0.0926)
0.6012**
(0.2779)
-0.2755
(0.2626)
-0.0017
(0.1904)
0.0079
(0.0756)
(6) 0.1943***
(0.0476)
-0.0418
(0.0792)
1.0006***
(0.2902)
-0.0487
(0.2489)
-0.0291
(0.1791)
0.1305*
(0.0725)
Total
effect
(4) 0.1581***
(0.0596)
-0.0369
(0.0907)
1.0547***
(0.3683)
-0.1311
(0.2933)
0.0681
(0.2126)
0.0424
(0.0833)
(5) 0.2891***
(0.0851)
0.2892***
(0.0852)
0.6066**
(0.2776)
-0.2573
(0.2636)
-0.0128
(0.1915)
-0.0118
(0.0763)
(6) 0.1998***
(0.0481)
-0.0073
(0.0772)
0.9987***
(0.2902)
-0.0258
(0.2493)
-0.0364
(0.1799)
0.1135
(0.0734)

Note: Inside the bracket is the standard error. ***, **, and * respectively reflect the significance of 1%, 5%, and 10%.

5.3 Heterogeneity analysis by region

The influences of ADA on polycentric urban structure also vary as cities differ in aspects such as geographical conditions, socio-economic context, resource allocation and development policies. This study divided the research samples into eastern, central and western China by their geographical location. The heterogeneity analysis of ADA’s effect on urban polycentricity is presented in Table 6.
Table 6 The heterogeneity analysis of administrative division adjustment on urban polycentricity
Variables (1) (2) (3)
Direct effect ADA×EAST 0.0063
(0.0048)
ADA×CENTER 0.0139**
(0.0071)
ADA×WEST -0.0061
(0.0071)
Indirect effect ADA×EAST 0.1775***
(0.0565)
ADA×CENTER -0.1407
(0.1464)
ADA×WEST -0.0549
(0.0683)
Control variable Yes Yes Yes
City FE Yes Yes Yes
Year FE Yes Yes Yes
R2 0.0046 0.0014 0.0012
Observations 1644 1644 1644

Notes: Inside the bracket is the standard error. ***, and ** respectively reflect the significance of 1%, and 5%.

The results in Table 6 demonstrate that the indirect effect of ADA×EAST is significantly positive, suggesting a pronounced regional spillover effect of the ADA on the neighbouring regions in eastern China. The eastern region’s advantageous socio-economic development has decreased its reliance on urban development in local policy interventions. Thus, the transformation and spatial restructuring by marketization have become the main driving force of polycentric urban development compared to the policy-oriented urban growth of ADA (Zhang et al., 2018). The direct effects of policy interventions arising from ADA have a limited effect in the local region. In addition, the majority of cities in eastern China are at a high level of urbanization and have similar socio-economic conditions but smaller development gaps. Therefore, the ability of ADA to allocate resources can have positive spillover effects in its neighbouring cities through spread effects rather than backwash effects.
The direct effects of ADA×CENTER are significantly positive, demonstrating that ADA provides considerable contributions to urban polycentricity in local cities in central China. Central China lacks favorable economic locations, solid industrial foundations and better-qualified labor as compared with cities in eastern China. Hence, the government-led urban planning of ADA is more likely to foster the growth of polycentric urban structures in central China than in eastern China (Wang et al., 2017). The investments of local government have played a crucial role in the development of sub-centers by promoting land and infrastructure developments. Implementing the state-led ADA is conducive to improving inter-city flow and agglomeration of resources between central areas, which further facilitates the polycentric urban structure (Wei, 2012). Therefore, the ADA in central China has a direct positive effect on the POLY in the local regions rather than neighbouring regions.
The direct and indirect effects of ADA×WEST are all insignificant in statistics, implying that ADA has failed to foster urban polycentricity in western China. Western China has a lower urbanization rate than eastern and central China. Urban centers in western China tend to establish larger economic centers rather than polycentric structures to improve the overall efficiency of regional development (Lin et al., 2018). In addition, the less developed core urban districts will attract capital and labor from the nearby smaller sub-centers. Such backwash effects foster the development of core centers with limited resources but undermine the growth of peripheral sub-centers.

5.4 Mechanism identification

The above analyses demonstrate that the ADA as an important intervention tool by the government has a profound influence on polycentric urban structures. Herein, the two following transmission mechanisms were discussed in this study to further investigate the mechanisms by which ADA affects POLY.
(1) Construction land (CL): By changing the administrative ranking of various cities, ADA can modify the extent of autonomy of land use planning. Within the urban master planning guidance, the government promotes the development of pilot sub-centers by increasing the urban construction land index and decentralizing land approvals (Feng and Wang, 2021). Governments have encouraged sub-centers of cities, such as satellite cities, industrial parks and new towns. However, core-centered sprawl remains the predominant development pattern in the majority of Chinese cities (Tian et al., 2017). Under the effect of ADA, the area of land approved for construction land has increased, thus leading to a spread-out sprawl with the core centers as the principal growth pole, to the detriment of decentralized urban development and polycentric structure (Lv et al., 2021). Therefore, ADA inhibits polycentric urban development because of the increase in construction land.
(2) Industrial structure (IS): Implementation of the ADA can direct the layout of industries and further demarcation of urban functions, hence impacting the polycentric urban structure of various cities. Chinese cities’ service activities are highly concentrated in core urban districts as compared with the decentralized service functions in western countries (Kane et al., 2018). Thus, developing a tertiary industries-led public service sector has limited impact on promoting urban polycentricity. In contrast, secondary industries are mainly located in sub-urban areas. Secondary industries-led manufacturing typically focuses on industrial zones or high-technology parks to support sub-urban economic development. Meanwhile, given that the urban growth accelerated by ADA, the core center has experienced overconcentration. Industries in the core center were moved to the sub-centers to make room for transport infrastructure and commercial expansion. Hence, the secondary industries in the core center have been gradually supplanted by the tertiary sector.
Therefore, this study employs the following mediating effect model based on the stepwise regression test to verify the above mechanisms (Baron and Kenny, 1986):
$\begin{align} & {{M}_{it}}={{\alpha }_{1}}+{{\rho }_{1}}\sum\nolimits_{j}{{{w}_{ij}}}{{M}_{jt}}+{{\beta }_{1}}AD{{A}_{it}}+{{\theta }_{1}}\sum\nolimits_{j}{{{w}_{ij}}}AD{{A}_{jt}}+~{{\gamma }_{1}}X_{it}^{'}+ \\ & \ \ \ \ \ \ \ \ \ {{\varphi }_{1}}\sum\nolimits_{j}{{{w}_{ij}}}X_{jt}^{'}+\widehat{{{u}_{i}}}+\widehat{{{v}_{t}}}+\widehat{{{\varepsilon }_{it}}} \\ \end{align}$
$\begin{align} & POL{{Y}_{it}}={{\alpha }_{2}}+{{\rho }_{2}}\sum\nolimits_{j}{{{w}_{ij}}}POL{{Y}_{jt}}+{{\beta }_{2}}AD{{A}_{it}}+{{\theta }_{2}}\sum\nolimits_{j}{{{w}_{ij}}}AD{{A}_{jt}}+{{\gamma }_{2}}{{X}_{it}}+ \\ & \ \ \ \ \ \ \ \ \ \ \ \ \ \ {{\varphi }_{2}}\sum\nolimits_{j}{{{w}_{ij}}}{{X}_{jt}}+\widehat{{{u}_{i}}}+\widehat{{{v}_{t}}}+\widehat{{{\varepsilon }_{it}}} \\ \end{align}$
In the above equations, the effects of ADA on potential mechanism variables are shown in Equation (5). In addition, the effects of mechanism variables on POLY are shown in Equation (6). M represents the mediating variable, which includes construction land (CL) and industrial structure (IS) in this study. CL is determined as the ratio of construction land to the total area and IS is measured as the proportion of secondary industry to tertiary industry gross regional product. Xʹ denotes the control variables, which are selected as follows. The paved road area per capita, the number of cars in circulation, investment in real estate, the ratio of the entire population that is employed in the tertiary sector, the sum of night-light intensities and the proportion of night-light area to the administrative region are controlled for CL. Meanwhile, the paved road area per capita, number of cars in circulation, investment in real estate, the ratio of the entire population that is employed in the tertiary sector, gross regional product per capita and regional public expenditure are controlled for IS.
As the mechanism analysis in this research concentrates on the effects of ADA’s impact on local urban polycentricity, only the direct impact is presented in Table 7. The direct effects of ADA are both significantly positive in columns (1) and (3), thereby suggesting that the implementation of ADA can promote CL and IS. In columns (2) and (4), the direct effect of CL is negative but the direct effect of IS is positive, thereby indicating that an increase in CL inhibits POLY whilst an increase in IS promotes POLY. Therefore, we can conclude that ADA suppresses and enhances polycentric urban structures by boosting construction land and promoting secondary industry, respectively.
Table 7 The mechanism analysis of administrative division adjustment on urban polycentricity
Variables (1) (2) (3) (4)
CL POLY IS POLY
ADA 0.2401***
(0.0698)
0.0057*
(0.0032)
0.0838**
(0.0387)
0.0061*
(0.0035)
CL -0.0025*
(0.0014)
IS 0.0074***
(0.0024)
Control variable Yes Yes Yes Yes
Year FE Yes Yes Yes Yes
City FE Yes Yes Yes Yes
R2 0.0031 0.0209 0.0008 0.0108
Observations 1644 1644 1644 1644

Notes: Inside the bracket is the standard error. ***, **, and * respectively reflect the significance of 1%, 5%, and 10%.

5.5 Robustness test

The robustness tests were conducted to ensure the credibility of the findings in Table 8. In column (1), data were removed by two-sided 2.5% shrinkage on both sides of the independent variable to address the potential sample outliers. Beijing, Tianjin, Shanghai and Chongqing, the four municipalities have greater administrative levels and economic features than other prefecture-level cities, which may influence the regression results. Hence, these four special samples were removed from the total sample in column (2). Government fiscal expenditures (GFE) and gross domestic product (GDP) reflect local regional development characteristics, which can influence the policy choice of urban polycentric strategy and administrative division adjustment. Therefore, control variables were added in order to re-estimate the regression equations. In columns (3) and (4), GFE and GDP were added, respectively. In column (5), added both GFE and GDP as control variables. The robustness of the empirical results mentioned above is confirmed and the outcomes are indicated in Table 8.
Table 8 The robustness test of administrative division adjustment on urban polycentricity
Variables (1) (2) (3) (4) (5)
ADA 0.0056*
(0.0032)
0.0060*
(0.0032)
0.0062*
(0.0037)
0.0062*
(0.0036)
0.0059*
(0.0032)
W ADA 0.1185**
(0.0506)
0.1552***
(0.0598)
0.1383**
(0.0595)
0.1558***
(0.0573)
0.1359**
(0.0596)
Control variable Yes Yes Yes Yes Yes
Year FE Yes Yes Yes Yes Yes
City FE Yes Yes Yes Yes Yes
R2 0.0123 0.0119 0.0086 0.0112 0.0094
Observations 1644 1620 1644 1644 1644

Notes: Inside the bracket is the standard error. ***, **, and * respectively reflect the significance of 1%, 5%, and 10%.

6 Discussion

6.1 National policy related to administrative division adjustment and urbanization

The focus of national policies related to the ADA and top-down urbanization has changed over time, with focuses on urban numbers before 2003, on urban size from 2003 to 2013, and on urban quality after 2013 (Figure 7). After the founding of New China, the administrative division system of urban control over industry and rural control over agriculture led to segregation and serious differentiation between urban and rural areas. The barriers between urban and rural areas were gradually broken down after 1982 under the impetus of policies related to ADA such as the merger of cities and counties. Moreover, the ADA policies related to hierarchy reorganization have facilitated the growth of a large number of small cities. Specifically, the number of prefecture-level cities increased from 98 to 282 between 1978 and 2003.
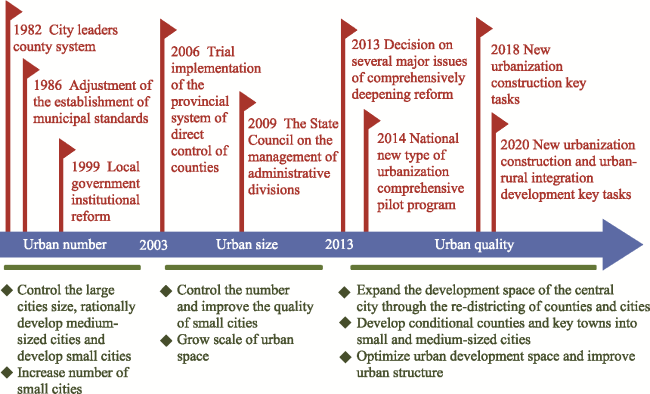
Figure 7 Policy related to administrative division adjustment and urbanization
The conversion of counties into districts became the main strategy of ADA and urbanization transformation from 2003 and 2012. The number of municipal districts increased from 845 to 860 during this period. The ADA policy of conversion from counties into districts can optimize the allocation of resources and factors, expand the scale of the city, and help transform the urban structure by reconfiguring the territorial space of the municipal district, facilitating more refined urbanization management.
The focus of the ADA policies after 2013 is to improve the quality of urban development. The relevant policy of new urbanization proposes to develop conditional counties and key towns into small and medium-sized cities. Through the ADA policy of conversion from counties or cities into districts, expand the development space of the central city. During this period, the number of new districts has increased by 119, optimizing urban development space and improving the urban structure. The polycentric urban structure has been affected significantly due to the increased focus on urban quality in ADA and urbanization-related development policies after 2013.

6.2 Relationship between polycentric urban development and administrative division adjustment

China is experiencing rapid urbanization and a substantial urban spatial shift concurrently. The ADA is not only a management instrument for organization, power, policy and resources but also a crucial driving force for the spatial restructuring of multinucleated cities, which can profoundly reshape the urban form (Enikolopov and Zhuravskaya, 2007). As the highest level of political design for China’s territorial space, the ADA can influence processes of spatial reconfiguration, spatial fragmentation, mixed urbanization and sub-urbanization by changing administrative district types in boundary restructuring and changing administrative district spaces in hierarchy reorganization (Chorianopoulos, 2012).
Hierarchy reorganization can affect the fundamental hierarchy and level of administrative divisions, which further shifts its policy authorities in terms of resource distribution, taxation systems and government expenditure allocations. In China, cities at higher administrative levels have relatively more motivation and power to allocate resources and attract the population, thereby further contributing to the polycentric form of cities. For example, sub-urban areas can enjoy the benefits of favorable development policies, which may further influence the multiple core urban patterns (Spórna and Krzysztofik, 2020). Moreover, the concentration and decentralization of government political authorities caused by ADA can reduce resource misallocation and alter the spatial agglomeration of public resources and production (Bo, 2020). Such agglomeration effects help reshape the polycentric urban structure.
Boundary restructuring can break the fixed administrative space and jurisdictional borders. It facilitates the liquidity and allocation efficiency of the movement of commodities, population, capital and information between different administrative district governments. Local governments are typically dependent and there are inter-city interactions (Wang et al., 2020). Changes in administrative space can also alter the functional complementarities and synergies of regional integration, thereby affecting neighbouring regions. By weakening the restrictions of administrative boundaries, the ADA contributes to the unified planning and industrial layout in sub-urban areas, rather than concentrating resources in urban core centers (Liu et al., 2020b), thus further accelerating the development of multi-core urban structures.

6.3 Implications for polycentric urban planning within administrative division adjustment

The empirical analysis indicates that the ADA plays a crucial role in facilitating polycentric urban development. Thus, formulating effective and targeted policies is necessary to further coordinate the development of ADA and polycentric urban structures. Based on these findings, we proposed the following policy implications.
Firstly, local governments should strengthen their links with neighbouring cities and develop integrated spatial planning at a regional level. Although administrative divisions exist on physical boundaries, the ADA in one specific city can affect neighbouring cities through spillover effects. Therefore, it is necessary to formulate urban planning strategies for integrated regional development to enhance capital flows, industrial transformation and population movements. Through the governmental intervention of ADA, more cooperation is needed to balance the polycentric urban structures in various cities and prevent vicious inter-city competition.
Secondly, the diverse effects of ADA on the polycentric urban structure should be comprehensively considered when making scientific decisions in different regions. With the implementation of the ADA, administrative approvals and planning as well as building rights were modified. However, as cities have distinct socio-economic conditions, the effects of ADA on urban spatial form and resource distribution vary. Therefore, it is recommended that differentiated polycentric urban development strategies should be formulated according to the local conditions. For example, the cities in eastern China with better economic conditions and urbanization levels need to rationally promote the ADA following market laws. However, cities in central China with relatively lower economic conditions and urbanization levels should strengthen government intervention in polycentric urban structures through the ADA.
Thirdly, urban spatial management policies relevant to land use and industrial structure should be implemented to encourage the growth of polycentric urban structures. Currently, most of China’s ADA contribution to construction land is mainly reflected in the core center’s expansion, whilst the surrounding sub-center development has relatively lagged. Therefore, the government needs to strengthen the ADA’s management in terms of land and industrial development. The results of sub-centers such as new towns and industrial parks should be promoted through coordinating industrial structure, rational investment attraction and enhanced urban infrastructure development.

6.4 Contributions and limitations

This study has the following theoretical, methodological and practical contributions. Theoretically, this study presented a fresh perspective on the driving force and mechanism of polycentric urban structure and spatial structure transformation, starting from the state policy that is easy to overlook and difficult to quantify. Methodologically, a novel methodology of SDID was applied to incorporate the spillover effects and inconsistent timing of ADA implementation into the calculation process. It was introduced to measure the spatiotemporal impact of ADA on urban polycentricity. Practically, the effect of boundary restructuring and hierarchy reorganization on urban polycentricity have been identified to further refine the influences of ADA. The results explored the spatial characteristics and trajectory of urban development in the context of strong planning interventions by state-led factors. We also provide references for the planning of polycentric cities from the perspective of ADA.
Notably, although the study case is the cities in China, the results of this research can also be employed in developing countries worldwide with similar top-down urban planning, administrative division changes and polycentric urban development. In addition, urban polycentricity is a widespread topic. Analysing the urban polycentricity with the stated-led factors in terms of ADA could provide a deeper theoretical insight. Furthermore, it could make policy managers in other regions aware of the importance of state-led power in polycentric urban development. The findings in China could provide valuable guidance and reference for top-down administrative organizational changes in similar countries to achieve urban spatial structural transformation.
There are still several limitations that require in-depth analysis. Although prefecture-level cities are suitable for the development of polycentric urban structures, the adjustment of administrative divisions in China has a hierarchical structure of township-level, county-level and prefecture-level. We need to further explore the relationship between ADA and urban polycentricity at the township-level and county-level to support more refined studies. Furthermore, this paper mainly focused on the polycentric morphological structure of the cities. However, material exchanges and energy flows also occurred between urban elements under the guidance of ADA, which shapes the relationships and functions of different cities. Therefore, research and analysis of relational and functional polycentric structure are necessary for the future.

7 Conclusion

The focus of ADA policy has shifted from urban number and urban size to urban quality over time, which affects the urban spatial transformation. The urban polycentric structure as a vital spatial form has been significantly reshaped by the profound impacts of ADA. The study intends to provide references for understanding the relationship between ADA and urban polycentric structure. Specifically, we assessed the spatiotemporal dynamic of urban polycentricity based on the LandScanTM dataset. Furthermore, the SDM-based SDID model was applied to examine the effects and mechanisms of ADA on urban polycentricity. The main conclusions of this research were drawn as follows.
The ADA has positive impacts on polycentric urban structures in both local and neighbouring regions due to the spatial spillover effects. In addition, boundary restructuring can promote urban polycentricity better compared to hierarchy reorganization. Furthermore, the specific effect of the ADA on POLY varies by region, as the degree of urbanization level and economic development level considerably varies from region to region. The ADA has remarkably increased POLY in local cities in central China and neighbouring cities in eastern China but has had no significant effect in western China. Under the implementation of the ADA, the area of land-approved construction land and the ratio of the secondary sector has increased to promote urbanization. However, growth in construction land has primarily occurred in the core centers, whilst secondary industries are mainly located in the sub- centers. Consequently, the ADA can discourage and encourage the development of POLY by increasing construction land and improving the industrial structure, respectively. Although the impact of ADA on urban polycentricity is positive, the various socio-economic conditions in different regions need to be considered for coordinating effective and targeted policies and supporting urban spatial transformation.
[1]
Anselin L, 2010. Local indicators of spatial association: LISA. Geographical Analysis, 27(2): 93-115.

DOI

[2]
Anselin L, Arribas B D, 2013. Spatial fixed effects and spatial dependence in a single cross-section. Papers in Regional Science, 92(1): 3-17.

DOI

[3]
Baron R M, Kenny D A, 1986. The moderator-mediator variable distinction in social psychological research: Conceptual, strategic, and statistical considerations. Journal of Personality and Social Psychology, 51(6): 1173-1182.

DOI PMID

[4]
Bo S Y, 2020. Centralization and regional development: Evidence from a political hierarchy reform to create cities in China. Journal of Urban Economics, 115(1): 103182.

DOI

[5]
Chen K Q, Long H L, Liao L W et al., 2020. Land use transitions and urban-rural integrated development: Theoretical framework and China’s evidence. Land Use Policy, 92(3): 104465.

DOI

[6]
Chen Y L, Wang L, Yu P H et al., 2023. Spatiotemporal linkages between administrative division adjustment and urban form: Political drivers of the urban polycentric structure. Land, 12(9): 1674.

DOI

[7]
Chen Y L, Yu P H, Chen Y Y et al., 2022. Spatiotemporal dynamics of rice-crayfish field in mid-China and its socioeconomic benefits on rural revitalisation. Applied Geography, 139(2): 102636.

DOI

[8]
Cheng H, Shaw D, 2018. Polycentric development practice in master planning: The case of China. International Planning Studies, 23(2): 163-79.

DOI

[9]
Chien S S, 2013. New local state power through administrative restructuring: A case study of post-Mao China county-level urban entrepreneurialism in Kunshan. Geoforum, 46(3): 103-112.

DOI

[10]
Chien S S, Woodworth M D, 2018. China’s urban speed machine: The politics of speed and time in a period of rapid urban growth. International Journal of Urban and Regional Research, 42(4): 723-737.

DOI

[11]
Chorianopoulos I, 2012. State spatial restructuring in Greece: Forced rescaling, unresponsive localities. European Urban and Regional Studies, 19(4): 331-348.

DOI

[12]
Du G, Yu M, Sun C W et al., 2021. Green innovation effect of emission trading policy on pilot areas and neighboring areas: An analysis based on the spatial econometric model. Energy Policy, 156(9): 112431.

DOI

[13]
Enikolopov R, Zhuravskaya E, 2007. Decentralization and political institutions. Journal of Public Economics, 91(11-12): 2261-2290.

DOI

[14]
Fan Y T, Jin X B, Gan L et al., 2022. Dynamics of spatial associations among multiple land use functions and their driving mechanisms: A case study of the Yangtze River Delta region, China. Environmental Impact Assessment Review, 97(6): 106858.

DOI

[15]
Feng R D, Wang K Y, 2021. Spatiotemporal effects of administrative division adjustment on urban expansion in China. Land Use Policy, 101(2): 105143.

DOI

[16]
Feng R D, Wang K Y, 2022. The direct and lag effects of administrative division adjustment on urban expansion patterns in Chinese mega-urban agglomerations. Land Use Policy, 112(1): 105805.

DOI

[17]
Feng R D, Wang K Y, Wang F Y, 2022. Quantifying influences of administrative division adjustment on PM2.5 pollution in China’s mega-urban agglomerations. Journal of Environmental Management, 302(1): 113993.

DOI

[18]
Fernández-Maldonado A M, Romein A, Verkoren O et al., 2014. Polycentric structures in Latin American metropolitan areas: Identifying employment sub-centres. Regional Studies, 48(12): 1954-1971.

DOI

[19]
Friedmann J, 2006. Four theses in the study of China’s urbanization. International Journal of Urban and Regional Research, 30(2): 440-451.

DOI

[20]
Gao X, Cheryl L X N, 2014. Cultural border, administrative border, and regional economic development: Evidence from Chinese cities. China Economic Review, 31(12): 247-264.

DOI

[21]
Green N, 2007. Functional polycentricity: A formal definition in terms of social network analysis. Urban Studies, 44(11): 2077-2103.

DOI

[22]
Guan X L, Wei H K, Lu S S et al., 2018. Assessment on the urbanization strategy in China: Achievements, challenges and reflections. Habitat International, 71(1): 97-109.

DOI

[23]
He C F, Wei Y D, Xie X Z, 2008. Globalization, institutional change, and industrial location: Economic transition and industrial concentration in China. Regional Studies, 42(7): 923-945.

DOI

[24]
Huxley M, 2020. Administrative Coordination, Urban Management and Strategic Planning in the 1970s. Sydney, AUS: Allen and Unwin.

[25]
Jia R N, Shao S, Yang L L, 2021. High-speed rail and CO2 emissions in urban China: A spatial difference-in-differences approach. Energy Economics, 99(7): 105271.

DOI

[26]
Jiang W R, 2022. The impact of local fiscal independence on corporate tax burden:A quasi-natural experiment based on the county-to-district reform. Singapore, SG: Springer.

[27]
Kane K, Hipp J R, Kim J H, 2018. Los Angeles employment concentration in the 21st century. Urban Studies, 55(4): 844-869.

DOI

[28]
Kaza N, 2020. Urban form and transportation energy consumption. Energy Policy, 136(1): 111049.

DOI

[29]
Li H, Wei Y D, Liao F H et al., 2015. Administrative hierarchy and urban land expansion in transitional China. Applied Geography, 56(1): 177-186.

DOI

[30]
Li Y C, Derudder B, 2022. Dynamics in the polycentric development of Chinese cities, 2001-2016. Urban Geography, 43(2): 272-292.

DOI

[31]
Li Y F, Dang A R, 2008. A study on the interaction and evolution of the spatial expansion and administrative division adjustment in Beijing metropolitan area. Geoinformatics 2008 and Joint Conference on GIS and Built Environment: The Built Environment and Its Dynamics, 7144(1): 714410.

[32]
Lin W Q, Wu M H, Zhang Y et al., 2018. Regional differences of urbanization in China and its driving factors. Science China Earth Sciences, 61(6): 778-791.

DOI

[33]
Liu K, Murayama Y, Ichinose T, 2020a. Using a new approach for revealing the spatiotemporal patterns of functional urban polycentricity: A case study in the Tokyo metropolitan area. Sustainable Cities and Society, 59(8): 102176.

DOI

[34]
Liu M S, Lo K, 2022. The territorial politics of urban expansion: Administrative annexation and land acquisition. Cities, 126(7): 103704.

DOI

[35]
Liu W B, Hou Q, Xie Z H et al., 2020b. Urban network and regions in China: An analysis of daily migration with complex networks model. Sustainability, 12(8): 3208.

DOI

[36]
Liu X J, Wang M S, 2016. How polycentric is urban China and why? A case study of 318 cities. Landscape and Urban Planning, 151(7): 10-20.

DOI

[37]
Liu Y G, Yin G W, Ma L J C, 2012. Local state and administrative urbanization in post-reform China: A case study of Hebi City, Henan Province. Cities, 29(2): 107-117.

DOI

[38]
Lv Y Q, Zhou L, Yao G B et al., 2021. Detecting the true urban polycentric pattern of Chinese cities in morphological dimensions: A multiscale analysis based on geospatial big data. Cities, 116(9): 103298.

DOI

[39]
Ma Laurence J C, Cui G H, 1987. Administrative changes and urban population in China. Annals of the Association of American Geographers, 77(3): 373-395.

DOI

[40]
Meijers E, Waterhout B, Zonneveld W, 2007. Closing the gap: Territorial cohesion through polycentric development. European Journal of Spatial Development, 5(2): 1-24.

[41]
Parr J B, 2004. The polycentric urban region: A closer inspection. Regional Studies, 38(3): 231-240.

DOI

[42]
Sánchez-Martínez M T, Salas-Velasco M, Rodríguez-Ferrero N, 2012. Who manages Spain’s water resources? The political and administrative division of water management. International Journal of Water Resources Development, 28(1): 27-42.

DOI

[43]
Sharifi A, 2019. Urban form resilience: A meso-scale analysis. Cities, 93(10): 238-252.

DOI

[44]
Spórna T, Krzysztofik R, 2020. ‘Inner’ suburbanisation-background of the phenomenon in a polycentric, post-socialist and post-industrial region: Example from the Katowice conurbation, Poland. Cities, 104(9): 102789.

DOI

[45]
Sun B D, Li W, Zhang Z Q et al., 2019. Is polycentricity a promising tool to reduce regional economic disparities? Evidence from China’s prefectural regions. Landscape and Urban Planning, 192(12): 103667.

DOI

[46]
Tan R H, Liu P C, Zhou K H et al., 2022. Evaluating the effectiveness of development-limiting boundary control policy: Spatial difference-in-difference analysis. Land Use Policy, 120(9): 106229.

DOI

[47]
Tian L, Li Y F, Yan Y Q et al., 2017. Measuring urban sprawl and exploring the role planning plays: A shanghai case study. Land Use Policy, 67(9): 426-435.

DOI

[48]
Wakefield S, 2022. Critical urban theory in the Anthropocene. Urban Studies, 59(5): 917-936.

DOI

[49]
Wang J, Wu Q, Yan S Q et al., 2020. China’s local governments breaking the land use planning quota: A strategic interaction perspective. Land Use Policy, 92(3): 104434.

DOI

[50]
Wang J, Yeh A G O, 2020. Administrative restructuring and urban development in China: Effects of urban administrative level upgrading. Urban Studies, 57(6): 1201-1223.

DOI

[51]
Wang J, Zhang X L, 2022. Land-based urbanization in China: Mismatched land development in the post-financial crisis era. Habitat International, 125(7): 102598.

DOI

[52]
Wang K Y, Feng R D, 2021. Quantitative measurement of the effects of administrative division adjustments on regional development. Journal of Geographical Sciences, 31(12): 1775-1790.

DOI

[53]
Wang K Y, Wang F Y, 2020. Theory and measurement model of administrative region potential from a perspective of administrative division adjustment: Taking Chongqing city as a case study. Journal of Geographical Sciences, 30(8): 1341-1362.

DOI

[54]
Wang M, Krstikj A, Koura H, 2017. Effects of urban planning on urban expansion control in Yinchuan city, western China. Habitat International, 64(6): 85-97.

DOI

[55]
Wang P R, Zeng C, Song Y et al., 2021. The spatial effect of administrative division on land-use intensity. Land, 10(5): 543.

DOI

[56]
Wei S, Zheng W, Wang L, 2021. Understanding the configuration of bus networks in urban China from the perspective of network types and administrative division effect. Transport Policy, 104(5): 1-17.

DOI

[57]
Wei Y H D, 2012. Restructuring for growth in urban China: Transitional institutions, urban development, and spatial transformation. Habitat International, 36(3): 396-405.

DOI

[58]
Wu K Y, Zhang H, 2012. Land use dynamics, built-up land expansion patterns, and driving forces analysis of the fast-growing Hangzhou metropolitan area, eastern China (1978-2008). Applied Geography, 34(4): 137-145.

DOI

[59]
Xu Z N, Gao X L, Wang Z Y et al., 2018. An investigation of non-local-governed urban villages in China from the perspective of the administrative system. Habitat International, 74(4): 27-35.

DOI

[60]
Yarram S R, Tran C T D, Dollery B E, 2022. Administrative intensity in local government: Do administrative scale economies exist in New South Wales local government? Politics & Policy, 50(3): 562-579.

DOI

[61]
Yu H, Deng Y, Xu S, 2018. Evolutionary pattern and effect of administrative division adjustment during urbanization of China: Empirical analysis on multiple scales. Chinese Geographical Science, 28(5): 758-772.

DOI

[62]
Yu P H, Chan E H W, Yung E H K et al., 2023a. Open space fragmentation in Hong Kong’s built-up area: An integrated approach based on spatial horizontal and vertical equity lenses. Environmental Impact Assessment Review, 102(5): 107174.

DOI

[63]
Yu P H, Chen Y Y, Xu Q Y et al., 2022. Embedding of spatial equity in a rapidly urbanising area: Walkability and air pollution exposure. Cities, 131(12): 103942.

DOI

[64]
Yu P H, Yung E H K, Chan E H W et al., 2023b. Capturing open space fragmentation in high-density cities: Towards sustainable open space planning. Applied Geography, 154(5): 102927.

DOI

[65]
Zeng C, Song Y, He Q S et al., 2018. Urban-rural income change: Influences of landscape pattern and administrative spatial spillover effect. Applied Geography, 97(8): 248-262.

DOI

[66]
Zeng C, Zhang A L, Liu L et al., 2017. Administrative restructuring and land-use intensity: A spatial explicit perspective. Land Use Policy, 67(9): 190-199.

DOI

[67]
Zeng C, Zhang A L, Xu S, 2016. Urbanization and administrative restructuring: A case study on the Wuhan urban agglomeration. Habitat International, 55(5): 46-57.

DOI

[68]
Zhang L L, Yue W Z, Liu Y et al., 2018. Suburban industrial land development in transitional China: Spatial restructuring and determinants. Cities, 78(8): 96-107.

DOI

[69]
Zhang S H, Zhang M A, Sun W Z, 2022. Administrative division adjustment and housing price comovement: Evidence from city-county mergers in China. China & World Economy, 30(4): 149-173.

[70]
Zhang T L, Sun B D, Li W, 2017. The economic performance of urban structure: From the perspective of polycentricity and monocentricity. Cities, 68(10): 18-24.

DOI

[71]
Zhang W J, Thill J C, 2019. Mesoscale structures in world city networks. Annals of the American Association of Geographers, 109(3): 887-908.

DOI

[72]
Zhen F, Shen Q, Jian B X, 2010. Regional governance, local fragmentation, and administrative division adjustment: spatial integration in Changzhou. China Review, 10(1): 95-128.

[73]
Zhu C H, Xie H M, Zhou W X et al., 2012. Impact of administrative division adjustment on location and accessibility of Hefei, China. Applied Mechanics and Materials, 253- 255(12): 271-277.

[74]
Živković J, 2019. Urban Form and Function. Switzerland, CHAM: Springer.

Outlines

/