
Journal of Geographical Sciences >
Changes in the spatial distribution of mariculture in China over the past 20 years
|
Liu Yueming (1992‒), PhD, specialized in intelligent interpretation of remote sensing images, coastal zone remote sensing. E-mail: liuym@lreis.ac.cn |
Received date: 2022-10-25
Accepted date: 2023-07-12
Online published: 2023-12-14
Supported by
The National Key Research and Development Program of China(2021YFB3900501)
National Natural Science Foundation of China(42306246)
National Natural Science Foundation of China(42371473)
The Key Project of Innovation, LREIS(KPI001)
The Youth Project of Innovation, LREIS(YPI004)
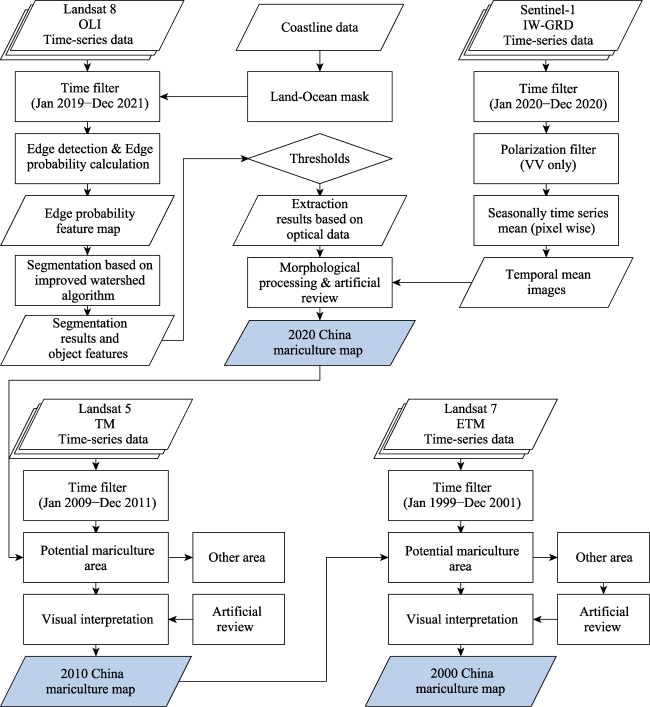
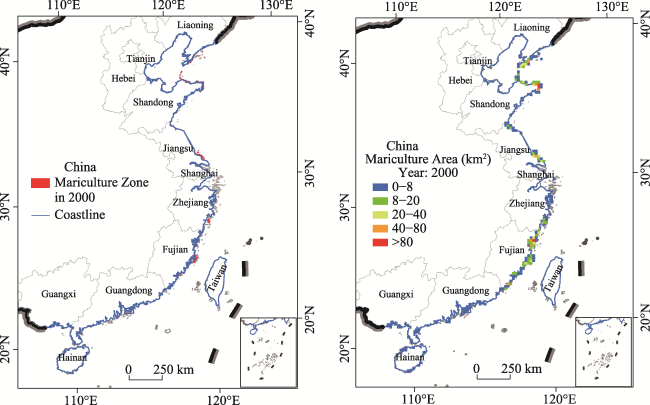
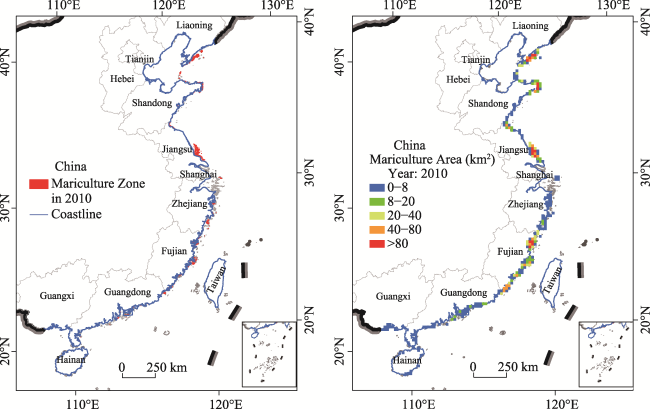
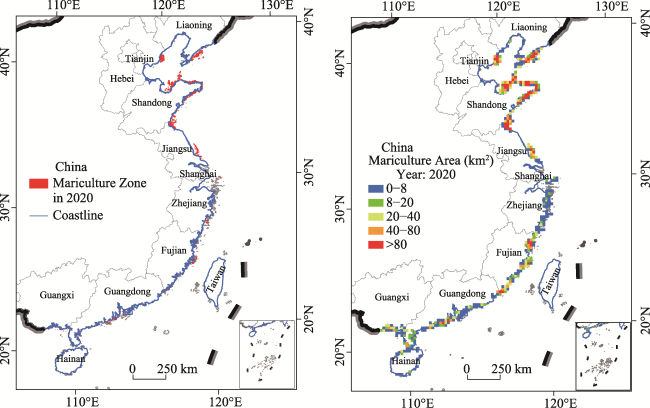
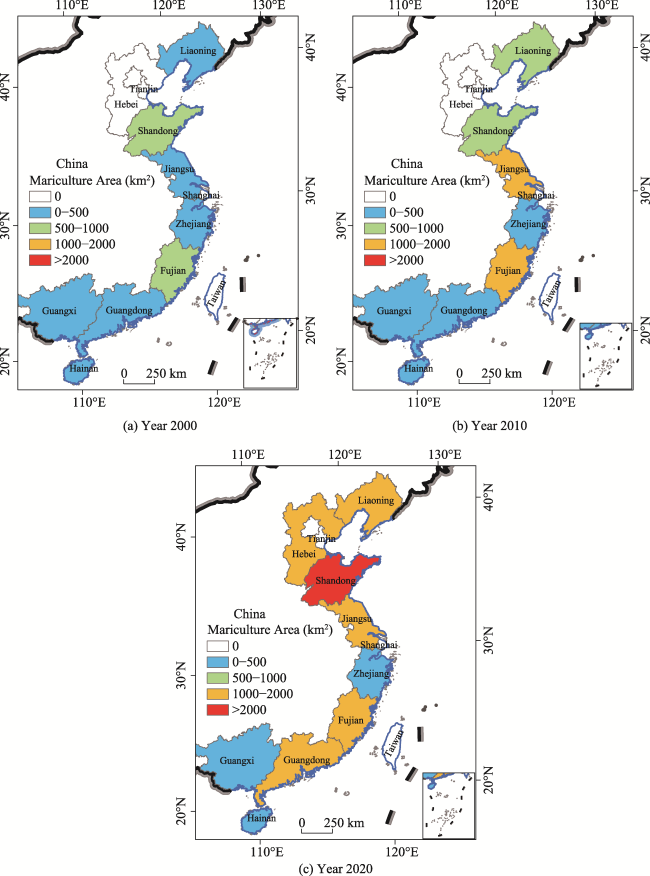
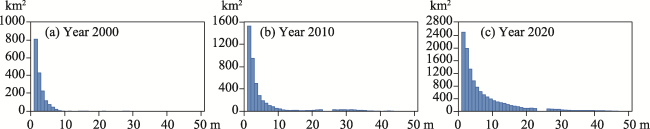
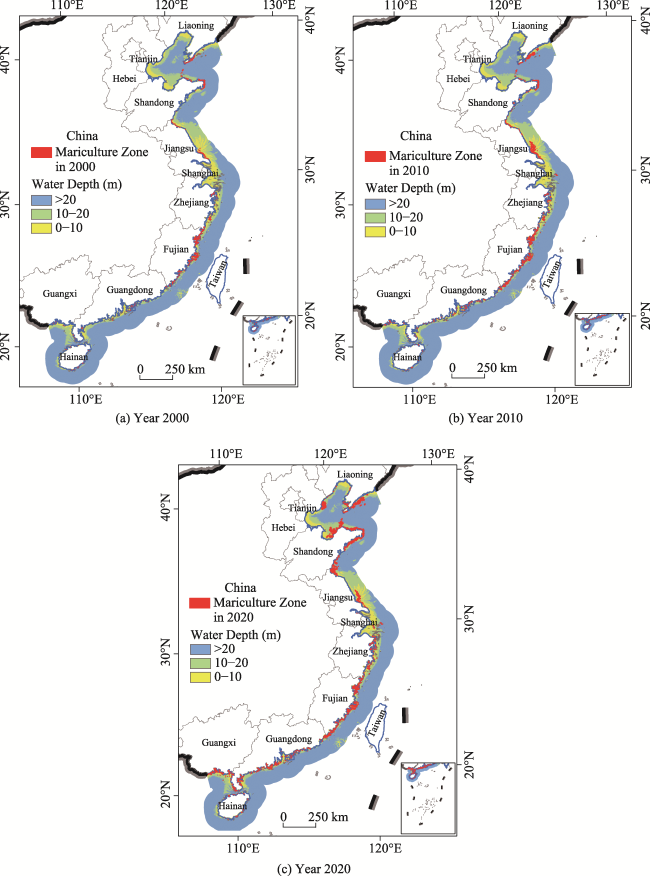
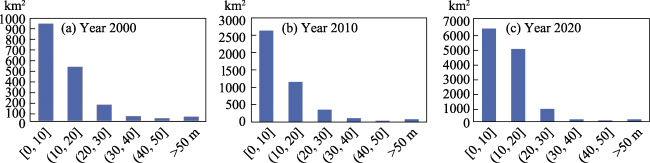
China's mariculture provides more than 60% of the world’s mariculture products and plays an important role in the world’s aquaculture and food supply. Research on changes in the spatial distribution pattern of China’s mariculture, however, remains lacking. To accurately reflect the changes in the spatial pattern of mariculture in China, in this study, we used multitemporal optical and synthetic aperture radar remote sensing images to enhance the characteristics of mariculture and extracted the spatial distribution data for mariculture in China in 2000, 2010, and 2020. Accordingly, we explored the distribution pattern and changes in mariculture in China. We found that, in 2020, China’s mariculture exhibited a distribution pattern of more in the north and less in the south. With the Yangtze River estuary as the boundary, the proportion of mariculture in northern China was 70.9%, and that in southern China was only 29.1%. This difference did not exist in 2000, but it emerged because of the rapid development of mariculture in northern China from 2010 to 2020. In addition, by superimposing the mariculture data with shoreline and water depth data, we found that more than 90% of China’s mariculture area was located in the sea area within 20 km of the shoreline and that more than 80% of the mariculture area was located in the sea area with water depths of less than 20 m. In addition, the spatial distribution of mariculture in China developed from near the shore and moved outward from shallow to deep water areas. We examined the driving factors that influence changes in the spatial distribution of mariculture in China. We argue that technological advancements in mariculture, as well as the intensive concentration of mariculture near the shore, policy constraints and incentives, and economic development, collaborate to shape the current pattern of mariculture development in China.
LIU Yueming , WANG Zhihua , YANG Xiaomei , WANG Shaoqiang , LIU Xiaoliang , LIU Bin , ZHANG Junyao , MENG Dan , DING Kaimeng , GAO Ku , ZENG Xiaowei , DING Yaxin . Changes in the spatial distribution of mariculture in China over the past 20 years[J]. Journal of Geographical Sciences, 2023 , 33(12) : 2377 -2399 . DOI: 10.1007/s11442-023-2181-z
Figure 1 Workflow of the three periods of mariculture mapping |
Table 1 Obfuscation matrix |
| Interpretation result | |||
|---|---|---|---|
| Mariculture area | Nonmariculture area | ||
| Truth | Mariculture area | TP | FN |
| Nonmariculture area | FP | TN | |
Figure 2 Distribution of mariculture in China in 2000 |
Figure 3 Distribution of mariculture in China in 2010 |
Figure 4 Distribution of mariculture in China in 2020 |
Figure 5 Details of mariculture in China in 2000, 2010, and 2020 |
Table 2 Distribution and area proportion of mariculture in different provinces of China in 2000, 2010, and 2020 |
| Region | Area (km2) | Proportion (%) | ||||
|---|---|---|---|---|---|---|
| 2000 | 2010 | 2020 | 2000 | 2010 | 2020 | |
| China | 1775.88 | 4480.69 | 12,736.98 | / | / | / |
| Liaoning | 214.49 | 833.04 | 1535.69 | 12.1 | 18.6 | 12.1 |
| Hebei | 0 | 0 | 1191.40 | 0.0 | 0.0 | 9.4 |
| Tianjin | 0 | 0 | 0 | 0.0 | 0.0 | 0.0 |
| Shandong | 556.24 | 675.14 | 4841.42 | 31.3 | 15.1 | 38.0 |
| Jiangsu | 244.36 | 1010.46 | 1448.44 | 13.8 | 22.6 | 11.4 |
| Shanghai | 0 | 0 | 0 | 0.0 | 0.0 | 0.0 |
| Zhejiang | 61.63 | 124.54 | 261.42 | 3.5 | 2.8 | 2.1 |
| Fujian | 653.82 | 1609.88 | 1738.06 | 36.8 | 35.9 | 13.6 |
| Guangdong | 17.21 | 172.35 | 1261.15 | 1.0 | 3.8 | 9.9 |
| Guangxi | 2.40 | 29.63 | 356.59 | 0.1 | 0.7 | 2.8 |
| Hainan | 5.72 | 5.55 | 82.58 | 0.3 | 0.1 | 0.6 |
Figure 6 Distribution of the mariculture area in China in 2000, 2010, and 2020 |
Table 3 Changes in the mariculture area in each region of China during the two periods |
| Region | Rate of change (%) | |
|---|---|---|
| 2000-2010 | 2010-2020 | |
| China | 152.3 | 184.3 |
| Northern China | 148.1 | 258.0 |
| Southern China | 162.1 | 90.5 |
| Liaoning | 288.4 | 84.3 |
| Hebei | / | / |
| Tianjin | / | / |
| Shandong | 21.4 | 617.1 |
| Jiangsu | 313.5 | 43.3 |
| Shanghai | / | / |
| Zhejiang | 102.1 | 109.9 |
| Fujian | 146.2 | 8.0 |
| Guangdong | 901.6 | 631.7 |
| Guangxi | 1134.2 | 1103.6 |
| Hainan | −3.0 | 1388.2 |
Figure 7 Distribution statistics of the mariculture area and shoreline distance in China in 2000, 2010, and 2020 |
Figure 8 Distribution of mariculture at different water depths in China |
Figure 9 Distribution statistics of the mariculture area in the nearshore water depth areas in China in 2000, 2010, and 2020 |
| [1] |
|
| [2] |
|
| [3] |
|
| [4] |
|
| [5] |
|
| [6] |
FAO, 2018. Fisheries and Aquaculture topics. The State of World Fisheries and Aquaculture (SOFIA). In: FAO Fisheries and Aquaculture Department [online].
|
| [7] |
FAO, 2022. Fisheries and Aquaculture topics. The State of World Fisheries and Aquaculture (SOFIA). In: FAO Fisheries and Aquaculture Department [online].
|
| [8] |
|
| [9] |
|
| [10] |
|
| [11] |
Gebco Bathymetric Compilation Group, 2021. The GEBCO_2021 Grid: A Continuous Terrain Model of the Global Oceans and Land. In, edited by Gebco Bathymetric Compilation Group 2021. NERC EDS British Oceanographic Data Centre NOC.
|
| [12] |
|
| [13] |
|
| [14] |
|
| [15] |
|
| [16] |
|
| [17] |
|
| [18] |
|
| [19] |
|
| [20] |
|
| [21] |
|
| [22] |
|
| [23] |
|
| [24] |
|
| [25] |
|
| [26] |
|
| [27] |
|
| [28] |
|
| [29] |
|
| [30] |
|
| [31] |
|
| [32] |
|
| [33] |
|
| [34] |
|
| [35] |
|
| [36] |
|
| [37] |
|
| [38] |
|
| [39] |
|
| [40] |
|
| [41] |
|
| [42] |
|
| [43] |
|
| [44] |
|
| [45] |
|
| [46] |
|
/
| 〈 |
|
〉 |
