Research Articles

Observing the compact trend of urban expansion patterns in global 33 megacities during 2000-2020

  • HOU Yali , 1, 2 ,
  • KUANG Wenhui 1 ,
  • DOU Yinyin , 1, *
Expand
  • 1. Key Laboratory of Land Surface Pattern and Simulation, Institute of Geographic Sciences and Natural Resources Research, CAS, Beijing 100101, China
  • 2. University of Chinese Academy of Sciences, Beijing 100049, China
* Dou Yinyin, PhD and Associate Professor, specialized in remote sensing of urban ecology.E-mail:

Hou Yali (1995-), Master Candidate, specialized in remote sensing of urban. E-mail:

Received date: 2022-11-09

  Accepted date: 2023-09-28

  Online published: 2023-12-14

Supported by

The Strategic Priority Research Program of Chinese Academy of Sciences(XDA20040403)

The Strategic Priority Research Program of Chinese Academy of Sciences(XDA23100201)

Abstract

Megacities serve as global centers for economic, cultural, and high-tech industries. The structural features and population agglomerations are typical traits of urbanization, yet little is known about the morphological features and expansion patterns of megacities worldwide. Here we examined the spatiotemporal variations of urban land in megalopolises from 2000 to 2020 using the Urban Expansion Intensity Differentiation Index. The fractal features and expansion patterns of megacities were analyzed using the Area-Radius Multidimensional Scaling Model. Urban land use efficiency was then evaluated based on the linear relationship between urban land area and population. We found that Southeast Asia and China were the hotspots of urban expansion in megacities from 2000 to 2020, with urban land areas expanding by 3148.32 km2 and 5996.26 km2, respectively. The morphological features and expansion patterns of megacities exhibited a growing trend towards intensification and compactness, with the average radial dimension increasing from 1.54 to 1.56. The annual decrease in fractal dimensions indicated the integration of inner urban areas. North America and Europe megacities showed a low urban land use efficiency, with a ratio of urban land area to population ranging from 0.89 to 4.11 in 2020. Conversely, South Asia and Africa megacities exhibited a high urban land use efficiency, with the ratios between 0.23 and 0.87. Our results provide information for promoting efficient urban land utilization and sustainable cities. It is proposed to control the scale of urban expansion and to promote balanced development between inner and outer urban areas for achieving resilient and sustainable urban development.

Cite this article

HOU Yali , KUANG Wenhui , DOU Yinyin . Observing the compact trend of urban expansion patterns in global 33 megacities during 2000-2020[J]. Journal of Geographical Sciences, 2023 , 33(12) : 2359 -2376 . DOI: 10.1007/s11442-023-2180-0

1 Introduction

The world has experienced unprecedented urban expansion since the 19th century, driven by the acceleration of urbanization (Liu et al., 2020; Zhang et al., 2020; Li, 2021). United Nations has indicated that by 2050, two-thirds of the global population will reside in urban areas (UN, 2018), leading to a tripling of the global urban built-up area (Angel et al., 2011). The rapid urbanization has resulted in the emergence of megacities, characterized by a substantial concentration of population (Van et al., 2008). However, this concentration of human activities in megacities has given rise to various environmental challenges with global implications, including solid waste pollution, frequent extreme heat events, air pollution, and water scarcity (Djehdian et al., 2019; Liang et al., 2020; Wang et al., 2021). In light of the sustainability imperative, it is crucial to quantitatively assess the morphological changes in urban areas, particularly in megacities, to clarify the various stages of urbanization and their ecological consequences.
Numerous studies have reported on urban expansion and morphological changes in megacities, which is of crucial issue in the field of urban geography (Dong et al., 2019; Mahtta et al., 2019; Hai et al., 2020; Zheng et al., 2021). In India, megacities like Kolkata and New Delhi experienced substantial expansion, resulting in severe environmental challenges. Kolkata’s rapid urbanization led to a sharp decrease in vegetation and fallow land (Mandal et al., 2019), while New Delhi witnessed a dramatic increase in impervious surfaces, which posed a potential threat of heat stress (Dutta et al., 2021). Manila was in the coalescence phase and had limited land for future expansion, whereas Bangkok possessed ample land for future development, exhibiting a diffusion pattern (Estoque et al., 2015). Cities in China, such as Beijing, Shanghai, Tianjin, and Guangzhou, underwent rapid edge expansion, progressing towards the coalescence phase in urban development between 1990 and 2010 (Ou et al., 2017). Small cities in Africa underwent rapid expansion, marked by low urban land density and dispersed urban forms (Xu et al., 2019). Several studies have evaluated urban development and expansion patterns using various methods. However, they fall short in analyzing the complexity as well as scale-free features of urban landscapes and the distinction among the morphologies of various cities. Furthermore, the comparative analysis of cities in different global regions has also been limited.
Cities as complex systems (Song et al., 2018), their morphology follows specific spatial principles (Benguigui et al., 2004; Encarnação et al., 2012). Fractal geometry provides a means to quantify these principles (Tannier et al., 2011; Chen et al., 2017). Fractals exhibit fragmentation and irregularity, and these features are captured through fractal parameters (Chen et al., 2019; Chen, 2020). The fractal nature of urban form manifests as an organized pattern and intricate structure during urban development, with the fractal dimension serving as an effective measure of urban fractal characteristics (Jevric et al., 2016). This dimension reflects the complexity and diversity of urban spatial morphology (Lagarias et al., 2020), providing valuable insights into the evolutionary patterns of cities and facilitating optimized urban planning solutions to enhance urban sustainability (Frankhauser et al., 2018). The spatial structure of urban land over time can be effectively modeled using the binary features of the cellular automaton model (White, 1993). The fractal theory has been widely used to analyze the fractal dimension in urban expansion. For example, the ability of fractal dimension parameters to reflect expansion patterns was demonstrated in global cities (Frankhauser, 1998). The Area-Radius Multidimensional Scaling Method (ARMSM) was employed to identify scalar zones in Swiss urban agglomerations (Bosch et al., 2020), while the radial dimension proved to be useful in revealing spatial patterns and changes in the Beijing-Tianjin-Hebei urban agglomeration (Zhang et al., 2019). Therefore, fractal analysis offers a means of describing urban morphological features, and the ARMSM serves as an effective method.
In this study, we aimed to investigate the expansion patterns and fractal features of megacities using the methodology of fractal analysis. The scalar zones of megacities were quantified with the use of the ARMSM, enabling the division of cities into inner and outer urban areas. Subsequently, we conducted a fractal analysis to evaluate urban expansion patterns and land use efficiency by comparing urban expansion rates and their relationship with population growth. The findings elucidated the ongoing trend of megacity land expansion in the 21st century, thereby offering a valuable reference for the development and planning of diverse cities across global regions.

2 Data and methods

2.1 Study area

Megacities refer to urban areas with a total population exceeding 10 million inhabitants (UN, 2018). This research focuses on the 33 megacities identified in the 2018 Revision of World Urbanization Prospects produced by the Population Division of the United Nations Department of Economic and Social Affairs (UN DESA) (UN, 2018). These megacities are located in countries at various levels of economic development. Specifically, five cities among them are in high-income countries, 27 cities are in middle-income countries, and one city is in a low-income country. The economic and geographic differences have resulted in distinct urban morphology and expansion patterns among these megacities.
Table 1 List of global 33 megacities
Megacity Country Region Population (10 million) Megacity Country Region Population (10 million)
Bangalore India South Asia 1.14 Lahore Pakistan South Asia 1.17
Bangkok Thailand Southeast Asia 1.02 Lima Peru South America 1.04
Beijing China East Asia 1.96 Los Angeles United States North America 1.25
Bogotá Columbia South America 1.06 Manilla Philippines Southeast Asia 1.35
Buenos Aires Argentina South America 1.50 Mexico City Mexico North America 2.16
Cairo Egypt North Africa 2.01 Moscow Russia Europe 1.24
Chennai India South Asia 1.05 Mumbai India South Asia 2.00
Chongqing China East Asia 1.48 New York United States North America 1.88
Delhi India South Asia 2.85 Osaka Japan East Asia 1.93
Dhaka Bangladesh South Asia 1.96 Paris France Europe 1.09
Guangzhou China East Asia 1.26 Rio de Janeiro Brazil South America 1.33
Istanbul Turkey Europe, West Asia 1.48 São Paulo Brazil South America 2.17
Jakarta Indonesia Southeast Asia 1.05 Shanghai China East Asia 2.56
Karachi Pakistan South Asia 1.54 Shenzhen China East Asia 1.19
Kinshasa DR Congo Central Africa 1.32 Tianjin China East Asia 1.32
Kolkata India South Asia 1.47 Tokyo Japan East Asia 3.75
Lagos Nigeria West Africa 1.35

2.2 Data

2.2.1 GULUC-30 data

The urban boundaries data was obtained from the Global Urban Land Use/Cover Composites with 30 m spatial resolution (GULUC-30) dataset (http://www.chinageoss.cn/geoarc/2020) (Wang et al., 2020). GULUC-30 dataset was produced using big data and machine learning techniques, according to the graphical rating scale mapping principles that depict the underlying surface structural composition of cities. The original urban boundary data was obtained using the normalized settlement density index, and it was then derived through density slicing and subsequent data refinement addressed any voids. With an overall accuracy of 91.20%, the dataset proves suitable for textual analysis and mapping purposes.

2.2.2 WorldPop data

The population data were obtained from the WorldPop dataset developed by the University of Southampton in the UK (https://www.worldpop.org/). WorldPop dataset was produced by estimating the population figures within each grid using the Random Forest model by utilizing census, construction, and topographic data. Currently, WorldPop dataset offers the highest level of accuracy among the free available long-term series data. The dataset is based on the WGS84 geodetic reference datum with a spatial resolution of approximately 100 meters at the equator.

2.3 Methods

2.3.1 Area-Radius Multidimensional Scaling Model

The radial dimension is employed to characterize the fractal properties of megacities based on the distance-decay pattern (Zhang et al., 2019). The principle can be elucidated as follows: drawing concentric rings at equidistant intervals from the city center; assuming a relationship between the radius r and the corresponding urban land area A(r) within each ring. The equation can be derived using logarithmic transformation (log-log coordinates) (Zhang et al., 2019).
$lnAr=Dlnr+ln{{A}_{0}}$
where A(r) represents the urban area within the concentric ring with radius r, and A0 is the scaling factor. The least squares method is applied to perform regression analysis on the radius r and its corresponding urban land area A(r), yielding the radial dimension (D) as the slope of the regression equation. The value of D indicates the rate of space infill and the decline in urban land density from the city center to the suburbs. When D exceeds 2, urban land density gradually increases from the center to the suburbs. If D equals 2, urban land density remains constant. Otherwise, urban land density decreases, along with a decrease in the proportion of urban landfills.
The Central Business District (CBD) in each megacity was regarded as the reference point for creating concentric circles, with each circle formed by progressively expanding 1 km buffer zones. The CBD locations were sourced from the Atlas of Urban Sprawl (Angel et al., 2016). Google Maps were also used to determine the CBD locations for cities not included in the Atlas. In the case of polycentric megacities, the locations and numbers of the CBDs were initially identified. The two arbitrary center points were then selected, and the ring with the lowest land use density between them was determined. The iterative process above was repeated for the remaining center points until the buffer areas were delineated (Figure 1). In the dual logarithmic coordinate diagram illustrating urban area and radius, a distinct inflection point can be observed. The points before the inflection point represent the inner urban area, corresponding to the first scale range. Conversely, the points after the inflection point constitute the outer urban area, representing the second scale range. The inflection point was determined using the minimum residual sum of squares method.
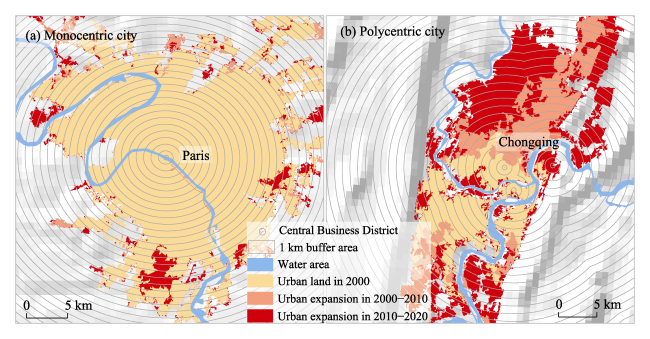
Figure 1 Division of concentric ring layers in the cities of Paris and Chongqing

2.3.2 Urban Expansion Intensity Differentiation Index

The Urban Expansion Intensity Differentiation Index (UEDI) is the ratio of the urban expansion intensity of a specific city to those of all the cities (Guan et al., 2012), which reflects the difference in urban expansion intensity in various cities. The UEDI is standardized for the total land area of all cities, and the expansion intensity among the cities are then comparable over the same period.
$UED{{I}_{n}}=\frac{\left| UL_{n}^{{{t}_{2}}}-UL_{n}^{{{t}_{1}}} \right|\times U{{L}^{{{t}_{1}}}}}{\left| U{{L}^{{{t}_{2}}}}-U{{L}^{{{t}_{1}}}} \right|\times UL_{n}^{{{t}_{1}}}}$
where UEDIn represents the n-th urban expansion intensity differentiation index, while $UL_{n}^{{{t}_{1}}}$ and $UL_{n}^{{{t}_{2}}}$ are the area of the n-th urban land area during periods t1 and t2, respectively. $U{{L}^{{{t}_{1}}}}$ and $U{{L}^{{{t}_{2}}}}$ indicate the total urban land use area during period t1 and period t2, respectively.

3 Results

3.1 Spatiotemporal patterns of urban land changes in megacities

Urban expansion patterns have exhibited obvious variations among 33 megacities since the beginning of the 21st century. Megacities located in high-income countries possessed the most extensive urban land areas, while those in developing countries of Asia experienced the fastest urban expansion. Conversely, Europe and South America were witnessed relatively stable urban areas with minimal expansion intensity. The urban land areas of global 33 megacities amounted to 5.36×10⁴ km2 in 2020. Notably, Los Angeles, New York, and Tokyo emerged as the cities boasting the most substantial urban land areas, each surpassing 3000 km2. Collectively, these three cities accounted for 29.38% of the total urban land area across all megacities. In contrast, Bogotá, Mumbai, and Dhaka possessed urban land areas of less than 500 km2 (Figure 2).
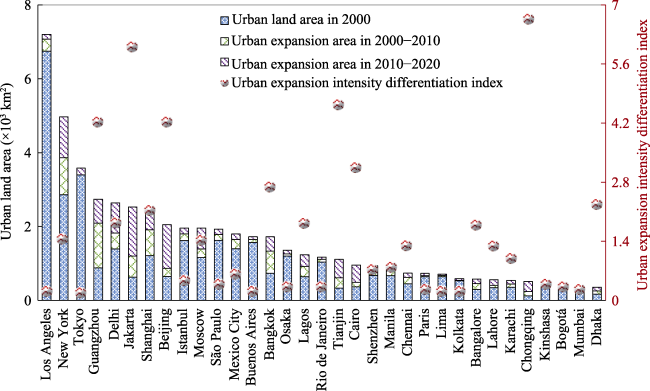
Figure 2 Urban expansion areas and urban expansion intensity differentiation index of megacities during 2000-2020
Urban expansion of megacities had predominantly occurred in developing Asian countries since 2000. Chongqing and Jakarta stood out with the most extensive UEDI values of 6.69 and 6.05, respectively (Figure 2). These two cities had expanded individual urban land areas by more than three times since 2000. Conversely, Paris, Lima, and Rio de Janeiro exhibited the UEDI values below 0.30, indicating an urban expansion area of less than 150 km2 over the past two decades. Megacities were classified into three types based on the UEDI: megacities with a stable urban land area (SULA, UEDI < 1), megacities with a slowly expanding urban land area (SEULA, 1 ≤ UEDI < 2), and megacities with a rapidly expanding urban land area (REULA, UEDI ≥ 2).

3.2 Analysis of the bi-fractal features in megacities

The sample points of megacities were fitted wholly and segmented in 2000, 2010, and 2020, respectively. The piecewise regression model demonstrated a markedly superior fit, as indicated by the higher R2 value. The results show that megacities conform to the bi-fractal city model (White et al., 1993). Specifically, the urban area of megacities can be divided into two scalar zones. The radial dimensional difference of the first and second zones represents the variation between these zones. The smaller radial dimensional difference, the more balanced development between the inner and outer urban areas.

3.2.1 Area-radius log-log curve features in megacities

The area-radius log-log curve features of megacities with distinct expanded patterns were exhibited varied from 2000 to 2020. The curves for the SULA megacities displayed no noticeable interannual differences (Figure 3). In contrast, the maximum logarithmic value of the urban area increased annually for the SEULA and the REULA megacities. The curves representing the SEULA megacities showed minor interannual changes and a gradual upward trend (Figure 4), suggesting that urban areas expanded into smaller regions in the periods 2000-2010 and 2010-2020. Conversely, the REULA megacities displayed notable interannual changes (Figure 5), with progressively steeper slopes. This trend indicated periodic expansions in urban land areas and a tendency towards rapid urban sprawl.
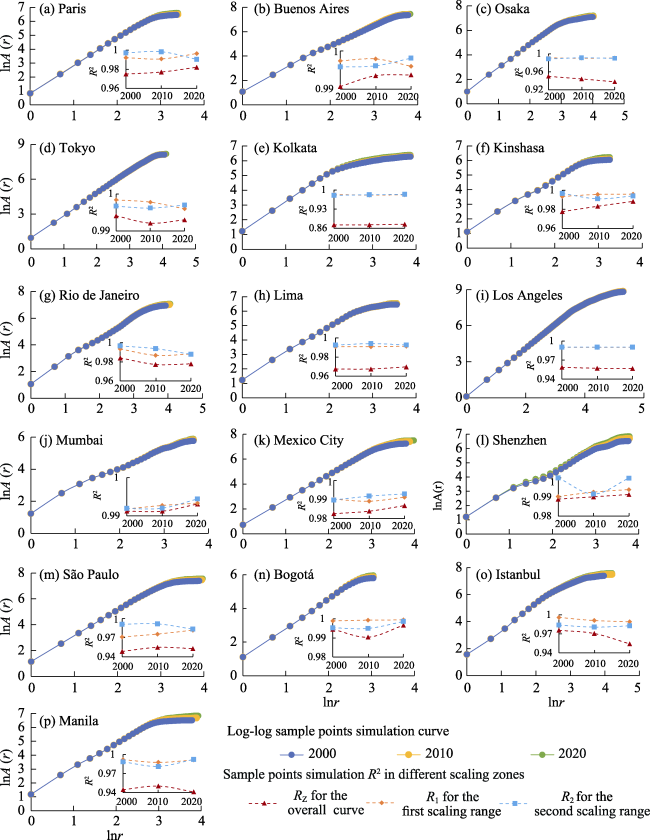
Figure 3 Log-log plots of radius and urban land area in stable megacities
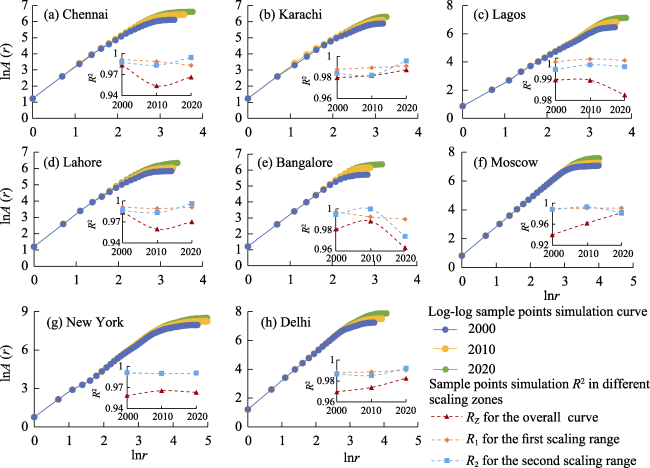
Figure 4 Log-log plots of radius and urban land area in slowly expanded megacities
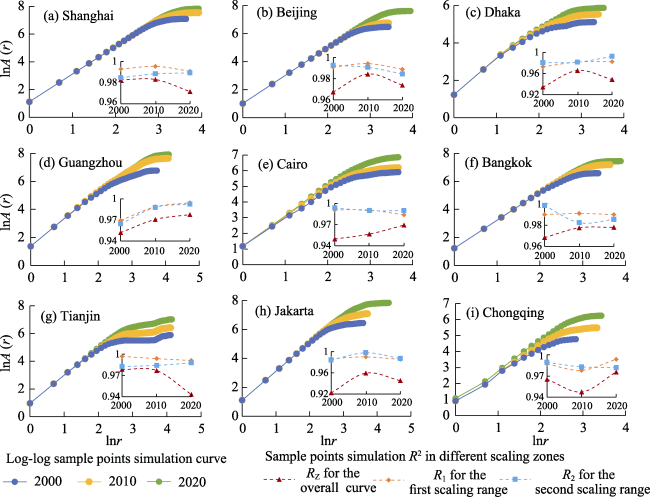
Figure 5 Log-log plots of radius and urban land area in rapidly expanded megacities
The SULA megacities mostly had already reached the later phase of urbanization, where urban expansion had shown the accessible limits of land use due to natural geographical constraints. For cities that had entered this phase before the 21st century, such as Los Angeles, Tokyo, and Osaka, the logarithmic differences of urban land areas in 2000-2020 were less than 0.10, indicating a generally stable urban spatial scale (Figure 3). In contrast, São Paulo, located in the foothills of the Mar Mountains on the southeastern edge of the Brazilian Plateau, was characterized by a rolling interior. Urbanization has transformed almost all flat basin areas into urban regions in São Paulo. Similarly, Istanbul had a linear urban morphology constrained by geographical features such as the coast and mountains. The urban land area expanded towards the piedmont and coast with the progression of urbanization.
The SEULA megacities in India and Pakistan exhibited logarithmic differences in urban land area ranging between 0.40 and 0.70 in 2000-2020. Bangalore, Lagos, and Delhi, with logarithmic differences above 0.64, experienced more pronounced expansion. The urban land area of the SEULA megacities remained stable in the periods 2000-2010 and 2010-2020, suggesting no apparent phases of change over the past two decades (Figure 4). In addition, the REULA megacities were mainly distributed across China and Southeast Asia. Jakarta and Chongqing had the largest gaps between the curves of the three decades (Figure 5), with logarithmic differences in urban land area at 1.40 and 1.47, respectively. These logarithmic differences implied a substantial increase in urban land area during the first and second decades. For Cairo, Bangkok, and Guangzhou, the logarithmic differences in the same period were the most remarkable, indicating staged urban expansion.

3.2.2 Determination of scaling ranges and the variations of radial dimension

The SULA megacities exhibited a consistently larger radius of the inner urban areas, indicating a stable trend over time. Conversely, the REULA megacities showed the smallest inner urban area radius with notable fluctuations (Figure 6). The distribution of inner urban area radius aligned with the law of urban spatial scale. Megacities like Los Angeles, New York, and Tokyo, with urban land areas exceeding 3000 km2, exhibited the largest inner urban area radius, exceeding 50 km. In contrast, megacities with less than 600 km2, such as Bogotá and Kolkata, had a smaller inner urban area radius of less than 15 km. The variation in inner urban area radius corresponded to the urban expansion pattern observed in megacities. Megacities like Guangzhou, Jakarta, Beijing, and Shanghai experienced the largest expansion, with the inner urban area radius increasing by over 10 km. Conversely, for the SULA megacities, such as Bogotá, Lima, Paris, and Los Angeles, the inner urban area radius remained stable over the past two decades.
Figure 6 Scaling ranges of megacities in 2000, 2010, and 2020
The morphological features of megacities were increasingly intensive, emphasizing balanced development and resulting in compact patterns. Inland SULA megacities exhibited relatively stable morphological features, with the radial dimension fluctuating around 0.03 between 2000 and 2020. The average radial dimension value reached approximately 1.70 in 2020, indicating a gradual decrease in urban land density from the city center to the suburbs, and contributing to a compact urban pattern. In contrast, cities along the coast lines or divided by rivers displayed more decentralized urban morphological features. For example, Manila and Istanbul had radial dimensions of 1.37 and 1.42, respectively. Paris, Bogotá, and Kinshasa had radial dimensions greater than 1.60, with a difference of less than 0, indicating relatively balanced urban development and integration. However, Tokyo, Buenos Aires, Istanbul, and Mumbai exhibited the most pronounced radial dimension differences, suggesting an unbalanced development between inner and outer urban areas and a fractal anisotropy of urban land morphology.
The urban morphology of the developing SEULA and REULA megacities underwent intensification and stability. The average radial dimension of the SEULA megacities was 1.63, representing an increase of 0.30 since 2000. This trend in the radial dimension indicated a slower decline in urban land density from the city center to the suburbs, a reduction in the disparity between inner and outer urban areas, and a more compact urban development. In 2020, Moscow, Lagos, and Delhi exhibited radial dimensions of 1.75, 1.74, and 1.72, respectively, signifying the filling of inner urban areas and the clustering of urban forms. Moscow, Delhi, Karachi, and New York experienced a radial dimension difference of less than 0 between 2000 and 2020, highlighting the prominence of balanced urban development. The radial dimension of the REULA megacities exhibited a year-to-year increase, albeit lower than the SULA and the SEULA megacities. Cities such as Cairo, Guangzhou, and Jakarta witnessed an annual increase of 0.1 or higher in the radial dimension between 2000 and 2020, suggesting the need for balanced urban development. Shanghai, Beijing, Cairo, and Dhaka had a radial dimension difference between inner and outer urban areas exceeding 0.10. These cities experienced a low-density expansion in their outer urban areas, displaying prominent anisotropic features.

3.3 Analysis of the urban expansion patterns in megacities

The degree of urban sprawl, as a primary metric in studying urban expansion, is determined by the level of compactness observed in the cities. Theoretical classification of urban expansion patterns identifies a transitional state when the expansion rates of the inner and outer urban areas converge. Neither compactness nor sprawl is dominant with the expansion rate of the outer urban area ranging from 0.90 to 1.10 times that of the inner urban area (Figure 8). Conversely, if the expansion rate of the inner urban area surpasses that of the outer urban area, the urban expansion pattern is considered compact; otherwise, it is identified as sprawl type. Furthermore, the city is categorized as transitional type, when the rate of change between the inner and outer urban areas remains less than 0.05.
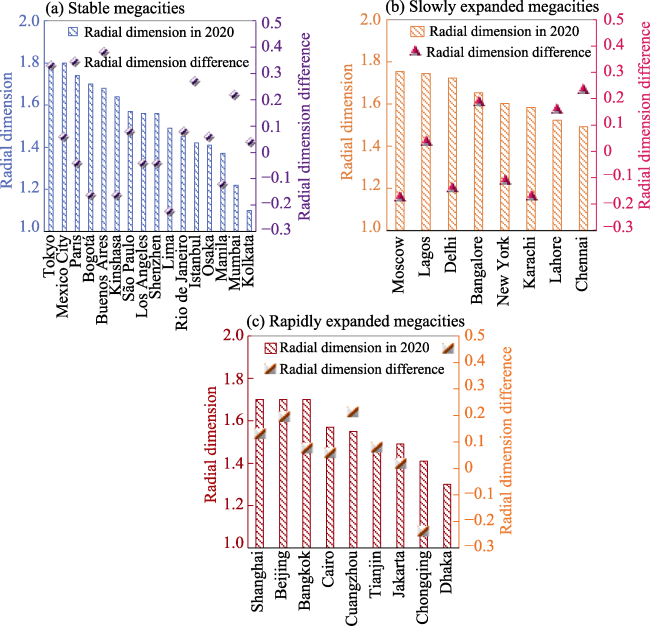
Figure 7 Changes of a radial dimension difference in megacities in 2000-2020
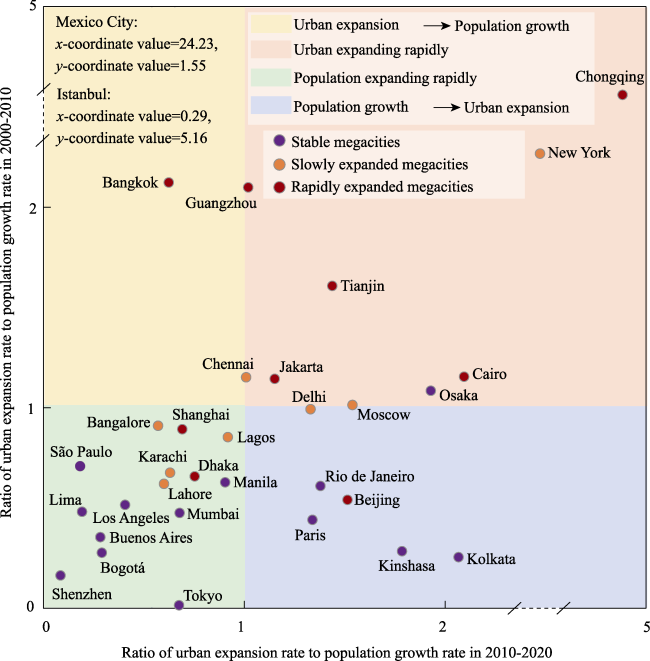
Figure 8 Changes in urban expansion rates for megacities in the periods 2000-2010 and 2010-2020

Note: The coordinates of individual cities are not shown in the figure as they fall outside the range of the axes. However, their coordinates are provided in the diagram. Cities located in the upper-left region demonstrate a sprawling pattern, while those in the shaded transitional region exhibit intermediate characteristics. In contrast, cities in the lower-right region display a compact urban form.

The patterns of urban expansion in megacities were primarily recognized as compact and transitional types. The inner and outer urban areas of the SULA megacities expanded simultaneously with the exception of Mexico City. Twelve megacities demonstrated transitional expansion patterns. Shenzhen, Janeiro, and Kolkata exhibited compact expansion patterns, characterized by an expansion ratio of less than 0.6 between the outer and inner urban areas. It was indicated that urban expansion in above cities primarily occurred through internal infill. Conversely, Mexico City experienced sprawling urban expansion, with the ratio of urban expansion between the outer and inner urban areas increasing from 1.14 to 1.52 for two decades. The trend of urban sprawl in Mexico City worsened over time.
The urban expansion pattern underwent a transition from sprawl to compactness in the SEULA megacities, such as Lahore. Urban expansion in Lahore was initially concentrated in the outer city, with the expansion ratio of the outer city being 1.40 times that of the inner city in 2000-2010. However, the ratio decreased to 0.71 during 2010-2020, indicating a shift towards internal infill and the emergence of more compact urban patterns.
Urban expansion in Moscow had consistently been sprawling; however, the rate of expansion between the outer and inner cities decreased from 1.38 to 1.09 in the periods 2000-2010 and 2010-2020, indicating a weakening trend in urban sprawl. The REULA megacities also experienced a shift in the expanding patterns, transitioning from sprawl or transitional to compact types. For instance, Bangkok demonstrated a reduction in the expansion rate from the outer to inner urban areas, with the rate decreasing from 1.10 in 2000-2010 to 0.96 in 2010-2020, resulting in a more compact pattern.

4 Discussion

The process of urban expansion and morphological variation is a complex phenomenon (Hamidi et al., 2015; Stokes et al., 2019), requiring comprehensive examination from multiple perspectives to understand its characteristics and impact on sustainable urban development. Urban land has expanded at a much faster pace than population growth, leading to urban sprawl (Adhikari et al., 2017; Gao et al., 2020). The current stage of urban development emphasizes sustainability, with urban land per capita identified as a critical indicator of sustainable urbanization, as emphasized by the United Nations’ 2030 Agenda for Sustainable Development (UN, 2021). We investigated the efficiency of urban land use by examining various morphological features and expansion patterns and quantifying the relationship between urban land area and population.

4.1 The synergy between urban expansion and population

The synergy of population-land varies notably across global 33 megacities with different expansion patterns. The SULA and the SEULA megacities experienced a higher rate of population growth than urban expansion. Conversely, the REULA megacities, such as Guangzhou, Chongqing, Tianjin, and Jakarta, observed rapid urban expansion, with the expansion rate exceeding that of population growth in the periods 2000-2010 and 2010-2020, respectively (Figure 9). In these instances, urban expansion tended to be extensive, resulting in lower land use efficiency in socio-demographic aspects (Lin et al., 2015; Ouyang et al., 2020). The rate of urban population growth had not kept pace with urban expansion, primarily due to the lag effect of population aggregation. As a result, there has been limited coordination between population and urban area development, which aligns with conclusions drawn from a comprehensive analysis of global urban expansion (Seto et al., 2011). The SULA megacities, including Lima, Buenos Aires, São Paulo, as well as urban land areas smaller than 1000 km2, experienced a faster rate of population growth than urban expansion. These cities exhibited a transitional or compact expansion pattern, with their urban areas largely stable. The concentration of population in megacities has led to rapid population growth and more compact urban development (Van et al., 2008; Georg et al., 2016).
Figure 9 Ratio of urban expansion rate to the population growth rate in megacities

Note: The coordinates of individual cities are not depicted on the map due to their placement beyond the axis range. However, these coordinates are provided within the map for reference.

4.2 Comparison of land use efficiencies among the megacities

Urban land use efficiency is closely tied to the level of economic development, with higher-income regions often exhibiting lower land use efficiency. Conversely, smaller cities in developing countries tend to demonstrate higher land use efficiency. The relationship between urban land area and population can be quantified using simple linear regression, revealing correlation coefficients above 0.93 (Figures 10-12). These coefficients serve as indicators of urban land per capita, with higher values suggesting larger urban land per capita and lower land use efficiency. Notably, Los Angeles and New York exhibited maximum coefficients of three or above, implying lower land use efficiency and less compact urban patterns (Chi et al., 2015). This aligns with findings from previous study on human footprint trends in the United States from 2000 to 2010, indicating high urban area per capita in American megacities (Vogler et al., 2021). In contrast, Tokyo, Moscow, Osaka, Istanbul, Bangkok, and Buenos Aires showed coefficients ranging from 1 to 1.40, indicating higher urban land use efficiency. Dhaka, Mumbai, and Karachi, as smaller cities with urban land areas less than 1000 km2, exhibited coefficients below 0.50. In these cases, the speed of urban population growth surpassed that of urban expansion, resulting in limited urban land areas per capita and compact urban development. The patterns could also lead to urban development challenges, such as flooding (Alam et al., 2014), traffic congestion (Chang et al., 2017), and reduced green space (Dong et al., 2022).
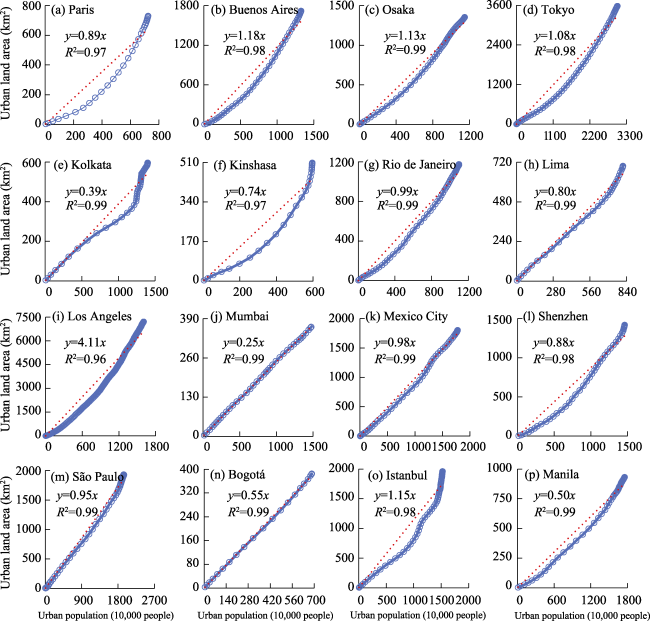
Figure 10 Relationship between urban land area and population in stable megacities
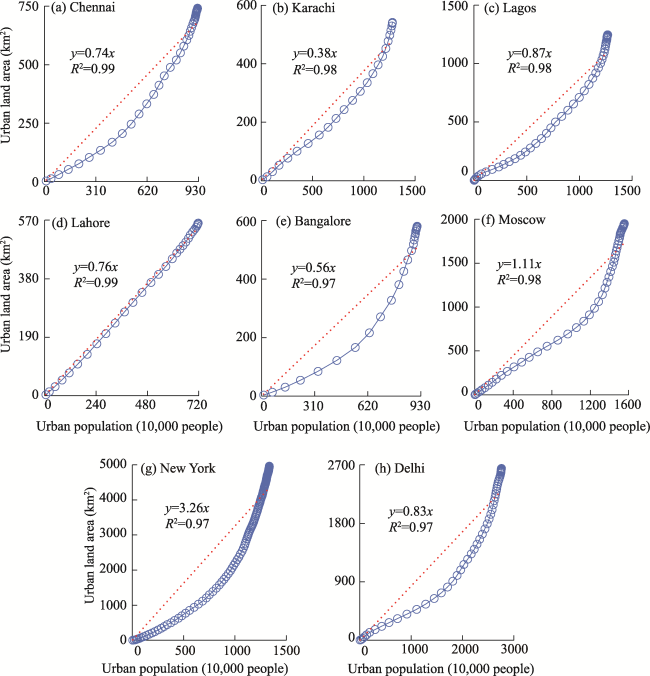
Figure 11 Relationship between urban land area and population in slowly expanded megacities
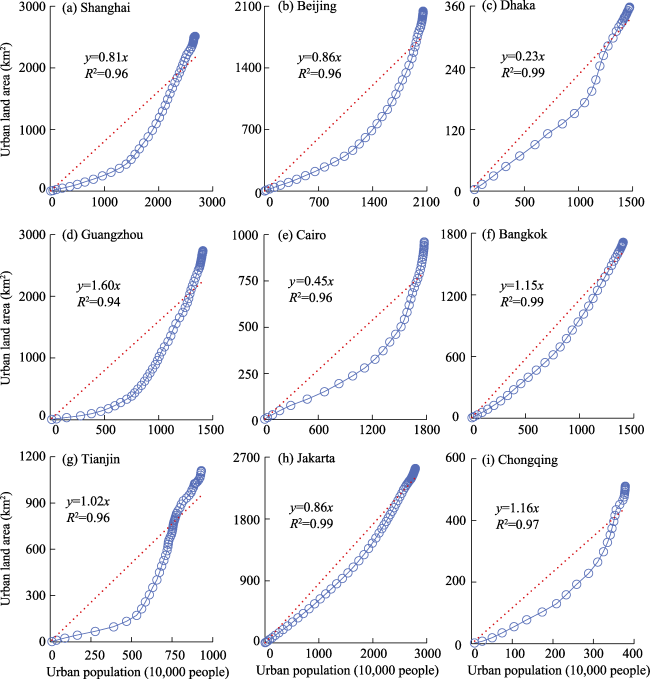
Figure 12 Relationship between urban land area and population in rapidly expanded megacities

5 Conclusions

The bi-fractal features and expansion patterns of global 33 megacities in 2000-2020 were analyzed utilizing the ARMSM based on the GULUC-30 and WorldPop data. Megacities exhibited substantial disparities in urban land areas and expansion patterns, resulting in notable variations in urban land use efficiency over the past two decades. The urban morphological features of the SULA megacities, including Los Angeles, New York, and Tokyo, remain relatively consistent, with urban land areas more than 3000 km2 and radial dimensions falling within the value of 0.04. These cities maintained compact or stable urban expansion patterns in the last 20 years, despite of the lower land use efficiency due to social and environmental impacts. However, the expansion patterns and morphological features of the REULA megacities, such as Jakarta, Tianjin, and Lahore, progressed towards intensification and sustainability, as evidenced by the UEDIs value exceeding 3 and radial dimensions value of less than 1.71. Moreover, the radial dimension demonstrated an annual increase, indicating a trend towards more compact urban development. Sixteen megacities exhibited a radial dimension difference value of less than 0.05, signifying a shift from sprawl to stable or compact urban expansion patterns. Megacities with urban land areas less than 1000 km2 demonstrated a slower urban expansion proportion, reflecting a more balanced urban development and higher urban land use efficiencies, which were attributed to faster population growth outpacing urban expansion.
The United Nations advocates for the achievement of the Sustainable Development Goals (SDGs), which seeks to foster inclusive, safe, resilient, and sustainable cities. The morphological characteristics and expansion patterns of megacities were investigated, with a particular focus on evaluating the efficiency of urban land use. To this end, the simple linear regression model was employed to establish the relationship between urban population and urban land areas. The findings could offer scientific insights and theoretical underpinnings for attaining sustainable development objectives and informing urban planning efforts.
[1]
Adhikari P, de Beurs K M, 2017. Growth in urban extent and allometric analysis of West African cities. Journal of Land Use Science, 12(2/3): 105-124.

DOI

[2]
Alam M J, 2014. “The organized encroachment of land developers”: Effects on urban flood management in Greater Dhaka, Bangladesh. Sustainable Cities and Society, 10: 49-58.

DOI

[3]
Angel S, 2016. Atlas of Urban Expansion. 2016 Atlas of Urban Expansion. 2016 Edition. Volume 1: Areas and Densities. http://www.atlasofurbanexpansion.org.

[4]
Angel S, Parent J, Civco D L et al., 2011. The dimensions of global urban expansion: Estimates and projections for all countries, 2000-2050. Progress in Planning, 75(2): 53-107.

DOI

[5]
Benguigui L, Czamanski D, 2004. Simulation analysis of the fractality of cities. Geographical Analysis, 36(1): 69-84.

DOI

[6]
Bosch M, Jaligot R, Chenal J, 2020. Spatiotemporal patterns of urbanization in three Swiss urban agglomerations: Insights from landscape metrics, growth modes and fractal analysis. Landscape Ecology, 35(4): 879-891.

DOI

[7]
Chang Y S, Lee Y J, Choi S S B, 2017. Is there more traffic congestion in larger cities? Scaling analysis of the 101 largest US urban centers. Transport Policy, 59: 54-63.

[8]
Chen Y G, 2020. Fractal modeling and fractal dimension description of urban morphology. Entropy, 22(9): 961.

DOI

[9]
Chen Y G, Wang J J, Feng J, 2017. Understanding the fractal dimensions of urban forms through spatial entropy. Entropy, 19(11): 600.

DOI

[10]
Chen Y G, Wang Y H, Li X J, 2019. Fractal dimensions derived from spatial allometric scaling of urban form. Chaos, Solitons & Fractals, 126: 122-134.

[11]
Chi W F, Shi W J, Kuang W H, 2015. Spatio-temporal characteristics of intra-urban land cover in the cities of China and USA from 1978 to 2010. Journal of Geographical Sciences, 25(1): 3-18.

DOI

[12]
Djehdian L A, Chini C M, Marston L et al., 2019. Exposure of urban food-energy-water (FEW) systems to water scarcity. Sustainable Cities and Society, 50: 101621.

DOI

[13]
Dong T, Jiao L M, Xu G et al., 2019. Towards sustainability? Analyzing changing urban form patterns in the United States, Europe, and China. Science of the Total Environment, 671: 632-643.

DOI

[14]
Dong Y L, Ren Z B, Fu Y et al., 2022. Decrease in the residents’ accessibility of summer cooling services due to green space loss in Chinese cities. Environment International, 158: 107002.

DOI

[15]
Dutta D, Rahman A, Paul S K et al., 2021. Impervious surface growth and its inter-relationship with vegetation cover and land surface temperature in peri-urban areas of Delhi. Urban Climate, 37: 100799.

DOI

[16]
Encarnação S, Gaudiano M, Santos F C et al., 2012. Fractal cartography of urban areas. Scientific Reports, 2(1): 527.

DOI

[17]
Estoque R C, Murayama Y, 2015. Intensity and spatial pattern of urban land changes in the megacities of Southeast Asia. Land Use Policy, 48: 213-222.

DOI

[18]
Frankhauser P, 1998. The fractal approach: A new tool for the spatial analysis of urban agglomerations. Population, 10: 205-240.

DOI

[19]
Frankhauser P, Tannier C, Vuidel G et al., 2018. An integrated multifractal modelling to urban and regional planning. Computers Environment and Urban Systems, 67: 132-146.

DOI

[20]
Gao J, O'Neill B C, 2020. Mapping global urban land for the 21st century with data-driven simulations and shared socioeconomic pathways. Nature Communications, 11(1): 2302.

DOI PMID

[21]
Georg I, Blaschke T, Taubenböck H, 2016. New spatial dimensions of global cityscapes: From reviewing existing concepts to a conceptual spatial approach. Journal of Geographical Sciences, 26(3): 355-380.

DOI

[22]
Guan X L, Fang C L, Zhou M et al., 2012. Spatial and temporal characteristics of spatial expansion of urban land in Wuhan urban agglomeration. Journal of Natural Resources, 27(9): 1447-1459. (in Chinese)

[23]
Hai K, Wang S Y, Ma Y X et al., 2018. Urban expansion and form changes along the Belt and Road Initiative. Acta Geographica Sinica, 75(10): 2092-2108. (in Chinese)

[24]
Hamidi S, Ewing R, Preuss I et al., 2015. Measuring sprawl and its impacts: An update. Journal of Planning Education and Research, 35(1): 35-50.

DOI

[25]
Jevric M, Romanovich M, 2016. Fractal dimensions of urban border as a criterion for space management. In: 15th International Scientific Conference Underground Urbanisation as a Prerequisite for Sustainable Development, 165: 1478-1482.

[26]
Lagarias A, Prastacos P, 2020. Comparing the urban form of South European cities using fractal dimensions. Environment and Planning B: Urban Analytics and City Science, 47(7): 1149-1166.

[27]
Li X C, Zhou Y Y, Hejazi M et al., 2021. Global urban growth between 1870 and 2100 from integrated high resolution mapped data and urban dynamic modeling. Communications Earth & Environment, 2(1): 201.

[28]
Liang L, Gong P, 2020. Urban and air pollution: A multi-city study of long-term effects of urban landscape patterns on air quality trends. Scientific Reports, 10(1): 18618.

DOI PMID

[29]
Liu X P, Huang Y H, Xu X C et al., 2020. High-spatiotemporal-resolution mapping of global urban change from 1985 to 2015. Nature Sustainability, 3(7): 564-570.

DOI

[30]
Lin X Q, Wang Y, Wang S J et al., 2015. Spatial differences and driving forces of land urbanization in China. Journal of Geographical Sciences, 25(5): 545-558.

DOI

[31]
Mahtta R, Mahendra A, Seto K C, 2019. Building up or spreading out? Typologies of urban growth across 478 cities of 1 million+. Environmental Research Letters, 14(12): 124077.

DOI

[32]
Mandal J, Ghosh N, Mukhopadhyay A, 2019. Urban growth dynamics and changing land-use land-cover of megacity Kolkata and its environs. Journal of the Indian Society of Remote Sensing, 47(10): 1707-1725.

DOI

[33]
Ou J P, Liu X P, Li X et al., 2016. Quantifying spatiotemporal dynamics of urban growth modes in metropolitan cities of China: Beijing, Shanghai, Tianjin, and Guangzhou. Journal of Urban Planning and Development, 143(1): 04016023.

DOI

[34]
Ouyang X, Zhu X, 2020. Spatio-temporal characteristics of urban land expansion in Chinese urban agglomerations. Acta Geographica Sinica, 75(3): 571-588. (in Chinese)

DOI

[35]
Seto K C, Fragkias M, Güneralp B et al., 2011. A meta-analysis of global urban land expansion. Plos One, 6(8): e23777.

DOI

[36]
Song C Q, Cheng C X, Shi P J et al., 2018. Geography complexity: New connotations of geography in the new era. Acta Geographica Sinica, 73(7): 1204-1213. (in Chinese)

DOI

[37]
Stokes E C, Seto K C, 2019. Characterizing and measuring urban landscapes for sustainability. Environmental Research Letters, 14(4): 045002.

DOI

[38]
Tannier C, Thomas I, Vuidel G et al., 2011. A fractal approach to identifying urban boundaries. Geographical Analysis, 43(2): 211-227.

DOI

[39]
United Nations UN, 2018. World Urbanization Prospects: The 2018 Revision. https://www.un.org/development/desa/publications/2018-revision-of-world-urbanization-prospects.html.

[40]
United Nations UN, 2021. Sustainable Development Goals Metadata Repository-SDG Indicator Metadata: Format Version 1.0. https://unstats.un.org/sdgs/metadata/files/Metadata-11-03-01.pdf.

[41]
van der Ploeg F, Poelhekke S, 2008. Globalization and the rise of mega-cities in the developing world. Cambridge Journal of Regions, Economy and Society, 1(3): 477-501.

[42]
Vogler J B, Vukomanovic J, 2021. Trends in United States human footprint revealed by new spatial metrics of urbanization and per capita land change. Sustainability, 13(22): 12852.

DOI

[43]
Wang J, Chen Y, Liao W L et al., 2021. Anthropogenic emissions and urbanization increase risk of compound hot extremes in cities. Nature Climate Change, 11(12): 1084-1089.

DOI

[44]
Wang Q A, Shi J C, Liu Q H et al., 2020. Global ecosystems and environment observation analysis report cooperation: Global Urban Land Composite and Expansion in 2000-2020. (in Chinese)

[45]
White R, Engelen G, 1993. Cellular automata and fractal urban form: A cellular modelling approach to the evolution of urban land-use patterns. Environment and Planning A: Economy and Space, 25(8): 1175-1199.

DOI

[46]
Worldpop, 2020. Open Spatial Demographic Data and Research. https://www.worldpop.org/.

[47]
Xu G, Dong T, Cobbinah P B et al., 2019. Urban expansion and form changes across African cities with a global outlook: Spatiotemporal analysis of urban land densities. Journal of Cleaner Production, 224: 802-810.

DOI

[48]
Zhang F, Chen Y G, Li X S, 2019. Radial dimension analysis of growth and form of cities in the Beijing-Tianjin-Hebei region. Progress in Geography, 38(1): 65-76. (in Chinese)

DOI

[49]
Zhang Y, Wang H Y, Xie P et al., 2020. Revisiting spatiotemporal changes in global urban expansion during 1995 to 2015. Complexity, 2020: 6139158.

[50]
Zheng Q M, Weng Q H, Wang K, 2021. Characterizing urban land changes of 30 global megacities using nighttime light time series stacks. ISPRS Journal of Photogrammetry and Remote Sensing, 173: 10-23.

DOI

Outlines

/