Research Articles

Impact of the producer services agglomeration on PM2.5: A case study of the Yellow River Basin, China

  • LIU Yan ,
  • CHENG Yu , * ,
  • ZHENG Ruijing ,
  • ZHAO Huaxue ,
  • WANG Yaping
Expand
  • College of Geography and Environment, Shandong Normal University, Jinan 250358, China
* Cheng Yu (1984-), PhD and Professor, specialized in economic geography and regional sustainable development. E-mail:

Liu Yan (1995-), PhD Candidate, specialized in economic geography and regional development. E-mail:

Received date: 2022-11-27

  Accepted date: 2023-07-20

  Online published: 2023-11-15

Supported by

National Natural Science Foundation of China(41871121)

Key Research and Development Program of Shandong Province (Soft Science Major Project)(2022RZA01007)

Shandong Province Social Science Planning Research Project(22CJJJ06)

Abstract

Regional and persistent PM2.5 pollution seriously undermines the development of urban ecological civilizations and the advancement of high-quality economies. The producer service sector, an example of a typical knowledge-intensive service industry, plays an important role in advancing the manufacturing industry and fostering economic growth while concurrently improving urban environmental conditions. Based on panel data of prefecture-level cities in the Yellow River Basin from 2006 to 2019, this study constructed a Spatial Durbin Model and a mediation effect model to comprehensively explore the impact of producer services agglomeration on PM2.5 pollution. The main conclusions are as follows: (1) From 2006 to 2019, PM2.5 pollution in the study area exhibited an initial rise followed by a subsequent decline, with notable spatial heterogeneity. PM2.5 pollution in the lower reaches of the Yellow River was significantly higher than in the middle and upper reaches. In addition, the spatial pattern of producer services agglomeration showed distinct “core-edge” characteristics. (2) The agglomeration of producer services had a significant negative impact on local and adjacent PM2.5 pollution, and there was a more pronounced haze reduction effect in the case of specialized agglomerations of producer services and low-end producer services. (3) The agglomeration of producer services indirectly improved PM2.5 pollution by promoting technological innovation and optimizing industrial structure, with the latter playing a greater mediating effect. This study not only helps expand the theoretical and empirical research on producer services agglomeration but also offers valuable insights for pursuing a green transformation of the Yellow River Basin by optimizing industrial patterns through the producer services sector. This approach represents a reference for curbing PM2.5 pollution and guiding the region toward a greener future.

Cite this article

LIU Yan , CHENG Yu , ZHENG Ruijing , ZHAO Huaxue , WANG Yaping . Impact of the producer services agglomeration on PM2.5: A case study of the Yellow River Basin, China[J]. Journal of Geographical Sciences, 2023 , 33(11) : 2295 -2320 . DOI: 10.1007/s11442-023-2177-8

1 Introduction

The Yellow River Basin, as an important ecological barrier and a key area of economic transformation and development, plays a crucial role in driving China’s modernization process (Yao et al., 2016; He et al., 2022; Tang et al., 2023). However, its industrial structure is dominated by heavy and chemical industries, which are responsible for high energy consumption, high emissions, and high water consumption. Extensive development has led to additional environmental problems, among which air pollution is particularly serious (Zhao et al., 2022). According to the statistics from China’s Ministry of Ecology and Environment, 15 of China’s 20 poorest air quality cities in 2022 were located in the Yellow River Basin (Yao et al., 2019). A high concentration of PM2.5 is one of the main factors causing air pollution (Latif et al., 2018). Research has shown that PM2.5 harms the well-being and health of urban residents, greatly constrains economic growth and social stability, and severely challenges the sustainability of economic growth (Sumit et al., 2021).
Industrial spatial agglomeration is an important characteristic of modern economic development and has attracted the research interests of many scholars (Fernandes and Paunov, 2012; Diodato et al., 2018). Yang et al. (2021) pointed out that industrial agglomeration can positively affect the environment through energy saving and consumption reduction. As producer services are separated from manufacturing through outsourcing, they are gradually embedded in all production steps as intermediate inputs and become important factors in promoting industrial and technological progress, optimizing urban industrial structure, and fostering new drivers of economic growth (Dllek and Carlsson, 1999; Joseph and Julia, 2008). Based on the context above, this study chose the Yellow River Basin as the research region to explore the following questions: (1) Does the agglomeration of producer services exacerbate or mitigate the concentration of PM2.5? (2) From the standpoint of regional and industry heterogeneity, what is the impact of producer services agglomeration on PM2.5 based on the spatial spillover perspective? (3) Do technological innovation and industrial structure play a mediating role between producer services agglomeration and PM2.5 pollution? This research adopted the Spatial Durbin Model (SDM) and the mediation effect model, considering green technology innovation and industrial structure as mediating factors, to explore the influence and mechanism of producer services agglomeration on PM2.5 pollution.

2 Literature review

Several studies have confirmed that PM2.5 pollution not only increases the likelihood of respiratory diseases and per capita health cost but also harms economic and social development (Othman et al., 2014; Aik, 2020). For example, this type of pollution can negatively affect the tourism economy (Hao et al., 2021), household consumption power, and the availability of highly skilled workers (Lu et al., 2018; Agarwal et al., 2020). PM2.5 pollution is influenced by air temperature, amount of precipitation, terrain, and other natural factors (Hannah et al., 2021; Ngoc et al., 2021). In recent years, the effect of human activities on PM2.5 has attracted increasing attention (Zhou et al., 2021), identifying industrial agglomeration as one of the primary factors that cause PM2.5 (Chen et al., 2022). From the standpoint of the agglomeration economy theory, there are three main views of how industrial agglomeration affects PM2.5.
The first standpoint holds that industrial agglomeration can expand the scale of production (Yang et al., 2019) and increase energy usage demand (Li et al., 2018), thereby bringing negative externalities and exacerbating pollution emissions (Cai and Hu, 2022). For example, the spatial agglomeration of heavy chemical industries (e.g., cement) tends to lead to severe haze pollution (Mishra et al., 2022). As demonstrated by Hong et al. (2020), industrial specialization agglomeration may produce congestion and aggravate environmental pollution. Specifically, industrial agglomeration mainly intensifies environmental pollution in two ways: First, excessive agglomeration of industries in cities may result in crowding. Empirical studies have shown that industrial agglomeration may bring about pollution agglomeration and aggravate environmental pollution problems (Dong et al., 2020). Moreover, the excessive agglomeration of energy industries also hinders regional pollution control processes (Su and Yu, 2020). Additionally, industrial agglomeration increases energy usage and pollutant releases, thereby worsening the urban environment. For example, the agglomeration of thermal power industries and the increase in energy consumption gradually aggravate regional PM2.5 pollution (Zhou et al., 2022). As pointed out by Li et al. (2021), manufacturing agglomeration expands production, increases energy usage, and aggravates regional PM2.5 pollution.
The second view holds that the positive externality of industrial agglomeration promotes industrial technological development, improves production efficiency, and controls the emission of pollutants (Sotiris, 2010; Gallagher, 2013). For example, the agglomeration of information and communication industries expands the economic scale and improves technological innovation capacity (Orsa and Johan, 2020), thereby improving carbon efficiency (Xu et al., 2023). Using data from papermaking and other manufacturing industries as an example, Tanaka and Managi (2021) found that industrial agglomeration can help improve energy efficiency and reduce energy waste at the production end. Apart from that, the diversification of industrial agglomeration has a significant spatial spillover effect, which may significantly improve the green development level of neighboring cities (Lan et al., 2021). For example, an empirical study by Peng et al. (2023) found that industrial diversification and agglomeration can improve the energy utilization efficiency of neighboring cities by sharing cost savings and promoting collaborative innovation. Besides, industrial agglomeration not only promotes energy utilization efficiency and environmental quality in central and western China (Liu et al., 2017), but also restrains environmental pollution through technological innovation and other mediating factors. Through an empirical study, Zheng and He (2022) found that technological innovation plays an active mediating role between synergistic industrial agglomeration and high-quality development. Chen et al. (2018) also claimed that industrial agglomeration directly increases the level of regional carbon emissions, but indirectly inhibits them through economic scale and technology spillover effects. In addition, Zhao et al. (2021) indicated that producer services agglomeration promotes the ecological development of industries and improves the utilization efficiency of resources and energy.
The third standpoint holds that there is a significant nonlinear effect between industrial agglomeration and environmental pollution. For example, empirical studies have pointed out an effective inverted U-shaped relationship between industrial agglomeration and PM2.5. Only when the industrial agglomeration reaches a certain stage can the positive externality brought by agglomeration improve the efficiency of resource allocation, gradually alleviate PM2.5 pollution and enhance environmental quality (Chen et al., 2022). As stated by Shen and Peng (2021), the relationship between industrial agglomeration and environmental performance presents a U-shaped curve trend. With the development of industrial agglomeration, environmental performance first declines and then rises. Other studies have shown an inverted U-shaped relationship between industrial agglomerations with green economic performance. Beyond that, the positive effect is fully displayed when industrial agglomeration grows to a certain stage (Wu et al., 2022). Industrial agglomeration has a threshold influence. Specifically, when industrial development is at a mature stage, economies of scale and technology spillovers promote industrial agglomeration, giving full play to positive externalities and effectively curbing pollutant emissions. Nevertheless, when the industry exceeds the regional environmental carrying capacity, the deterioration of regional infrastructure conditions reduces the region’s attractiveness to production factors, and negative externalities dominate and increase pollutant emissions. According to empirical studies, there is uncertainty about whether industrial agglomeration worsens or ameliorates environmental pollution. With the evolution of industrial development, the optimistic effect brought by agglomeration decreases first and then increases (Zhang et al., 2022). George and Michael (2017) examined the N-relationship between industrial agglomeration and environmental pollution through empirical research in the financial industry. A similar threshold effect has also been found between marine industrial agglomeration and the marine ecological environment. When industry development exceeds the threshold value, the effect changes from a promoting effect to an inhibiting effect (Zhang and Wang, 2021).
Although the existing studies provide theoretical guidance and reference for studying the impact of producer services agglomeration on PM2.5, there is still room for further research. First, related studies about the effect of industrial agglomeration on environmental pollution have focused on producer services, manufacturing, and internal mechanisms between clusters and environmental pollution. It is noteworthy that producer services, as high-tech industries, are concentrated in urban spaces, where they can promote clean production through technical innovation and green influence on industrial pollutants. In this way, producer services affect PM2.5 through technological innovation and industrial structure optimization. Second, existing studies generally focused on the spatial spillover effect of producer services agglomeration and PM2.5 when these were included in the analysis framework. However, there is a scarce in-depth research on the PM2.5 decrease effect of producer services agglomeration from the perspective of agglomeration externality and industry heterogeneity. Third, existing studies have focused on the national level, with relatively few examining the Yellow River Basin. Producer services, as a high-tech industry, could potentially play an important role in promoting the greening of production processes and improving air quality in the Yellow River Basin.

3 Theoretical mechanisms

3.1 Impact of producer services agglomeration on PM2.5

The agglomeration of producer services promotes the expansion of the market scale and fosters an open urban industrial environment (Liu et al., 2022). Through adjustments of the industrial structure and the concentration of production factors such as talent, technologies, and resources, producer services agglomeration can promote economic development, improve production efficiency and reduce PM2.5 emissions (Zhao et al., 2021). In comparison to traditional manufacturing, the producer service industry is a typical green industry characterized by intensive knowledge and technology utilization. The agglomeration of producer services is more likely to encourage innovative production technologies aimed at reducing pollutant emissions (Liu et al., 2022). According to the Marshall Externality theory, the agglomeration of producer services can not only strengthen communication and cooperation among enterprises through specialized services but also lead to energy savings and emission reduction in the production process (Malmberg and Maskell, 1997). In addition, the advancement of computers, information and communication, software, and producer services industries can also contribute to the development of information and communication infrastructure, promote the use of new technologies and methods, and finally achieve energy saving and consumption reduction (Wang et al., 2022a). Based on the externality theory of Jacobs, the diversified agglomeration of producer services is conducive to providing industrial enterprises with diversified outsourcing services, increasing the availability of pollution control services, promoting new technologies and processes, and further expanding the “complementary effect” among industries that reduces pollution emissions (Nielsen et al., 2021). A diversified industrial agglomeration is beneficial to the formation of a benign competition mechanism among industries that deepens the division of labor among industries, further consolidates the market pattern of division of labor and collaboration between producer services and manufacturing industries, and enhances the overall quality of industrial development (Fiona et al., 2018). As a knowledge-intensive industry with high technology content, the agglomeration of producer services can further trigger a “learning effect” and extend the value chain of products (Silvia et al., 2022). Producer services and manufacturing industries are interrelated and cooperate to form a cooperative agglomeration mode. Benefitting from the growth of information and communication technology and inter-city transportation facilities, this collaborative agglomeration mode no longer requires proximity between producer services and manufacturing industries. Instead, it shapes a geographical pattern of inter-city division of labor and cooperation. Furthermore, the spatial attributes of urban geographical patterns determine the cross-regional distribution of producer services agglomeration, potentially influencing the surrounding cities (Luis et al., 2016).

3.2 Analysis of the influence mechanism of producer services agglomeration on PM2.5

The agglomeration of producer services can stimulate urban innovation vitality through technology spillovers (Cai and Hu, 2022), promote the application of environmental protection technologies and advanced equipment, and reduce energy consumption (Li and Liu, 2022; Ye et al., 2022). Specifically, producer services can organically combine senior business concepts, specialized technical personnel, and cutting-edge production technologies with enterprise production through intermediate inputs to improve independent innovation, efficient resource allocation, and pollution control of enterprises, and finally lower air pollutant emissions (Yang et al., 2021). Additionally, the agglomeration of producer services promotes the use of new equipment and clean energy while eliminating backward production technologies.
Apart from enhancing technological innovation, the producer service industry plays a crucial role in developing the urban service industry and promoting the transformation of urban industries into high-end and ecological industries. Besides, optimizing and promoting the industrial structure in a city develops the circular economy and reduces the emission of air pollutants (Feng, 2022). Moreover, the organic integration of producer services into the manufacturing industry is helpful to drive its high-end development and reduce its dependence on resources and energy (Yan et al., 2022). Therefore, as a high-tech green industry, producer services gradually reduce the proportion of heavy and chemical industries by optimizing and promoting the industrial structure and leading to the reduction of air pollutants emissions (Cai and Hu, 2022).

4 Materials and methods

4.1 Study area

The Yellow River flows through Qinghai, Shandong, and other nine provincial-level regions, crossing the three major economic zones of eastern, western, and central China (Figure 1) (Shi and Wang, 2021; Wang and Xu, 2023). The study area covers 2.05 million square kilometers, accounting for 21% of China’s land area. By 2019, the population of the Yellow River Basin was 220 million, accounting for 15.76% of the national population, and its gross domestic product (GDP) reached 13.23 trillion yuan, accounting for 13.3% of the national GDP. In 2019, the proportion of primary, secondary, and tertiary industrial sectors in the Yellow River Basin was 6.9:42.80:50.3, respectively, while that of China was 7.1:39.0:53.9. The proportion of secondary industry in the Yellow River Basin was higher than that of the national average level. Although the proportion of tertiary industry was the highest, it was lower than that of the national average level. Although the Yellow River Basin plays an important role in the Chinese economic and social development patterns, environmental problems are prominent here. According to the data from the Atmospheric Composition Analysis Group of Dalhousie University in Canada, the average PM2.5 concentration in the prefecture-level cities of the Yellow River Basin in 2019 was slightly higher (38.121 μg/m3) than the national average PM2.5 concentration (31.572 μg/m3), resulting from the recent progress in industrialization and urbanization.
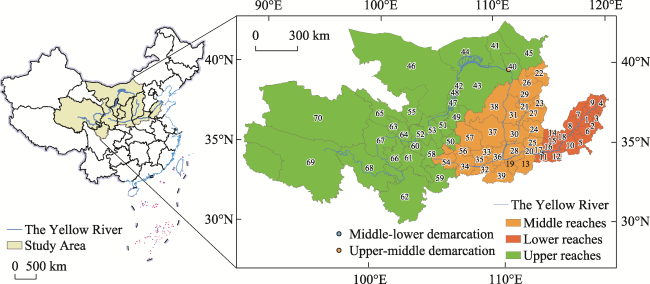
Figure 1 Location of the study area (Yellow River Basin)

(Upper reaches: 70 Haixi Mongolian and Tibetan Autonomous Prefecture, 69 Yushu Tibetan Autonomous Prefecture, 68 Guoluo Tibetan Autonomous Prefecture, 67 Hainan Tibetan Autonomous Prefecture, 66 Huangnan Tibetan Autonomous Prefecture, 65 Haibei Tibetan Autonomous Prefecture, 64 Haidong, 63 Xining, 62 Aba Tibetan and Qiang Autonomous Prefecture, 61 Gannan Tibetan Autonomous Prefecture, 60 Linxia Hui Autonomous Prefecture, 59 Longnan, 58 Dingxi, 55 Wuwei, 53 Baiyin, 52 Lanzhou, 51 Zhongwei, 50 Guyuan, 49 Wuzhong, 48 Shizuishan, 47 Yinchuan, 46 Alxa League, 45 Ulanqab, 44 Bayannur, 43 Ordos, 42 Wuhai, 41 Baotou, 40 Hohhot. Middle reaches: 57 Qingyang, 56 Pingliang, 54 Tianshui, 39 Shangluo, 38 Yulin, 37 Yan’an, 36 Weinan, 35 Xianyang, 34 Baoji, 33 Tongchuan, 32 Xi’an, 31 Lvliang, 30 Linfen, 29 Xinzhou, 28 Yuncheng, 27 Jinzhong, 26 Shuozhou, 25 Jincheng, 24 Changzhi, 23 Yangquan, 22 Datong, 21 Taiyuan, 20 Jiyuan, 19 Sanmenxia, 17 Jiaozuo, 13 Luoyang. Lower reaches: 18 Puyang, 16 Xinxiang, 15 Hebi, 14 Anyang, 12 Kaifeng, 11 Zhengzhou, 10 Heze, 9 Binzhou, 8 Liaocheng, 7 Dezhou, 6 Tai’an, 5 Jining, 4 Dongying, 3 Zibo, 2 Laiwu, 1 Jinan.)

Note: City 2 was merged into 1 in 2019. The map was drawn according to the standard base map No. GS(2022)1873, and the boundary of the base map was not modified.

4.2 Spatial pattern research methods

4.2.1 Kernel density estimation

Kernel density estimation can be used to reveal the distribution’s location, shape, and extensibility of variables. The location of the distribution reflects the development level of the variable. The distribution’s form reflects the different sizes and polarization degrees of the variable. The distribution’s ductility reflects the difference between cities with high development levels of the variable and other cities (Shlaes, 2022; Huang et al., 2023). Kernel density can be calculated as follows:
$f\left( x \right)=\frac{1}{nh}\underset{i=1}{\overset{n}{\mathop \sum }}\,K\left( \frac{{{x}_{i}}-\bar{x}}{h} \right)$
where xi represents the observed value of the x variable in city i, $\bar{x}$ represents the average value, n represents the number of observations, h is the bandwidth, and $\text{K}\left( \frac{{{\text{x}}_{\text{i}}}-\text{\bar{x}}}{\text{h}} \right)$ represents the kernel function.

4.2.2 Spatial autocorrelation analysis

In this study, Moran’s I was used to test the spatial correlation of the PM2.5 concentration distribution. The calculation formula can be expressed as follows:
Moran’s I $=\frac{\mathop{\sum }_{i=1}^{n}\mathop{\sum }_{j=1}^{n}{{W}_{ij}}\left( {{Y}_{i}}-\bar{Y} \right)\left( {{Y}_{j}}-\bar{Y} \right)}{{{S}^{2}}\mathop{\sum }_{i=1}^{n}\mathop{\sum }_{j=1}^{n}{{W}_{ij}}}$
$\bar{Y}=\frac{1}{n}\underset{i=1}{\overset{n}{\mathop \sum }}\,{{Y}_{i}}$
${{S}^{2}}=\frac{1}{n}\underset{i=1}{\overset{n}{\mathop \sum }}\,{{\left( {{Y}_{i}}-\bar{Y} \right)}^{2}}$
${{W}_{ij}}=\left\{ \begin{matrix} 1/{{d}_{ij}}\left( i\ne j \right) \\ 0\left( i=j \right) \\\end{matrix} \right.$
where Yi and Yj represent the PM2.5 concentration in cities i and j, respectively, while n represents the number of cities. Wij refers to the space weight matrix, where dij represents the geographical distance between city i and city j. Moran’s I ranges from -1 to 1. If the Moran’s I is greater than 0, it indicates that the spatial distribution of PM2.5 has a positive correlation. If the Moran’s I is less than 0, it suggests that the spatial distribution of PM2.5 is negatively correlated. If the Moran’s I is equal to 0, it reveals no spatial correlation (Szaruga et al., 2022).

4.3 Regression analysis

4.3.1 Spatial econometric model

A spatial econometric model of PM2.5 among cities was constructed based on the spatial dependence of PM2.5 among cities in the Yellow River Basin. Spatial econometric models commonly used in related studies include the spatial lag model (SLM), spatial error model (SEM), and SDM. Furthermore, SDM can be decomposed into direct and indirect effects to explain the regression coefficients (Ding et al., 2022). The basic form of SDM can be expressed as:
${{Y}_{it}}=\beta {{X}_{it}}+\rho \underset{j=1}{\overset{n}{\mathop \sum }}\,{{W}_{ij}}{{X}_{jt}}+\delta \underset{j=1}{\overset{n}{\mathop \sum }}\,{{W}_{ij}}{{Y}_{jt}}+{{u}_{i}}+{{\lambda }_{i}}+{{\varepsilon }_{i}}$
where Xit and Yjt represent the observed values of the explanatory and explained variables of cities i and j in period t, respectively; β represents the coefficient of the explanatory variable; Wij has the same meaning as equation (5); ρ represents the spatial regression coefficient; δ represents the spatial lag coefficient; ui and λi refer to the spatial and temporal effects, respectively. εi represents the disturbance term. When ρ=0 & δ≠0, Equation (6) corresponds to the SLM model. When ρ=-βδ, Equation (6) is the SEM model.

4.3.2 Mediating effect model

A mediating model was constructed to test whether there is a mediating effect between producer services agglomeration and PM2.5 (Zhu et al., 2022; Zheng et al., 2023). The test process is as follows. First, the total effect of the core explanatory variable AGG (X) on the explained variable lnPM2.5 (Y) in Equation (7) is calculated. If the coefficient c is significant, the test is continued; otherwise, the test is terminated. The second step is to test the regression coefficients a and b in Equations (8) and (9). If both coefficients are significant, the mediation effect test passes. If one coefficient is insignificant, the Sobel test is carried out. In the third step, the coefficient c’ of Equation (9) is tested. If c’ is significant, the mediating effect can be calculated. The fourth step is to perform the Sobel test. If it passes, there is a mediating effect and vice versa.
$Y=cX+{{e}_{1}}$
$M=\alpha X+{{e}_{2}}$
$Y={c}'X+bM+{{e}_{3}}$

4.4 Variables and data sources

4.4.1 Response variable

The response variable is PM2.5. The data in this paper were derived from the newly released remote sensing inversion data of surface PM2.5 suitable for China by the Atmospheric Composition Analysis Group of Dalhousie University, Canada (http://fizz.phys.dal.ca/) (Roy, 2021; Feng et al., 2022; Fu et al., 2022). The PM2.5 of each city from 2006 to 2019 was analyzed using the ArcGIS software.

4.4.2 Mediating variables

(1) Green technology innovation (Gpat). Green innovation refers to the trends in green and sustainable products and processes, the goals of which are to reduce pollution and emissions with the least input of manpower, capital and energy so as to increase economic and environmental benefits (Du and Zhang, 2023). The data came from patent application information published by the State Intellectual Property Office of China. Green innovation was measured by summing up the number of green patent applications in the Green Patent List and International Classification Code provided by the World Intellectual Property Organization (WIPO) at the city level. (2) Industrial structure (Indu). Considering that the proportion of secondary industry in the Yellow River Basin is higher than that of the national average level, the development of secondary industry in the region plays an important role in social and economic development and is the main sector for emissions of pollutants such as PM2.5 (Cheng et al., 2023). Therefore, the output value of the secondary and tertiary industries was used to measure the industrial structure.

4.4.3 Explanatory variables

The explanatory variable is the producer services agglomeration (AGG), which is calculated using Equation (10). On the basis of measuring AGG, and based on the theoretical analysis above, the specialized agglomeration (Marit) and diversified agglomeration (Jacobsit) were further calculated according to Equations (11) and (12). The Marit emphasizes the externality produced by the agglomeration of specialized enterprises in the same or related industry sectors, while the Jacobsit stresses the externality produced by the agglomeration of different types of industry sectors. The specific calculation formula is as follows:
$AG{{G}_{it}}=\frac{{{m}_{it}}/\mathop{\sum }_{j}{{m}_{it}}}{\mathop{\sum }_{i}{{m}_{it}}/\mathop{\sum }_{i}\mathop{\sum }_{j}{{m}_{it}}}$
$Ma{{r}_{it}}=ma{{x}_{j}}\left( {{m}_{ijt}}/{{m}_{it}} \right)$
$Jacob{{s}_{it}}=1/\sum\nolimits_{j}{\left| {{m}_{ijt}}-{{m}_{jt}} \right|}$
where i is the city, t is the year; mit represents the employment in producer services of city i, while j represents the industry; mijt represents the proportion of producer service employees in industry j to the total number of producer service employees in city i at the year t. According to the National Bureau of Statistics of China (2019) with reference to Liu et al. (2022), the producer services industry consists of “information transmission, computer services and software”, “financial industry”, “scientific research, technical services and geological survey”, “leasing and business service”, “transportation, warehousing and postal services”, “wholesale and retail industry”. The employment data of producer services in Yellow River Basin prefecture-level cities were obtained from China Urban Statistical Yearbook (2007-2020). Other control variables are shown in Table 1. Apart from that, the average annual temperature, annual precipitation, average annual wind speed, average annual pressure, and other meteorological data were derived from the National Data Center for Meteorological Sciences (http://data.cma.cn/). The original data were the observation data of 657 meteorological stations in the Yellow River Basin, and the panel data of prefecture-level cities were generated by spatial interpolation and grid conversion. Relief data were obtained from the Center for Resources and Environmental Sciences and Data, Chinese Academy of Sciences (https://www.resdc.cn/). Socioeconomic data were derived from the Chinese City Statistic Yearbook (2007-2020), and a supplementary was made according to the provincial statistical yearbook. Furthermore, years with partially missing data were replaced by the average value of adjacent years.
Table 1 Descriptive statistics of variables
Variable Variable meaning Mean S.D. Min Max
lnPM2.5 Average annual PM2.5 concentration 3.735 0.478 2.358 4.643
AGG Agglomeration of producer services 0.833 0.289 0.372 2.423
lnGpat Number of green patent applications 4.109 1.841 0 9.010
lnIndu Secondary industry added value/tertiary industry added value 4.348 0.532 2.698 6.262
lnTemp Average annual temperature 2.346 0.314 0.165 2.762
lnRain Average annual precipitation 6.144 0.452 4.307 7.020
lnTerr Relief of city -0.464 1.547 -6.907 1.298
lnWind Average annual wind speed 0.801 0.124 0.326 1.131
lnPress Annual pressure 6.816 0.073 6.413 6.921
lnPgdp Per capital GDP 10.313 0.787 7.638 12.456
lnEnerg Total electricity consumption 14.119 0.933 10.012 16.355
lnEnv Comprehensive utilization rate of industrial solid waste measures the level of environmental regulation 4.196 0.571 0.615 4.757
lnDens Population density 5.485 0.965 2.788 7.717

5 Empirical analyses

5.1 Spatio-temporal features of producer services agglomeration and PM2.5

5.1.1 Temporal variation of producer services agglomeration and PM2.5

The box plot in Figure 2a shows that the value of PM2.5 first increased and then decreased. Differences in PM2.5 concentrations among cities in the basin declined continuously, indicating a convergence trend. In general, the agglomeration level of producer services decreased slowly with no significant trend. To further reveal the temporal dynamic evolution characteristics of PM2.5 and producer services agglomeration, 2006, 2012 and 2019 were selected for kernel density estimation analysis (Figure 2b). From 2006 to 2019, the position of the PM2.5 kernel density curve presented a left shift, reflecting that PM2.5 experienced a decline. However, the kernel density curve of producer services agglomeration did not show a left shift or trend, indicating that producer services agglomeration in the Yellow River Basin did not experience a distinct upward or downward process. The kernel density curve of PM2.5 had right-trailing characteristics, indicating that the PM2.5 in most cities in the basin was low, while a few cities had high values. The agglomeration density curve of producer services was normally distributed without the trend of polarization. The highest value of the kernel density curve of PM2.5 and producer services agglomeration presented an upward trend, indicating that the agglomeration difference between PM2.5 and producer services in cities gradually increased.
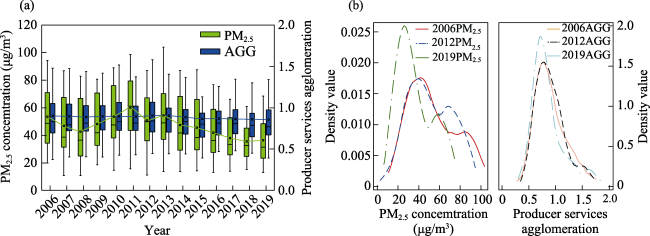
Figure 2 Box plot and kernel density estimation of PM2.5 and producer services agglomeration

5.1.2 Spatial variation of producer services agglomeration and PM2.5

When drawing the spatial pattern map, this study took into account the comparability of data between different years for adopting a unified classification standard. The PM2.5 concentration was classified based on the standards in the Technical Regulations on Ambient Air Quality Index (AQI) (Trial). Drawing upon related studies (Zhou et al., 2019; Zhou et al., 2022), the average annual PM2.5 concentration of prefecture-level cities in the Yellow River Basin was divided into four categories: 0-20 μg/m3, 20-35 μg/m3, 35-50 μg/m3, and > 50 μg/m3, and plotted in ArcGIS. The data of producer services agglomeration in 2006 and 2019 were both classified with the natural break point method in 2006 (Figure 3). In 2006, the high-value area of PM2.5 in the Yellow River Basin showed a “dual-core” distribution. The border area between the lower Yellow River and Ningxia, Gansu, and Inner Mongolia represented the high-value PM2.5 region. This phenomenon can be attributed to the fact that these two regions are located on the east side of the mountains, which leads to less diffusion of air pollution. Additionally, as a result of a strong industrial presence, air pollution caused by the long-term development and utilization of resources has become a typical environmental problem in this region. However, with the implementation and promotion of air pollution prevention and control regulations and other relevant policies in recent years, PM2.5 pollution in the Yellow River Basin has shown an overall downward trend. For example, in cities such as Lanzhou, Yinchuan, and Baiyin, apart from responding to the national air pollution prevention and control regulations and policies, local governments have actively built comprehensive ecological safety barrier pilot zones and formulated local ecological environmental protection plans. Special funds have been set up to further control air pollution, and the average annual PM2.5 in the region dropped significantly. By 2019, the average annual concentration of PM2.5 was lower than 35 μg/m3 in all prefecture-level cities except for the lower reaches of the Yellow River. The agglomeration development level of producer services is higher in the provincial capital cities than in the surrounding cities, possibly because producer service enterprises choose to be geographically concentrated, and the agglomeration distribution of industries helps promote agglomeration and competition effects. Besides, the functions of provincial capitals are relatively optimal, the types of industries are sound, and various production factors and infrastructure are relatively complete. Therefore, producer services such as financial services, modern logistics, business leasing, and scientific and technological consulting are urgently needed here to provide products and services in order to conform to the direction of industrial development.
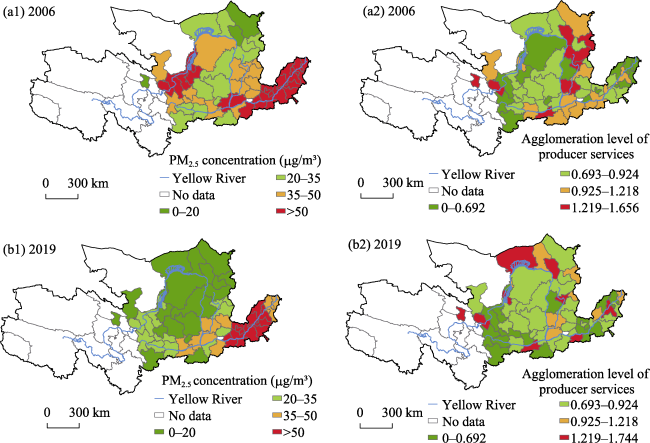
Figure 3 Spatial and temporal patterns of PM2.5 and producer services agglomeration in the Yellow River Basin

5.2 Influence of producer services agglomeration on PM2.5

5.2.1 Spatial autocorrelation analysis

Moran’s I was first used to test whether there was a spatial correlation in the spatial distribution of PM2.5 concentration. According to the results in Table 2, the Moran’s I of PM2.5 was between 0.753 and 0.851, indicating a significant positive spatial correlation in that PM2.5 concentration, which is consistent with the conditions of the spatial econometric model.
Table 2 Moran’s I of PM2.5 from 2006 to 2019
Year Moran’s I Z Years Moran’s I Z
2006 0.753*** 10.634 2013 0.824*** 11.722
2007 0.802*** 11.032 2014 0.842*** 11.463
2008 0.832*** 11.188 2015 0.851*** 11.728
2009 0.820*** 10.910 2016 0.807*** 11.214
2010 0.797*** 10.602 2017 0.801*** 10.910
2011 0.788*** 11.784 2018 0.780*** 10.936
2012 0.810*** 11.546 2019 0.810*** 11.397

Note: *** p < 0.01.

5.2.2 Model selection test

Based on LM, LR, and Wald tests, the form of the spatial econometric model was selected to ensure the scientific model selection (Table 3). LM (lag) and LM (error) indicate that a spatial econometric model needs to be introduced to explore the relationship between AGG with PM2.5. Next, LR_spatial_lag and LR_spatial_error also led to the rejection of the null hypothesis, indicating that the SDM cannot be transformed into the SLM or the SEM.
Table 3 Spatial econometric model selection tests
Test Statistic p-value
LM (lag) test 98.850*** 0.001
Robust LM (lag) test 88.889*** 0.000
LM (error) test 37.949*** 0.001
Robust LM (error) test 27.989*** 0.000
Wald (SLM) 31.14*** 0.000
Wald (SEM) 34.60*** 0.001
LR_spatial_lag 22.92*** 0.011
LR_spatial_error 46.82*** 0.001

Note: *** p < 0.01.

5.2.3 Baseline regression result

The regression results of AGG on PM2.5 pollution are shown in Table 4. Only the variable AGG was added to models 1, 3, and 5, while all the control variables were added to models 2, 4 and 6. In Model 7, PM2.5 variables with a lag of one period were added to the regression model. Beyond that, Model 8 incorporates the squared terms of the core explanatory variables. According to Table 4, (1) the regression coefficient of the PM2.5 variable with one lag period is significantly positive, demonstrating that the growth of PM2.5 has growth inertia, and PM2.5 in the last year will significantly affect the next year. (2) In the model without control variables, the coefficient of variable AGG in models 1, 3, and 5 is significantly negative, indicating that the development of AGG has a negative impact on regional PM2.5. (3) After adding the control variables, the AGG regression coefficients of Model 2, Model 4, and Model 6 at 5% and 1% levels were negative, which were -0.0650, -0.0586, and -0.0766, respectively. The regression results were relatively consistent under different models, indicating the robustness of the empirical analysis and that developing producer services is an important way to mitigate PM2.5 pollution. (4) According to the results of Model 8, the quadratic term of AGG was not significant when it was included in the model, meaning that there may be no nonlinear relationship between producer services and PM2.5. To further explore whether there is a nonlinear correlation among producer services with PM2.5, a U-test was used to verify the relationship by referring to relevant studies (Lind and Mehlum, 2010). As U-test P=0.353, the null hypothesis was not rejected at the 5% statistical level. Moreover, the extreme value point of AGG was 1.986, which is less than the maximum value of 2.423 in Table 1. Therefore, the relationship between AGG and PM2.5 may not have developed into a nonlinear one.
Table 4 Benchmark regression results
Variable SLM SEM SDM
(1) (2) (3) (4) (5) (6) (7) (8)
L.lnPM2.5 0.2956***
(8.89)
AGG -0.0574** -0.0630** -0.0539** -0.0549** -0.0558** -0.0691** -0.0350** -0.0305
(-2.12) (-2.35) (-1.98) (-2.06) (-2.06) (-2.55) (-2.35) (-0.35)
AGG2 -0.0213
(-0.56)
lnTemp 0.0784** 0.1143*** 0.1251*** 0.0961*** 0.1286***
(2.25) (2.58) (2.62) (3.22) (2.71)
lnRain -0.0005 0.0174 0.0237 0.0172 0.0267
(-0.04) (0.99) (1.25) (1.04) (1.42)
lnTerr -0.0234 -0.0201 -0.0744*** -0.0117 -0.0766***
(-0.38) (-0.35) (-2.76) (-0.20) (-2.81)
lnWind 0.0155 0.1060 0.0747 0.0803 0.0858
(0.28) (1.49) (0.98) (1.18) (1.12)
lnPress -0.1023 -0.2987 -0.2789 -0.1121 -0.3085
(-0.49) (-1.28) (-1.13) (-0.52) (-1.25)
lnPgdp -0.0108 -0.0102 -0.0174 -0.0049 -0.0162
(-1.47) (-0.72) (-1.22) (-0.38) (-1.14)
lnEnerg -0.0047 0.0118 0.0144 0.0277 0.0150
(-0.30) (0.67) (0.90) (1.58) (0.93)
lnEnv 0.0233** 0.0216* 0.0289** 0.0182 0.0301**
(1.97) (1.82) (2.38) (1.57) (2.47)
lnDens -0.0035 0.0005 0.0444** -0.0115 0.0430**
(-0.22) (0.03) (2.51) (-0.67) (2.40)
W*AGG -0.1012 -0.4624** -0.1346 0.9349**
(-0.70) (-2.53) (-0.74) (2.18)
Cons 0.2083*** 3.7791*** 0.2862** -0.9622 1.2110
(3.23) (43.53) (2.23) (-0.10) (0.12)
rho 0.9483*** 0.9451*** 0.9509*** 0.9218*** 0.9206*** 0.9156***
(82.49) (76.25) (81.62) (50.59) (46.67) (47.36)
lambda 0.9454*** 0.9466***
(79.50) (82.42)
Obs 798 798 798 798 798 798 798 798
R-squared 0.379 0.270 0.031 0.510 0.019 0.673 0.281 0.678
N 57 57 57 57 57 57 57 57

Note: Z value in parentheses; * p < 0.10, ** p < 0.05, *** p < 0.01.

Furthermore, the effects of the explanatory variables were decomposed to obtain the direct and indirect effects of AGG on PM2.5 (Table 5). As shown by the results, AGG directly and indirectly affects PM2.5, which is significantly negative at 5% and 1% confidence levels. Therefore, AGG can effectively suppress PM2.5 emissions in local and nearby cities.
Table 5 Effect decomposition of SDM
Variable Direct Indirect Total
AGG -0.1694*** -6.0805** -6.2500**
(-2.65) (-2.06) (-2.08)
lnTemp 0.1404*** 3.1113 3.2518
(2.90) (1.48) (1.54)
lnRain -0.0104 -2.3977** -2.4082**
(-0.44) (-2.07) (-2.05)
lnTerr -0.0720 -1.8483 -1.9203
(-0.45) (-0.29) (-0.30)
lnWind 0.0193 -3.4313 -3.4120
(0.19) (-0.86) (-0.84)
lnPress 0.2714 17.3018 17.5732
(0.58) (0.75) (0.75)
lnPgdp -0.0098 -0.0296 -0.0394
(-0.41) (-0.30) (-0.04)
lnEnerg 0.0687* 2.3632 2.4319
(1.75) (1.30) (1.31)
lnEnv 0.0870** 3.0372* 3.1242*
(2.37) (1.70) (1.72)
lnDens -0.1236** -5.3538* -5.4774*
(-1.96) (-1.86) (-1.86)

Note: Z value in parentheses; * p < 0.10, ** p < 0.05, *** p < 0.01.

5.3 Robustness test

The robustness of the empirical analysis was tested through the following two methods. First, the geographical distance matrix was replaced with the economic distance matrix. Second, the one-period lagged variable (L.AGG) of AGG in the regression model was included as the core explanatory variable (Table 6). Table 6 shows that the coefficient sign and significance of AGG have not changed, confirming the robustness of the results.
Table 6 Robustness tests
Variable Spatial weight matrix replacement Use of one-period lagged AGG
Direct Indirect Total Direct Indirect Total
AGG -0.0856** -1.0412** -1.1268**
(-2.45) (-2.06) (-2.12)
L.AGG -0.1979*** -7.1020** -7.3000**
(-2.81) (-2.09) (-2.10)
Control variable Yes Yes Yes Yes Yes Yes

Note: Z value in parentheses; ** p < 0.05, *** p < 0.01.

5.4 Analysis of the agglomeration externalities

On the basis of the baseline regression, the specialized agglomeration (Marit) and diversified agglomeration (Jacobsit) were calculated according to Equations (11) and (12) and included into the regression model to analyze the impact of producer services agglomeration on PM2.5 from the perspective of agglomeration externality (Table 7). It can be observed from Table 7 that the influence coefficients of producer services specialization on PM2.5 were significantly negative, with coefficients of -0.0428, -1.6514, and -1.6942, respectively. This means that the MAR externality of AGG helps restrain the growth of PM2.5 concentration in this area and the surrounding area. Additionally, the direct and indirect effects of producer services diversification on PM2.5 concentration were significantly positive, with coefficients of 0.0049 and 0.1885, respectively. This indicates that the diversified development of AGG increases PM2.5 pollution in local and surrounding areas.
Table 7 Effect decomposition of agglomeration externalities
Variable Specialized agglomeration Diversified agglomeration
Direct Indirect Total Direct Indirect Total
AGG -0.0396*** -1.4028** -1.4424** 0.0042*** 0.1402*** 0.1444***
(-2.60) (-2.02) (-2.04) (3.39) (2.76) (2.79)
lnTemp 0.1421*** 0.9600 1.1021 0.1327*** 1.0295 1.1622
(3.06) (0.83) (0.94) (2.89) (1.01) (1.13)
lnRain 0.0013 -1.3645* -1.3631* 0.0052 -1.2448* -1.2396*
(0.06) (-1.72) (-1.69) (0.26) (-1.72) (-1.69)
lnTerr -0.1022*** -1.2058 -1.3081 -0.1102*** -1.6814 -1.7917
(-3.39) (-0.92) (-0.99) (-3.55) (-1.29) (-1.36)
lnWind 0.0785 -0.5667 -0.4882 0.1386* 1.0298 1.1684
(0.97) (-0.32) (-0.27) (1.75) (0.61) (0.69)
lnPress -0.2368 2.7128 2.4760 -0.4453 -9.0747 -9.5199
(-0.60) (0.15) (0.14) (-1.20) (-0.56) (-0.58)
lnPgdp -0.0167 0.0444 0.0277 -0.0128 0.0987 0.0859
(-1.09) (0.25) (0.15) (-0.83) (0.61) (0.52)
lnEnerg -0.0179 -1.6060** -1.6240** 0.0008 -0.6613 -0.6605
(-0.84) (-2.20) (-2.19) (0.03) (-0.95) (-0.93)
lnEnv 0.0519** 1.2762 1.3282 0.0431** 0.9199 0.9630
(2.55) (1.44) (1.47) (2.28) (1.18) (1.21)
lnDens 0.0880* 2.4639 2.5520 0.0782* 2.1112 2.1894
(1.95) (1.28) (1.30) (1.69) (1.10) (1.12)

Note: Z value in parentheses; * p < 0.10, ** p < 0.05, *** p < 0.01.

The results show that specialized AGG significantly decreases the local PM2.5 and contributes to their reduction in neighboring cities, consistent with the conclusion of Zhang et al. (2022). The cause might be that specialized AGG improves technological efficiency, leading to a reduction in local PM2.5 emissions through learning, demonstration effects, competition and cooperation. Additionally, the specialized agglomeration of industrial parks promotes a finer division of labor in the production chain and efficient cooperation between enterprises. This, in turn, improves the technical efficiency of surrounding areas and decreases the concentration of PM2.5. Diversified agglomeration helps to improve the concentration of PM2.5 in the local and the surrounding cities. This finding contrasts with the conclusion of Cai and Hu (2022), who suggested that industrial diversification agglomeration may reduce industrial SO2. The cause for this disparity could be an unbalanced development of various industries, making it difficult to achieve a reasonable flow of diversified factors. Blind development is not conducing to the advantages of industrial agglomeration. Diversified agglomeration patterns have higher requirements for infrastructure services, often leading to their proliferation in large cities. However, the draining effect of large cities on neighboring areas may outweigh the positive spatial spillover effect. Therefore, the Jacobs externality limits the effective division of labor between industries in the neighboring region, leading to an increase in PM2.5 concentration.

5.5 Industry heterogeneity analysis

To account for the heterogeneity in spatial spillover effects of the AGG, it was divided into high-end and low-end producer services (Table 8). High-end producer services include “information transmission, software and information technology services”, “financial industry” and “scientific research and technology services”, while low-end producer services comprise “wholesale and retail trade”, “transportation, storage and postal services” and “leasing and business services”.
Table 8 Industry heterogeneity analysis
Variable High-end producer services Low-end producer services cluster
Direct Indirect Total Direct Indirect Total
AGG -0.0251 -0.5223 -0.5475 -0.1643*** -5.8379** -6.0022**
(-0.43) (-0.25) (-0.26) (-2.62) (-2.07) (-2.08)
lnTemp 0.1520*** 1.4349 1.5869 0.1658*** 2.7695* 2.9352*
(3.18) (1.04) (1.14) (3.42) (1.83) (1.92)
lnRain 0.0046 -1.2237 -1.2190 -0.0032 -1.7434* -1.7467*
(0.21) (-1.43) (-1.41) (-0.14) (-1.79) (-1.77)
lnTerr -0.1041*** -1.4215 -1.5256 -0.1102*** -1.9024 -2.0126
(-3.30) (-1.01) (-1.07) (-3.26) (-1.19) (-1.24)
lnWind 0.1159 0.1566 0.2725 0.1090 0.1435 0.2526
(1.41) (0.08) (0.14) (1.34) (0.07) (0.12)
lnPress -0.3553 -3.3393 -3.6946 -0.4207 -8.4506 -8.8712
(-0.87) (-0.18) (-0.19) (-0.99) (-0.42) (-0.44)
lnPgdp -0.0179 -0.0329 -0.0508 -0.0160 -0.0283 -0.0443
(-1.16) (-0.17) (-0.27) (-1.04) (-0.14) (-0.22)
lnEnerg -0.0146 -1.5368** -1.5514** -0.0156 -1.5493* -1.5650*
(-0.66) (-2.00) (-1.98) (-0.70) (-1.91) (-1.89)
lnEnv 0.0538** 1.4997 1.5536 0.0544** 1.5155 1.5700
(2.54) (1.61) (1.63) (2.47) (1.52) (1.55)
lnDens 0.0908* 2.6439 2.7348 0.1023* 3.1780 3.2803
(1.85) (1.23) (1.25) (1.92) (1.34) (1.35)

Note: Z value in parentheses; * p < 0.10, ** p < 0.05, *** p < 0.01.

High-end AGG exerts a non-significant effect on PM2.5 concentration, whereas low-end AGG has significantly negative direct and indirect effects. Unlike previous studies such as that of Liu et al. (2022), which hold the view that the influence of low-end producer services is relatively narrow, the empirical results of this paper indicate that the agglomeration of low-end producer services can effectively integrate limited resources and reduce PM2.5 pollution in neighboring areas. This is possibly because the AGG in the Yellow River Basin has distinct low-end characteristics, and the integration level of high-end and intelligent producer services with local industrialization is low. The development of knowledge-intensive services is unbalanced and inadequate. Beyond that, low-end producer services have lower production costs and less capital demand. They are bound to the development of traditional manufacturing industries, which are more conducive to promoting technological progress and thereby reducing the concentration of PM2.5.

5.6 Regional heterogeneity analysis

In view of the different development levels in the upper, middle, and lower reaches of the Yellow River Basin, AGG may have regionally heterogeneous effects on PM2.5. Moreover, given that the value of PM2.5 in the lower reaches of the Yellow River region is significantly higher than that in the middle and upper reaches, this study further investigated the effects of AGG on PM2.5 pollution from the perspective of regional heterogeneity (Table 9). The results show that, within the middle and upper reaches of the region, specialized AGG measures can significantly reduce PM2.5 pollution locally and in neighboring cities, whereas a diversified agglomeration increases PM2.5 pollution. This result is similar to the study of Li et al. (2022), who identified similar heterogeneity in the middle and lower reaches of the Yangtze River Economic Belt. A possible reason for this is that the mining and processing industries of the Yellow River shelter-forest region occupy a larger area while there is a dearth of high value-added high-end industries. Moreover, the development of science and technology, information, finance, and other modern services industries is limited, hindering the establishment of cooperation mechanisms with traditional industries. Hence, diversification in the middle-tier service sector cannot be effectively transformed into productivity.
Table 9 Regional heterogeneity analysis
Variable Middle and upper reaches Lower reaches
Direct Indirect Total Direct Indirect Total
Specialized AGG -0.0709*** -2.0780** -2.1489** -0.0236*** -0.2477* -0.2713*
(-2.78) (-2.30) (-2.32) (-2.11) (-1.94) (-1.96)
Control variable yes yes yes yes yes yes
Diversified AGG 0.0048*** 0.1177*** 0.1226*** -0.0002 0.0020 0.0018
(3.34) (2.90) (2.94) (-0.12) (0.10) (0.08)
Control variable yes yes yes yes yes yes
High-end AGG -0.0393 -1.1590 -1.1983 0.0595** 0.6552*** 0.7147***
(-0.48) (-0.55) (-0.55) (2.11) (4.02) (4.06)
Control variable yes yes yes yes yes yes
Low-end AGG -0.1738** -4.7891** -4.9630** 0.0642 1.1306** 1.1949**
(-2.43) (-2.20) (-2.22) (1.42) (2.13) (2.09)
Control variable yes yes yes yes yes yes

Note: Z value in parentheses; * p < 0.10, ** p < 0.05, *** p < 0.01.

Conversely, low-end AGG services can better adapt to the local industrial environment, effectively reducing raw material and transaction costs of upstream and downstream enterprises, consequently leading to lower emissions of pollutants. In the downstream region, specialized AGG plays a prominent role in reducing PM2.5, whereas the benefits of diversified agglomeration are less apparent. The possible reason for this discrepancy lies in the fact that the downstream region is densely populated and industrial, which places a high load on its resources and environment. At the same time, this region is under great pressure from economic transformation and upgrading. Specialized AGG can promote the spillover of clean technologies through the dissemination of explicit and implicit knowledge, promote the spread of new processes and technologies, drive optimization and advance industrial structure, and then reduce PM2.5 pollution. However, a diversified productive industrial agglomeration puts further pressure on resources, the environment, and public infrastructure and increases pollutant emissions, consequently reducing PM2.5.

5.7 Mediating effect analysis

Based on the theoretical analysis above and the mediation effect model, this research further explored the mechanism through which producer services agglomeration inhibits PM2.5 pollution from green technology innovation and industrial structure optimization (Table 10). Models (1) and (4) show the total effect of AGG on PM2.5, verifying that the coefficient $c$ is negative and significant. As a consequence, the total effect of AGG on PM2.5 is significantly negative. Apart from that, the significance of coefficients A and B was investigated in models (2), (3), (5), and (6). According to the results of models (2) and (5), the impact of AGG on Gpat and Indu is a significant positive effect. According to the results of models (3) and (6), the impact of Gpat and Indu on PM2.5 has a significant negative effect. This result is consistent with Du and Zhang (2023), who found that producer services agglomeration improves the level of green development through mediating mechanisms. This reflects that the producer service industry is an important factor in the improvement of the technological innovation level of the manufacturing industry and optimization of the urban industrial structure. Its agglomeration and development indirectly reduce PM2.5 pollution in two ways, that is by promoting green technology innovation and development and adjusting industrial structure. The significance of coefficients A and B indicates that Gpat and Indu are the mediating variables between AGG and PM2.5. In addition, all the models passed the Sobel test, further confirming the existence of the mediating effect. The technological innovation effect accounts for 14.161% of the total effect, while the industrial structure effect constitutes 39.922% of the total effect. Compared with the intermediate variable, Gpat, and Indu accounted for a larger proportion of the total effect. This implies that producer services indirectly reduce PM2.5 pollution mainly by adjusting the industrial structure. This result may be due to the fact that the Yellow River Basin is a relatively concentrated area of industrial pollution in China, and the development of producer services can reduce the proportion of heavy chemical industries, thus improving regional air quality. When compared to the southeast coastal areas of China, the transformation mechanism of green patent achievements in the Yellow River basin needs further improvements. As a result, the mediating effect of the Gpat variable accounts for a low proportion of the total effect.
Table 10 Mediating effect analysis
(1) (2) (3) (4) (5) (6)
Explained variable lnPM2.5 lnGpat lnPM2.5 lnPM2.5 lnIndu lnPM2.5
AGG -0.1267*** 0.6744*** -0.0266*** -0.1267*** 0.5160*** -0.0761**
(-3.63) (4.47) (-3.24) (-3.63) (8.42) (-2.12)
lnGpat -0.1088***
(-3.09)
lnIndu -0.0980***
(-4.90)
Control variable yes yes yes yes yes yes
Sobel test Z=-2.625, P-value=0.008 Z=-4.233, P-value=0.000
Proportion of total effect that is mediated 14.161% 39.922%

Note: Z value in parentheses; ** p < 0.05, *** p < 0.01.

6 Discussion

From the perspective of an econometric model, this paper analyzed the impact of AGG on PM2.5 and explored a path for PM2.5 pollution reduction. According to the baseline regression, by adding the variable of PM2.5 lagged by one period into the model, we found that PM2.5 has a significant “growth inertia”. Namely, when the PM2.5 pollution concentration of a period is high, it continues to rise in the next period, presenting a “snowball” growth process. The results of the empirical analysis are similar to the conclusions of relevant empirical studies (Wang et al., 2022b). Adding the squared term of AGG in the model and conducting U tests verified the lack of a nonlinear effect between PM2.5 pollution with AGG. There are some differences between this empirical result and the research of Liu et al. (2022) and Fang et al. (2022), who also found an inverted U-shaped relationship between PM2.5 and the agglomeration of manufacturing. This may be related to the nature of the industry. In contrast with the agglomeration of the manufacturing industry, AGG not only contributes to strengthening the division of labor and cooperation between industries within the city but also provides more ways for technological and information exchange between enterprises. At the same time, the resulting industrial correlation effect improves production and energy utilization efficiencies. In addition, the complementary services provided by the cluster of producer services can also foster the innovation momentum of regional manufacturing industries and further decrease regional PM2.5 emissions.
Some scholars consider the effects of AGG heterogeneity (Yang et al. 2020; Liu et al. 2022). This paper further analyzed the different agglomeration externalities, industry heterogeneity, and regional heterogeneity of AGG affecting PM2.5. As shown by empirical results, AGG has heterogeneous effects on PM2.5 pollution. As pointed out by Yan et al. (2022), we also found that AGG has a mediating effect. Notably, AGG has a direct effect on PM2.5 but has an indirect impact on the mediating role of Gpat and Indu. On the one hand, AGG can provide diversified intermediate inputs for the development of the urban manufacturing industry, improve labor productivity through knowledge and technology spillovers, promote green and innovative technologies, and promote the extension of manufacturing to higher value chain links. Moreover, AGG replaces the consumption and production of high-energy resources through energy conservation and environmental protection production technologies and services, promotes the modernization of industrial manufacturing via scientific and technological innovation and application, reorganizes outdated production facilities, and pushes the process of regional air pollution reduction (Figure 4).
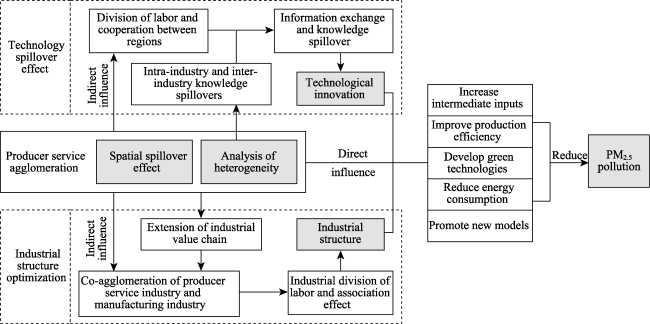
Figure 4 The influence path of AGG on PM2.5
Previous correlational studies have explored the relationship between AGG and carbon emission reduction (Zhao et al., 2021) as well as the impact of manufacturing agglomeration on PM2.5 (Fang et al., 2020). However, the effect of AGG on environmental pollution, especially air pollution (e.g., PM2.5), has not been thoroughly analyzed using spatial econometric models. According to Shen and Peng (2021), different levels and modes of industrial agglomeration may generate different environmental effects. This paper extended the research on the environmental impact of AGG on PM2.5 pollution and reached the same conclusions based on the study of Liu et al. (2022).
However, certain limitations of this paper still require addressing. For example, due to challenges in obtaining micro data on the segmented industries, this study only measured the AGG from the perspective of industrial employment in cities. In the future, data on producer services will be collected to explore their spatial pattern characteristics and economic and environmental effects.

7 Conclusions and policy implications

7.1 Conclusions

This paper analyzed the spatial spillover effects and mediating effects brought by AGG on PM2.5, and reached the following conclusions:
Firstly, from 2006 to 2019, PM2.5 in the Yellow River Basin first increased and then decreased and converged. The PM2.5 concentration in the lower reaches was significantly higher than that in the middle and upper reaches. There was no apparent trend in the AGG development level, and the kernel density curve presented normal distribution characteristics. Apart from that, cities with high AGG levels were mainly provincial capitals. In terms of the spatio-temporal patterns of PM2.5, the findings of this study are consistent with those of Zhou et al. (2019) and Zhou et al. (2022). On the one hand, regional PM2.5 concentration shows an overall downward trend, reflecting China’s recent progress in air pollution prevention and control and regional green transformation. On the other hand, PM2.5 concentration shows significant spatial agglomeration and heterogeneity. The lower Yellow River is a significant agglomeration area of PM2.5 pollution, where air pollution control remains to be addressed. The spatial pattern of AGG development in the Yellow River Basin is unbalanced and inadequate, with a polycentric distribution around the provincial capital city. Compared with the Yangtze River Economic Belt and other regions, the Yellow River basin still has a certain lag in industrial green transformation and service economy development (Zeng et al., 2023).
Secondly, AGG has a significant negative impact on PM2.5 in the Yellow River Basin and helps to reduce PM2.5 pollution in neighboring areas. Compared with manufacturing industries, for which there is a certain threshold effect in the negative impact on PM2.5 pollution (Lu et al., 2021), AGG does not reach a threshold value for its impact on PM2.5 pollution in the Yellow River Basin, and this will help further reduce PM2.5 pollution in the future.
Thirdly, the specialized agglomeration of producer services and the agglomeration of low-end producer services have a significant negative impact on PM2.5 pollution in the Yellow River Basin. The mediating effect analysis shows that producer services agglomeration can indirectly reduce PM2.5 pollution by improving the level of green technology innovation and optimizing the industrial structure. However, the impact of high-end AGG on PM2.5 is not significant in the Yellow River Basin. Compared with the Yangtze River Delta and other regions (Du and Zhang, 2023; Pei et al., 2021), technology-intensive industries such as high-end producer services in the Yellow River Basin have a limited ability to integrate production factors, and their integration with the local manufacturing industry needs to be further strengthened.

7.2 Policy implication

Based on the above research conclusions, the policy recommendations are put forward: First, it is essential to prioritize the specialization and high-quality development of producer services, while also deepening the effective integration of advanced manufacturing and modern services. Relevant government departments can further enhance the development of industrial parks, narrow the range of policy interventions and improve the market-based allocation of factors of production. Governments should also actively guide the division of labor and cooperation between producer services and manufacturing, and encourage enterprises to set up research and development centers, financial centers, and technical service centers. Emphasis should be placed on optimizing supporting services such as warehousing and logistics, and accelerate the integrated development of producer services and manufacturing. Furthermore, efforts should be directed to improve services for the transfer and application of scientific and technological achievements and promote the development of intelligent, high-end, and green industries.
Second, there should be a focus on promoting industrial transformation to upgrade and improve production efficiency. Meanwhile, working capital should be invested in advanced industry sectors, accelerating industrial adjustments and upgrades. For example, it is necessary to increase the proportion of direct financing, improve policy-based guarantee financing systems for the advanced manufacturing industry and producer service enterprises, and increase the number of loan services provided by banks to manufacturing and producer services enterprises by lowering the reserve requirement ratio and other monetary policies, as well as improve the supporting service function of the producer service industry by transforming and modernizing the manufacturing industry. In this way, it will further strengthen the accumulation of human capital, promote the application of green technology and pollution control technology in all areas of the manufacturing industry, enhance regional performance in green development, and effectively improve environmental quality.
Third, the agglomeration model of producer services should be compatible with local resource endowments, population scale, and strategic positioning. Currently, the Yellow River Basin has a weak resource-carrying capacity, a degraded environment, unbalanced development, and inadequate prioritization of ecological protection. Adapting to the local environment and economic development is essential in the development of producer services. Avoiding blind expansion of producer services is crucial and the establishment of manufacturing service clusters should be favored. Apart from promoting the development of producer services based on local characteristics, a division of labor between industries and products is needed to support the diversified and high-end development of producer services.
[1]
Agarwal S, Foo S T, Yang Y, 2020. The impact of transboundary haze pollution on household utilities consumption. Energy Economics, 85(1): 104591.

DOI

[2]
Aik J, Chua R, Jamali N et al., 2020. The burden of acute conjunctivitis attributable to ambient particulate matter pollution in Singapore and its exacerbation during South-East Asian haze episodes. Science of the Total Environment, 740(10): 140129.

DOI

[3]
Cai Y Y, Hu Z Q. 2022. Industrial agglomeration and industrial SO2 emissions in China’s 285 cities: Evidence from multiple agglomeration types. Journal of Cleaner Production, 353(6): 131675.

DOI

[4]
Chen D K, Chen S Y, Jin H, 2018. Industrial agglomeration and CO2 emissions: Evidence from 187 Chinese prefecture-level cities over 2005-2013. Journal of Cleaner Production, 172(1): 993-1003.

DOI

[5]
Cheng Y, Zhang Y, Wang J J et al., 2023. The impact of the urban digital economy on China’s carbon intensity: Spatial spillover and mediating effect. Resources, Conservation and Recycling, 189(2): 106762.

DOI

[6]
Ding J, Liu B L, Shao X F, 2022. Spatial effects of industrial synergistic agglomeration and regional green development efficiency: Evidence from China. Energy Economics, 112(8): 106156.

DOI

[7]
Diodato D, Neffke F, Neave O, 2018. Why do industries coagglomerate? How Marshallian externalities differ by industry and have evolved over time. Journal of Urban Economics, 106(7): 1-26.

DOI

[8]
Dllek C K, Carlsson B, 1999. Manufacturing in decline? A matter of definition. Economics of Innovation and New Technology, 8(3): 175-196.

DOI

[9]
Dong F, Wang Y, Zheng L et al., 2020. Can industrial agglomeration promote pollution agglomeration? Evidence from China. Journal of Cleaner Production, 246(2): 118960.

DOI

[10]
Du M F, Zhang Y J, 2023. The impact of producer services agglomeration on green economic development: Evidence from 278 Chinese cities. Energy Economics, 400(6): 106769.

[11]
Fang J Y, Tang X, Xie R et al., 2020. The effect of manufacturing agglomerations on smog pollution. Structural Change and Economic Dynamics, 54(9): 92-101.

DOI

[12]
Feng H H, Ding Y, Zou B et al., 2022. Vegetation-related dry deposition of global PM2.5 from satellite observations. Journal of Geographical Sciences, 32(4): 589-604.

DOI

[13]
Feng Y, 2022. The impact of agglomeration of producer services on pollution emission: Empirical analysis based on 260 cities in China. Frontiers in Business, Economics and Management, 4(1): 44-51.

[14]
Fernandes A M, Paunov C, 2012. Foreign direct investment in services and manufacturing productivity: Evidence for Chile. Journal of Development Economics, 97(2): 305-321.

DOI

[15]
Fiona F Y, Anthony G Y, Wang J J, 2018. Regional effects of producer services on manufacturing productivity in China. Applied Geography, 97(8): 263-274.

DOI

[16]
Fu X C, Yao L, Xu W T et al., 2022. Exploring the multitemporal surface urban heat island effect and its driving relation in the Beijing-Tianjin-Hebei urban agglomeration. Applied Geography, 144(6): 102714.

DOI

[17]
Gallagher R M, 2013. Shipping costs, information costs, and the sources of industrial co-agglomeration. Journal of Regional Science, 53(2): 304-331.

DOI

[18]
George E H, Michael L P, 2017. Does financial development affect environmental degradation? Evidence from the OECD countries. Business Strategy and the Environment, 26(8): 1162-1180.

DOI

[19]
Hannah G M, Kim N D, Andrew J N et al., 2021. The relationship between Brown haze, atmospheric boundary layer structure, and air pollution in an urban area of complex coastal terrain. Atmospheric Pollution Research, 12(5): 101057.

DOI

[20]
Hao Y, Niu X, Wang J, 2021. Impacts of haze pollution on China’s tourism industry: A system of economic loss analysis. Journal of Environmental Management, 295(10): 113051.

DOI

[21]
Hong Y N, Lyu X, Chen Y et al., 2020. Industrial agglomeration externalities, local governments’ competition and environmental pollution: Evidence from Chinese prefecture-level cities. Journal of Cleaner Production, 277(10): 123455.

DOI

[22]
Huang Y J, Sheng K R, Sun W, 2022. Influencing factors of manufacturing agglomeration in the Beijing-Tianjin-Hebei region based on enterprise big data. Journal of Geographical Sciences, 32(10): 2105-2128.

DOI

[23]
Joseph F, Julia W, 2008. Producer services, manufacturing linkages, and trade. Journal of Industry, Competition and Trade, 8(3/4): 199-229.

[24]
Lan F, Sun L, Pu W Y, 2021. Research on the influence of manufacturing agglomeration modes on regional carbon emission and spatial effect in China. Economic Modelling, 96(5): 346-352.

DOI

[25]
Latif M T, Othman M, Idris N et al., 2018. Impact of regional haze towards air quality in Malaysia: A review. Atmospheric Environment, 177(3): 28-44.

DOI

[26]
Li H, Liu B F, 2022. The effect of industrial agglomeration on China’s carbon intensity: Evidence from a dynamic panel model and a mediation effect model. Energy Reports, 8(10): 96-103.

[27]
Li W W, Zhang Y Y, Yang C F et al., 2022. Does producer services agglomeration improve urban green development performance of the Yangtze River Economic Belt in China? Ecological Indicators, 145(10): 109581.

DOI

[28]
Li X H, Xu Y Y, Yao X, 2021. Effects of industrial agglomeration on haze pollution: A Chinese city-level study. Energy Policy, 148(1): 111928.

DOI

[29]
Li Y M, Sun L Y, Zhang H L et al., 2018. Does industrial transfer within urban agglomerations promote dual control of total energy consumption and energy intensity? Journal of Cleaner Production, 204(12): 607-617.

DOI

[30]
Lind J T, Mehlum H, 2010. With or without U? The appropriate test for a U-shaped relationship. Oxford Bulletin of Economics and Statistics, 72(1): 109-118.

DOI

[31]
Liu J, Cheng Z H, Zhang H M, 2017. Does industrial agglomeration promote the increase of energy efficiency in China? Journal of Cleaner Production, 164(10): 30-37.

DOI

[32]
Liu X P, Zhang X L, Sun W, 2022. Does the agglomeration of urban producer services promote carbon efficiency of manufacturing industry? Land Use Policy, 120(9): 106264.

DOI

[33]
Lu H, Yue A L, Chen H et al., 2018. Could smog pollution lead to the migration of local skilled workers? Evidence from the Jing-Jin-Ji region in China. Resources, Conservation & Recycling, 130(3): 177-187.

[34]
Lu W, Tam V, Du L et al., 2021. Impact of industrial agglomeration on haze pollution: New evidence from Bohai Sea Economic Region in China. Journal of Cleaner Production, 280(2): 124414.

DOI

[35]
Luis L, Fernando S G, Maria V C, 2016. The (strong) interdependence between intermediate producer services’ attributes and manufacturing location. Economic Modelling, 57(1): 1-12.

DOI

[36]
Malmberg A, Maskell P, 1997. Towards an explanation of regional specialization and industry agglomeration. European Planning Studies, 5(1): 25-41.

DOI

[37]
Mishra U C, Sarsaiya S, Gupta A, 2022. A systematic review on the impact of cement industries on the natural environment. Environmental Science and Pollution Research, 29(1): 18440-18451.

DOI

[38]
Ngoc B A, Hervé D, Karine D et al., 2021. Key factors explaining severe air pollution episodes in Hanoi during 2019 winter season. Atmospheric Pollution Research, 12(6): 101068.

DOI

[39]
Nielsen B B, Asmussen C G, Weatherall C D et al., 2021. Marshall vs Jacobs agglomeration and the micro-location of foreign and domestic firms. Cities, 117(10): 103322.

DOI

[40]
Orsa K, Johan K, 2020. Agglomeration and innovation of knowledge intensive business services. Industry and Innovation, 27(5): 538-561.

DOI

[41]
Othman J, Sahani M, Mahmud M et al., 2014. Transboundary smoke haze pollution in Malaysia: Inpatient health impacts and economic valuation. Environmental Pollution, 189(6): 194-201.

DOI

[42]
Pei Y, Zhu Y M, Liu S X et al., 2021. Industrial agglomeration and environmental pollution: Based on the specialized and diversified agglomeration in the Yangtze River Delta. Environment, Development and Sustainability, 23(3): 4061-4085.

DOI

[43]
Peng H, Lu Y B, Wang Q W, 2023. How does heterogeneous industrial agglomeration affect the total factor energy efficiency of China’s digital economy. Energy, 268(4): 126654.

DOI

[44]
Roy A, 2021. Atmospheric pollution retrieval using path radiance derived from remote sensing data. Journal of Geovisualization and Spatial Analysis, 26 (5): 1-11.

[45]
Shen N, Peng H, 2021. Can industrial agglomeration achieve the emission-reduction effect? Socio-Economic Planning Sciences, 75(6): 100867.

DOI

[46]
Shi L N, Wang Y S, 2021. Evolution characteristics and driving factors of negative decoupled rural residential land and resident population in the Yellow River Basin. Land Use Policy, 109(10): 105685.

DOI

[47]
Shlaes J, 2022. Spatial pattern and influencing factors of comprehensive disaster reduction demonstration community in Beijing-Tianjin-Hebei region. Journal of Natural Disasters, 31(5): 24-30.

[48]
Silvia L, Erica S, Claudia V, 2022. Drivers of territorial servitization: An empirical analysis of manufacturing productivity in local value chains. International Journal of Production Economics, 253(11): 108607.

DOI

[49]
Sotiris K, 2010. Capital heterogeneity, industrial clusters and environmental consciousness. Journal of Economic Integration, 25(2): 353-375.

DOI

[50]
Su Y, Yu Y Q, 2020. Spatial agglomeration of new energy industries on the performance of regional pollution control through spatial econometric analysis. Science of The Total Environment, 704(2): 135261.

DOI

[51]
Sumit A, Wang L, Yang Y, 2021. Impact of transboundary air pollution on service quality and consumer satisfaction. Journal of Economic Behavior & Organization, 192(12): 357-380.

DOI

[52]
Szaruga E, Marzena F, Karolina D, 2022. Spatial autocorrelation of power grid instability in the context of electricity production from renewable energy sources in Polish regions. Energy Reports, 8(15): 276-284.

DOI

[53]
Xu H, Liu W J, Zhang D W, 2023. Exploring the role of co-agglomeration of manufacturing and producer services on carbon productivity: An empirical study of 282 cities in China. Journal of Cleaner Production, 399(5): 136674.

DOI

[54]
Tanaka K, Managi S, 2021. Industrial agglomeration effect for energy efficiency in Japanese production plants. Energy Policy, 156(9): 112442.

DOI

[55]
Tang J J, Zhou L, Dang X W et al., 2023. Impacts and predictions of urban expansion on habitat quality in the densely populated areas: A case study of the Yellow River Basin, China. Ecological Indicators, 151(7): 110320.

DOI

[56]
Ting G, Hua Y, Wei L G, 2021. How do urban haze pollution and economic development affect each other? Empirical evidence from 287 Chinese cities during 2000-2016. Sustainable Cities and Society, 65(2): 102642.

DOI

[57]
Wang J D, Dong X C, Kang Y D, 2022a. How does ICT agglomeration affect carbon emissions? The case of Yangtze River Delta urban agglomeration in China. Energy Economics, 111(7): 106107.

DOI

[58]
Wang P, Xu M X, 2023. Dynamics and interactions of water-related ecosystem services in the Yellow River Basin, China. Journal of Geographical Sciences, 33(8): 1681-1701.

DOI

[59]
Wang X, Zhang Q X, Chang W Y, 2022b. Does economic agglomeration affect haze pollution? Evidence from China’s Yellow River Basin. Journal of Cleaner Production, 335(2): 130271.

DOI

[60]
Wu K, You K R, Ren H et al., 2022. The impact of industrial agglomeration on ecological efficiency: An empirical analysis based on 244 Chinese cities. Environmental Impact Assessment Review, 96(9): 106841.

DOI

[61]
Yan J L, Yang X D, Nie C X et al., 2022. Does government intervention affect CO2 emission reduction effect of producer service agglomeration? Empirical analysis based on spatial Durbin model and dynamic threshold model. Environmental Science and Pollution Research International, 143(4): 1-18.

[62]
Yang G L, Zhang W, Zha D L, 2019. Industrial production: Pursuing scale expansion or pollution reduction? Judgment based on the Copeland-Taylor model. Journal of Cleaner Production, 216(4): 14-24.

DOI

[63]
Yang H C, Lu F Z, Zhang F M, 2020. Exploring the effect of producer services agglomeration on China’s energy efficiency under environmental constraints. Journal of Cleaner Production, 263(8): 121320.

DOI

[64]
Yang H C, Zhang F M, He Y X, 2021. Exploring the effect of producer services and manufacturing industrial co-agglomeration on the ecological environment pollution control in China. Environment, Development and Sustainability, 23(3): 16119-16144.

[65]
Yao W Y, Xiao P Q, Shen Z Z et al., 2016. Analysis of the contribution of multiple factors to the recent decrease in discharge and sediment yield in the Yellow River Basin, China. Journal of Geographical Sciences, 26(9): 1289-1304.

DOI

[66]
Yao Y R, He C, Li S Y et al., 2019. Properties of particulate matter and gaseous pollutants in Shandong, China: Daily fluctuation, influencing factors, and spatiotemporal distribution. Science of the Total Environment, 660(1): 384-394.

[67]
Ye P H, Li J, Ma W J et al., 2022. Impact of collaborative agglomeration of manufacturing and producer services on air quality: Evidence from the emission reduction of PM2.5, NOx and SO2 in China. Atmosphere, 13(6): 966.

DOI

[68]
Zeng P, Shang L J, Xing M K et al., 2023. Spatial correlation between producer services agglomeration and carbon emissions in the Yangtze River Economic Belt based on point-of-interest. Scientific Reports, 13(1): 1-16.

DOI

[69]
Zhang L, Mu R Y, Hu S H et al., 2022. Industrial co-agglomeration, technological innovation, and environmental pollution in China: Life-cycle perspective of co-agglomeration. Journal of Cleaner Production, 362(8): 132280.

DOI

[70]
Zhang Y, Wang S H, 2021. Influence of marine industrial agglomeration and environmental regulation on marine innovation efficiency: From an innovation value chain perspective. Marine Policy, 134(12): 104807.

DOI

[71]
Zhao H B, Liu Y X, Gu T S et al., 2022. Identifying spatiotemporal heterogeneity of PM2.5 concentrations and the key influencing factors in the middle and lower reaches of the Yellow River. Remote Sensing, 14(11): 26-43.

DOI

[72]
Zhao J, Dong X C, Dong K Y, 2021. How does producer services’ agglomeration promote carbon reduction? The case of China. Economic Modelling, 104(11): 105624.

DOI

[73]
Zheng H, He Y, 2022. How does industrial co-agglomeration affect high-quality economic development? Evidence from Chengdu-Chongqing Economic Circle in China. Journal of Cleaner Production, 371(10): 133485.

DOI

[74]
Zheng R J, Wu G, Cheng Y et al., 2023. How does digitalization drive carbon emissions? The inverted U-shaped effect in China. Environmental Impact Assessment Review, 102(9): 107203.

DOI

[75]
Zhou J K, Yin T, Tian J, 2022. Research on the impact of Beijing-Tianjin-Hebei electric power and thermal power industry on haze pollution. Energy Reports, 8(7): 1698-1710.

DOI

[76]
Zhou L, Yuan B, Mu H W et al., 2021. Coupling relationship between construction land expansion and PM2.5 in China. Environmental Science and Pollution Research, 28(25): 33669-33681.

DOI

[77]
Zhou L, Zhou C H, Fan Y et al., 2019. Spatio-temporal evolution and the influencing factors of PM2.5 in China between 2000 and 2015. Journal of Geographical Sciences, 29(1): 253-270.

DOI

[78]
Zhu X H, Dai C, Wei Y G, 2022. Does the opening of high-speed railway improve air quality? Evidence from China. Socio-Economic Planning Sciences, 121(12): 101381.

[79]
Zou Z D, Zhao W, You M et al., 2022. Evolutionary relationship between the PM2.5 concentration and urbanization in the Yellow River Ecological and Economic Zone. Environmental and Sustainability Indicators, 16(12): 100198.

DOI

Outlines

/