Research Articles

Territorial spatial zoning based on suitability evaluation and its impact on ecosystem services in Ezhou city

  • NIU Jinye , 1 ,
  • JIN Gui , 1, * ,
  • ZHANG Lei 2
Expand
  • 1. School of Economics and Management, China University of Geosciences, Wuhan 430074, China
  • 2. Faculty of Resources and Environment Science, Hubei University, Wuhan 430062, China
* Jin Gui, PhD and Professor, E-mail:

Niu Jinye (1999-), Master Candidate, specialized in land management and environmental economics. E-mail:

Received date: 2022-10-24

  Accepted date: 2023-09-05

  Online published: 2023-11-15

Supported by

National Natural Science Foundation of China(71974070)

National Natural Science Foundation of China(41501593)

Abstract

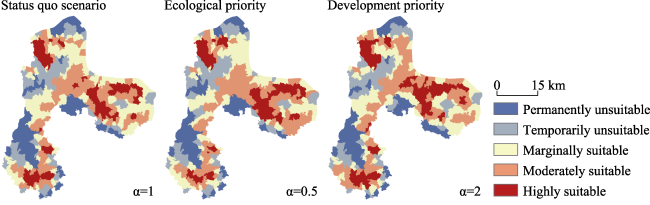
Exploring the spatial zoning of urban territories and their ecological effects under different decision preferences is an important approach to promote the sustainable utilization of regional resources. This paper constructs an index system for evaluating the suitability of territorial space development from the perspectives of urban development, agricultural production, and ecological conservation. It predicts and simulates the trade-offs between territorial space development and protection in Ezhou under different decision preferences using the Analytic Hierarchy Process (AHP) and Ordered Weighted Averaging (OWA) method. The modified equivalent factor method is used to analyze the ecosystem service values of different functional areas. The results indicate the following: (1) the preferences of decision-makers considerably influence the level of territorial space suitability. Higher (lower) levels of concern for risk result in more optimistic (pessimistic) evaluators, and this affects the priority given to ecological protection (development and utilization). (2) Under the ecological priority scenario, the status quo scenario and development priority scenario, there are significant differences in regional suitability levels. The ecological priority scenario gives high importance to ecological protection, resulting in the absolute protection of the Liangzi lake area, with 42.59% of Liangzihu district considered unsuitable for development. In contrast, the development orientation scenario designates Echeng district, an economic and political center, as highly suitable for development, with over 60% of the area available for development. (3) The total value of ecosystem services in Ezhou city was 213.355 billion yuan in 2018. Ecosystem service values were mainly provided by the water area in the permanently unsuitable development zone, leading to a mismatch between the supply and demand of ecosystem services under different scenarios.

Cite this article

NIU Jinye , JIN Gui , ZHANG Lei . Territorial spatial zoning based on suitability evaluation and its impact on ecosystem services in Ezhou city[J]. Journal of Geographical Sciences, 2023 , 33(11) : 2278 -2294 . DOI: 10.1007/s11442-023-2176-9

1 Introduction

Rapid urbanization with extensive expansion has led to a series of problems, such as the deterioration of ecological environment and the inefficiency of space utilization (Liu et al., 2018). Moreover, the limitation of urban space contradicts with the infinity of human needs, resulting in the continuous occupation of urban ecological space (Yang et al., 2018). With the transformation of China’s economy from high-speed growth to high-quality development, the future pattern of territorial space will be reshaped, which should not only ensure economic development and food security, but also focus on improving ecological values and people’s quality of life (Ning et al., 2018). Therefore, optimizing the layout and promoting the efficient utilization of territorial space are the key points for the continuous improvement of the governance system and capacity (Fan and Zhou, 2021). It is urgent to plan and regulate the development and utilization of territorial space in the process of urban development, to seek the balance of resources in promoting eco-social development and eco-environmental protection, and to provide a scientific basis for coordinated regional development and ecological compensation (Du et al., 2021).
Previous studies have shown that the optimal utilization of territorial space mainly focuses on functional zoning and optimal layout, in which functional definition is the basis (Fan et al., 2023). The evaluation and regulation of zoning are the means, while efficient utilization of resources and the improvement of ecological function are the objectives. Territorial space suitability evaluation is the key step of territorial space optimization. The choice of decision-making scale should adapt to the target object of macro control and can directly reflect the change of micro subjects (Jin et al., 2018). The continuous refinement of the research scale is not only the landing of the main function area on the micro scale but also indicates that the analysis of spatial zoning control in the city or county has received widespread attention. The research perspective of suitability evaluation has gradually changed from single economic profit maximization to the integration of economic-social-environmental multi-dimensional benefits (Liu et al., 2020b). This means emphasizing the unity of the “production-living-ecological” spaces and highlighting the comprehensive functional effectiveness in the process of territorial space zoning management and control. Common suitability evaluation methods include system dynamics (Liu et al., 2020a), ecological footprint model, multi-index comprehensive evaluation (Ding et al., 2021), BP neural network (Girma et al., 2022), and OWA ordered weighted average (Mokarram and Hojati, 2017). The change of land space use directly affects the type, quality, and value of ecosystem services (Ouyang et al., 2016).
The changes in territorial space not only directly affect the landscape patterns but also have an important impact on the surrounding social economy and ecological environment (Hasan et al., 2020). The zoning regulation of territorial space should pay attention to the optimization of the layout of territorial space and the coupling of social-economic- ecosystems at the same time (Li et al., 2019). As the bearer of ecosystem services, the change of utilization mode and intensity of territorial space directly affects the process and value of ecosystem services. Different propensities for territorial space development lead to different layout blueprints and different rates of population and economic expansion, with different pressures on the ecological environment and food security (Jin et al., 2020b). Ecosystem services, as a bridge between the natural environment and human economic-social aspects, make a great contribution to reducing the negative impact caused by the misallocation and abuse of territorial space (Li et al., 2021). The increase in ecosystem services can sometimes balance the contradiction between regional economic development and ecological conservation (Liu et al., 2019), stabilize food supply and security, and build an ecological security pattern. Therefore, historical data were used as a reference to explore the impact of optimal utilization of territorial space on ecosystem service value change, and few studies have examined the evolution of territorial space and its ecological function changes under different scenarios from a dynamic perspective (Gomes et al., 2021).
In general, although there are many empirical cases of territorial spatial suitability evaluation, most of them evaluate the current situation from a static perspective (Jin et al., 2019b). This paper aims to reveal the characteristics and patterns in the future process of territorial space under different development protection strategies by introducing factors characterizing risk preferences, with a view to meeting the dynamic needs of policy management and scenario analysis (Jin et al., 2020a). Previous studies failed to consider the development modes adapted to local conditions and their impact on ecological effects and lacked comprehensive analysis of social and ecological dimensions (Deng et al., 2016). In view of this, this paper calculates the ecological performance under different spatial partitions and fully integrates geospatial partitioning and ecosystem service values, thereby enhancing the application of ecosystem service research in the management of territorial spatial partitions.
To sum up, this study intends to introduce the OWA algorithm to dynamically evaluate the suitability of territorial space development in Ezhou under different development and protection strategies. It aims to research the territorial space zoning and its ecosystem service value under different scenarios, providing a scientific basis for optimizing the management of territorial space zoning and forming a rational layout and environmentally friendly eco-economic system in Ezhou.

2 Materials and methods

2.1 Study area

Ezhou city, located in the east of Hubei province, in the middle of the Yangtze River Economic Belt (Figure 1), is one of the important cities in the Wuhan metropolitan area. The total area of Ezhou city exceeds 1596 km2, belonging to the subtropical monsoon climate. The overall terrain is higher in the southeast, lower in the northwest, and lower in the middle, including plain, hilly, and mountainous areas. The main land-use types consist of cultivated land and water area, accounting for approximately 2/3, while the area of construction land is very limited, leading to a significant trade-off between urban development and environmental protection. The gross domestic product (GDP) of Ezhou city in 2021 is 120 billion yuan, with a year-on-year growth of 19.38%, ranking first in the province. This development trend will not change fundamentally, and the future development demand brought about by rapid urbanization makes the construction land gradually occupy ecological land such as cultivated land, forest, wetland, water, and so on, leading to the intensification of land-use contradiction between the development and protection of territorial space. Compared with 2018, the urban ecological service has been reduced by 5.97%, seriously affecting regional ecological security and food security. Moreover, as a national ecological civilization demonstration zone, Ezhou bears great responsibility for the double protection of ecological security and food security. Therefore, taking Ezhou as a typical area, the zoning control of territorial space is explored to provide scientific support for regional ecological civilization construction and resource optimization.
Figure 1 Location of Ezhou city, Hubei province, China

2.2 Data sources

This study includes two types of data (Table 1): (1) basic geographic information data, including land cover data (land-use data), meteorological data (PM2.5, temperature, and precipitation), soil data (soil erosion, soil pollution), and digital elevation model (DEM). (2) Social and economic data, including education, road infrastructure, economy, population density, and GDP. To obtain all levels of markets, schools, and traffic stations from Amap, Python programming language was utilized. Indicators such as business prosperity, education level, and traffic accessibility were calculated using the distance analysis tool of ArcGIS software. Social statistical data, such as gross agricultural output value and sown area of grain crops, were collected from relevant yearbooks and processed by spatial grid through conversion tools. To ensure accuracy and consistency, the spatial coordinate system of all the above data was unified as WGS_1984_UTM_Zone_49N. The data was further processed using the resampling function of ArcGIS software, with a spatial resolution of 30 m (Wang et al., 2020), to address any inconsistent data specifications used for calculation.
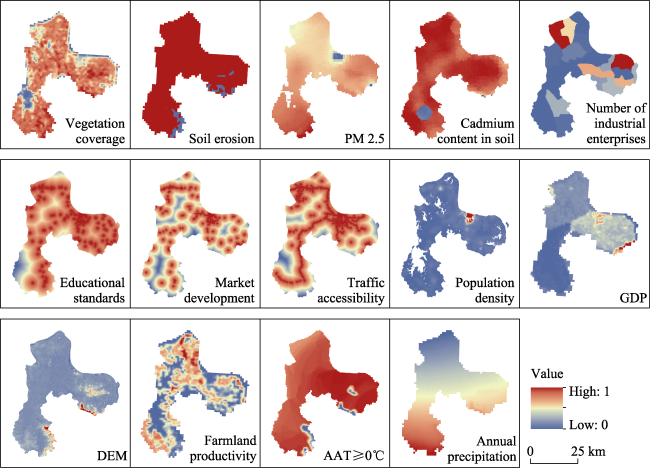
Table 1 Indicators and data sources for suitability evaluation of Ezhou city
Category Data Data source
Land cover data Land-use data Resources and environment science and data center (http://www.resdc.cn)
Vegetation coverage
Meteorological data Accumulated temperature above 0℃
Annual precipitation
Annual average PM2.5 concentration NASA Earth Observing System data and Information System Data Center
(https://sedac.ciesin.columbia.edu)
Soil data Soil pollution A regional geochemical survey of Ezhou city and Huangshi city
Soil erosion Resources and environment science and data center (http://www.resdc.cn)
Terrain DEM Geospatial data cloud (http://www.gscloud.cn)
Socioeconomic data Market economy level Obtain the geographic location data of points of interest (POI) from Amap through Python data acquisition
Education level
Road accessibility
Number of industrial enterprises China County Statistical Yearbook (Township Volume)
Population density World pop project (https://www.worldpop.org)
Gross domestic product (GDP) Resources and environment science and data center (http://www.resdc.cn)
Farmland productivity potential
Gross agricultural output value Rural Statistical Yearbook of Hubei Province
sown area of grain crops

2.3 Method description

2.3.1 Index system construction and weight determination

The coordinated development of “production-living-ecological” spaces is an inherent requirement for economic development and ecological civilization construction in urbanized regions. The trade-off and conflict among them will influence the mode and intensity of regional land space development and utilization. Therefore, this paper constructed the suitability evaluation of territorial space development and utilization from three aspects: agricultural production, urban construction, and ecological environment (Jin et al., 2019a).
The evaluation indicators in this study were selected based on the following principles: (1) indicators with high relevance in this region, (2) stability and difference of the data, and (3) data availability. A total of 14 indicators were selected in this study to construct the evaluation system. Agricultural production focuses on the basic terrain and conditions suitable for farming and is generally evaluated based on the basic conditions and elements of agricultural production (Cláudia et al., 2022), such as altitude, temperature, precipitation, and production potential. Urban construction is usually considered from multiple-dimensional perspectives, including population, economy, transportation, education, and life convenience degree (Yang et al., 2018). Environmental protection includes the main factors of ecological importance and ecological vulnerability, reflecting the ecological function and environmental quality (Zhang et al., 2019).
The Analytic Hierarchy Process (AHP), which considers both decision-maker’s subjective judgment and knowledge and experience, is often used to solve multi-factor and multi-scheme problems. Therefore, AHP was adopted to calculate the weight of each evaluation factor using the Yaahp10.2 software (Table 2). The results of the survey, which asked several experts, scholars, and practitioners in this field, showed that the consistency ratio of the judgment matrix was <0.1 and passed the consistency test. Range standardization was used to standardize the original values, where negative indices were processed by (1−x). All index data were treated within the range of 0-1 (Figure 2), and the smaller the value, the more inappropriate the evaluation result is.
Table 2 Weight calculation results of suitability evaluation indexes
Criterion layer Index layer Index meaning/calculation Indicators of plus or minus Relative weight Absolute weight
Agricultural production
(0.3333)
Elevation Digital elevation, used to characterize the topography, is a basic condition for agricultural production + 0.1056 0.0352
Farmland productivity potential the GAEZ (Global Agro-Ecological Zones) model was used to reflect the regional agricultural production capacity and land quality, and there are direct data + 0.4425 0.1475
Accumulated temperature >0℃ Sum of daily mean temperatures >0℃, which measure crop ripening, growth, and development + 0.1473 0.0491
Annual
precipitation
The annual precipitation, which is a reflection of the wetness of the climate, also indirectly affects the type and distribution of crops + 0.3045 0.1015
Town construction
(0.3333)
Education
level
Distance to schools at all levels, including kindergarten, primary and secondary, used to reflect the level of teaching and educational resources in the area + 0.1860 0.0620
Market
development level
Distance to supermarkets, integrated markets, and special commercial streets, reflecting the level of development of market vitality and commodity economy + 0.1194 0.0398
Number of
industrial
enterprises
The number of industrial enterprises, indicating the level and quality of development of the secondary industry + 0.1182 0.0394
Road
accessibility
The convenience of transportation is expressed by
the distance from transportation stations, including airports, railway stations, port terminals, coach
stations, subway stations, bus stations, etc.
+ 0.1464 0.0488
Population
density
The number of permanent residents per unit area, expressing population distribution + 0.1404 0.0468
GDP The economic situation and development level of
a region
+ 0.2895 0.0965
Ecological protect
(0.3333)
Vegetation
coverage
Ratio of forest area to total land area, which is the abundance of forest resources + 0.2613 0.0871
Soil erosion The amount of soil erosion caused by denudation and displacement per unit area and unit cycle under the combined action of natural forces and human activities, reflecting the ecological vulnerability - 0.2448 0.0816
Annual average PM2.5 concentration Refers to dust or drifting dust with a diameter ≤2.5 microns in the ambient air, indicating the level of air quality and pollution level - 0.1308 0.0436
Soil pollution The content of heavy metal cadmium in the soil is the characteristic indicator according to the actual situation of the soil in Ezhou city - 0.3630 0.1210
Figure 2 Spatial distribution of standardized suitability evaluation indexes of Ezhou city

2.3.2 Different decision preference setting based on OWA

The Ordered Weighted Averaging (OWA) algorithm can achieve dynamic weighting under different decision preferences, and it can avoid errors caused by relying solely on subjective decisions by combining the criterion weight and order weight of each index (Guo et al., 2022). The OWA operator determines the criterion order of urbanization development, agricultural land protection, and ecological conservation, while the order of indexes is determined based on the relative weight of each index to reflect the preference attitude of evaluators. Generally, if the evaluator is more optimistic, higher importance will be given to the order with higher priority, and the results will directly highlight the most important attributes in the index. Conversely, if the evaluator is more pessimistic, higher importance will be given to the order with lower priority, and the evaluation result may not effectively reflect the important attributes of the index. The specific formula is as follows:
$\begin{matrix} OW{{A}_{i}}=\underset{j=1}{\overset{n}{\mathop \sum }}\,\left[ \frac{{{u}_{j}}{{v}_{j}}}{\mathop{\sum }_{j=1}^{n}{{u}_{j}}{{v}_{j}}} \right]{{Z}_{ij}} \\ \end{matrix}$
where uj represents the criterion weight of each index; vj represents the order weight of each index, and Zij represents the attribute value of the evaluation index. Previous studies on the sequence weight of OWA have shown that the monotone rule increasing (RIM) is more classical and easier to understand. Therefore, in this study, RIM is used to quantitatively calculate the order weight. The formula is expressed as follows:
$\begin{matrix} {{v}_{j}}={{Q}_{RIM}}\left( \frac{j}{n} \right)-{{Q}_{RIM}}\left( \frac{j-1}{n} \right), \\ \end{matrix}$
$\begin{matrix} j=1,2,...,n,{{Q}_{RIM}}\left( r \right)={{r}^{a}} \\ \end{matrix}$
where j represents the order, vj represents the order weight, n is the number of indicators, r is the independent variable of function Q, and α is used to indicate the decision risk and optimism of the decision-makers. When α = 1, it indicates that the decision-makers have no obvious preference in weight allocation and risk, and only consider the criteria weight. When α < 1, it indicates that decision-makers are optimistic that the environmental constraints can restrict the development and construction of land space, and the more important the attribute is, the greater the order weight is. On the other hand, when α > 1, it means that the decision-making is pessimistic, and the restrictive conditions will not affect the development suitability. In this case, the more important the attribute, the smaller the order weight. The specific calculation results of the bit order weight are shown in Table 3.
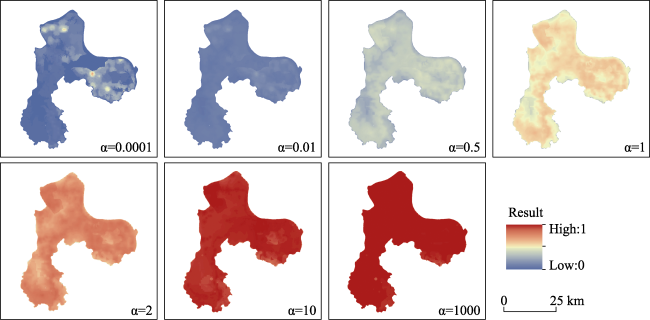
Table 3 Calculation results of sequence weight of suitability evaluation indexes
A
sequence weight
α = 0.0001 α = 0.1 α = 0.5 α = 1 α = 2 α = 10 α = 1000
The most
optimistic
complete
protection
Optimistic More optimistic No
preference
More pessimistic Pessimistic The most
pessimistic
fully developed
ν1 1.0000 0.7680 0.2673 0.0714 0.0051 0.0000 0.0000
ν2 0.0000 0.0551 0.1107 0.0714 0.0153 0.0000 0.0000
ν3 0.0000 0.0341 0.0849 0.0714 0.0255 0.0000 0.0000
ν4 0.0000 0.0250 0.0716 0.0714 0.0357 0.0000 0.0000
ν5 0.0000 0.0199 0.0631 0.0714 0.0459 0.0000 0.0000
ν6 0.0000 0.0166 0.0570 0.0714 0.0561 0.0002 0.0000
ν7 0.0000 0.0143 0.0525 0.0714 0.0663 0.0008 0.0000
ν8 0.0000 0.0125 0.0488 0.0714 0.0765 0.0027 0.0000
ν9 0.0000 0.0112 0.0459 0.0714 0.0867 0.0083 0.0000
ν10 0.0000 0.0101 0.0434 0.0714 0.0969 0.0225 0.0000
ν11 0.0000 0.0093 0.0413 0.0714 0.1071 0.0551 0.0000
ν12 0.0000 0.0085 0.0394 0.0714 0.1173 0.1244 0.0000
ν13 0.0000 0.0079 0.0378 0.0714 0.1276 0.2625 0.0000
ν14 0.0000 0.0074 0.0364 0.0714 0.1378 0.5234 1.0000

2.3.3 Ecosystem services assessment

Ecosystem services play a vital role in providing humans with the material basis for survival and development, balancing biogeochemical cycles, and maintaining biodiversity and life systems (Costanza et al., 1997). Furthermore, urbanization and land-use changes have a significant impact on the value of ecosystem services (Sannigrahi et al., 2018). It is essential to measure the value of ecosystem services based on different decision intentions regarding development and protection strategies (Luo et al., 2022). The ecosystem services value was evaluated using the equivalent factor approach proposed by Xie et al. (2015a), which assigns monetary values to land-use types and is widely accepted. In this study, the spatiotemporal dynamic adjustment method of net primary productivity (NPP), precipitation, and soil conservation was adopted to measure the ecosystem services value based on the 2010 equivalent factor table proposed by Xie et al. (2015b). The specific formula is as follows:
$\begin{matrix} {{F}_{ni}}=\left\{ \begin{array}{*{35}{l}} {{P}_{i}}\times {{F}_{n1}},\text{or} \\ {{R}_{i}}\times {{F}_{n2}},\text{or} \\ {{S}_{i}}\times {{F}_{n3}}, \\ \end{array} \right. \\ \end{matrix}$
where Fni is the equivalent factor of unit area value of type n ecological service function in region i; Pi refers to NPP regulatory factor; Ri is the precipitation regulation factor; Si for soil conservation regulatory factors.
The economic value of a unit of equivalent factor can be replaced by 1/7 of the average yield per unit area of grain in the region (Xie et al., 2015b). The formula is as follows:
$\begin{matrix} D=\frac{1}{7}\times \frac{V}{A} \\ \end{matrix}$
where D represents the ecosystem service value represented by a standard unit equivalent factor; V represents the total agricultural output value; A represents the total area of all food crops. D of Ezhou is calculated as 12,015.60 yuan/ha.

3 Results

3.1 Developed and protected zoning of territorial space

3.1.1 Evaluation results of development suitability under different preferences

Dynamic simulation with different preferences is becoming increasingly important for government management and decision-making. The α value was defined based on the optimal utilization of “production-living-ecological” spaces, considering both development and protection aspects to obtain the order weight with different constructed bearing capacity. The results under seven preferences are shown in Figure 3.
Figure 3 Evaluation results of development suitability under different preferences in Ezhou city
Neutral decision preference scenario (α = 1): In this scenario, α = 1 indicates that the decision-maker has no obvious preference, giving equal importance to the development and protection of territorial space. Agricultural production is further emphasized, and the indexes of farmland protection significantly influence the evaluation results. The suitability pattern of territorial space development in the Ezhou area shows distinct differences. The flat southwest, southeast, northern, and central regions have higher suitability for territorial space development, while the Liangzi lake area, southeastern area of Liangzihu district, southwest of Echeng district, and areas along the riverside have relatively lower development suitability.
Optimistic decision preference scenario (α < 1): Under the optimistic scenario, policy makers place more emphasis on ecological conservation strategies than on development strategies, making ecological conservation the primary consideration in conflicts between ecology and construction. As the degree of optimistic preference increases, development behavior becomes more conservative, resulting in few regional developable areas. In the most optimistic scenario (α = 0.0001), the proportion of developable area in the study area decreases further, indicating that decision-makers attach great importance to eco-environmental risks. As the concern for risk decreases, the overall regional suitability slightly increases, and indicators with restrictive effects on regional development decrease. A slight increase in the ranking weight of indicators favoring urban construction leads to an increase in development preferences. However, most areas still show low suitability for urban construction and development.
Pessimistic decision preferences scenarios (α > 1): The pessimistic decision scenario indicates that the constraints of ecological and agricultural development have little impact on urban construction, favoring the development strategy. Decision-makers pay more attention to indicators such as market development level and road accessibility, with areas having higher values in these indicators becoming key areas for future development. For example, except for higher elevation areas in the middle and southwest of Echeng district, the development suitability value of other areas is higher. The area along the Liangzi lake shows a development trend due to its high density of road networks and development of markets and education. Similarly, Gedian town in the northwest of Huarong district also exhibits significantly higher suitability for territorial space development. However, when the decision-maker is extremely pessimistic, they consider the index values to be extremely unreliable, leading to a high overall suitability value, which sharply increases the suitability of development and construction. Thus, the reliability of the results is poor in such cases.

3.1.2 Functional zoning based on multiple scenarios

The above research indicates that when α is too large or too small, the evaluation results of development suitability become more concentrated, and the distribution difference in the region becomes less apparent, making it difficult to propose reasonable suggestions for zoning management or resource development and protection. Additionally, excessively large or small α values suggest that decision-makers have significant preference fluctuations, which do not reflect the actual situation accurately. Therefore, α = 1 was selected as the result of a normal trade-off among environmental protection, urban construction, and agricultural development under the current status. When α = 0.5, it represents an ecological priority preference for conservation decisions under conditions of high-risk concern. Conversely, when α = 2, it indicates an optimistic estimation of urban construction and development, with the belief that ecological conservation has limited influence on urban construction, leading to a preference for a high-risk strategy. The evaluation results were divided into five categories through the statistics of the village boundary zones (Yao et al., 2021), including highly suitable development zone, moderately suitable development zone, marginally suitable development zone, temporarily unsuitable development zone, and permanently unsuitable development zone (Figure 4).
Figure 4 Zoning under “status quo,” “ecological priority” and “development priority” scenarios in Ezhou city
Status quo scenario: The spatial zoning species is dominated by marginally suitable development zones, accounting for 27.1%, while permanently unsuitable development zones and highly suitable development zones account for the smallest proportion. The three administrative regions have formed an obvious functional partition. Echeng district, with its political and economic center, shows a higher development suitability than the other two zones. Most areas of the central plain were moderately suitable for development, which corresponds to the high farmland productivity. They make use of their suitable topographic conditions and favorable soil and water climate to steadily develop agricultural production.
Ecological priority scenario: The proportion of highly suitable development zones is relatively small, and the development type of most areas is marginally suitable, temporarily unsuitable, or permanently unsuitable. The main reason is that the region has the largest freshwater lake, Liangzi Lake Ecological Reserve, in Hubei province, which has an excellent ecological environment and rich biodiversity. The conservative strategy of giving priority to ecology limits the development of the region in large areas. The development suitability of Zhaozhai village and Baotuan village in the central part of Echeng district is also not high. They are located in a mountainous area with a high altitude, limited development level of traffic, market, and education, and relatively slow economic development.
Development priority scenario: The proportion of moderately suitable development zone and high suitable development zone has greatly increased, accounting for a total of 44% of the total, with only a small proportion of the territories being permanently unsuitable or temporarily unsuitable development zones. Due to the increase in the proportion of urban construction index, the development area of territorial space is distributed along roads, schools, markets, and other indicators, such as the eastern area of Echeng district and around Liangzi lake area. There are also areas suitable for development due to the high number of industrial enterprises. For example, Gedian town in the north not only has a high degree of industrial development, economic level, road density, and education level but also has few other limiting factors. Therefore, it could be listed as one of the suitable development zones or highly appropriate development zones with a high suitability level.
By comparing the areas of the different five suitable zones, it is found that Echeng district, as the center of economic and population in Ezhou, accounts for more than half of the highly suitable development zones and moderately suitable development zones, and less than 20% of the permanently unsuitable development zones and temporarily unsuitable development zones, showing a high level of development overall. Liangzihu district, as an ecological reserve that emphasizes the ecological environment protection with ecosystem service function and tourism development direction, has a permanent unsuitable development zone that accounts for about 26.76%. The development of Huarong district is in the middle of the above two areas, accounting for only about 1/4 of the extreme development and construction and absolute ecological protection area. As a transition zone connecting Wuhan, it is important to pay attention to structural optimization and ecological protection while developing the economy.

3.2 Distribution of ecosystem services values

3.2.1 Status quo of ecosystem service value

The total value of ecosystem services of various types in Ezhou in 2018 was 213.355 billion yuan (Table 4), which was about twice the GDP of Ezhou city in 2018 (100.53 billion yuan). According to the definition of Ecological Economic Harmony (EEH), the ratio of ecosystem service value to regional GDP can be used to measure ecological security and economic development as a whole as an indicator of the coordination degree between the ecological environment and economic development. The EEH of Ezhou was greater than 1, which indicated that the coordination degree of the eco-economic system was low, and the eco-economic system was in good condition at this time. However, attention should be paid to economic development to avoid extreme differentiation of the eco-economy.
Table 4 Total value of ecosystem services and eco-economic coordination in Ezhou city in 2018
Ecological service
value (108 yuan)
GDP
(108 yuan)
Coordination degree
(ESV/GDP)
Population
(104)
Per capita ESV
(104 yuan/person)
GDP per capita
(104 yuan/person)
2133.55 1005.30 2.12 107.77 19.80 9.33
The ecosystem service value and composition are shown in Figure 5. The most important ecosystem types in Ezhou city are 9 types out of the total 14 types, including farmland (34.71%), water area (32.26%), bare land (13.05%), and forest (11.32%). Among these types, the water area provides the highest ecosystem service value of 192.34 billion yuan, accounting for 90.15% of the total. This is because Ezhou, adjacent to the Yangtze River, has the largest freshwater lake, numerous rivers and lakes, and is located in the subtropical monsoon climate zone, with more precipitation and obvious hydrological regulation. There are differences in the value of different services. The hydrological regulation and water resources supply services are the largest, accounting for 80.79% and 4.46% of the total value, respectively. The second largest services are environmental purification and climate regulation, accounting for 3.68% and 3.33% respectively. This is because the NPP of vegetation in Ezhou is 1.84 times that of the whole country, leading to significant regulation services.
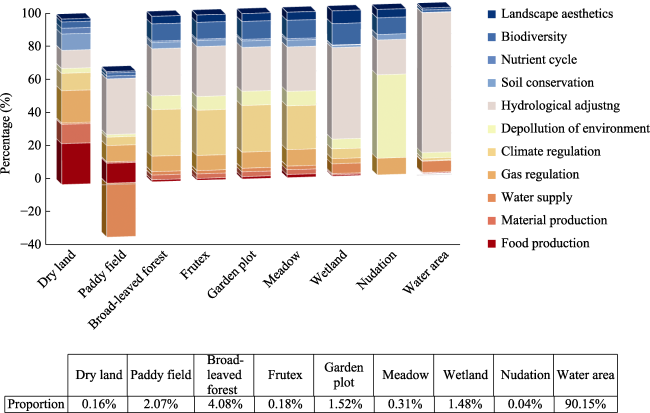
Figure 5 Composition of ecosystem service value in Ezhou city

3.2.2 Ecosystem service value based on evaluation zoning

Depending on the development and conservation strategy, the spatial zoning within the study area varies, which, in turn, affects the type of land use within each zone. The ecosystem service values of different zones under different scenarios were calculated (Figure 6). The results showed that the proportion of ecosystem service values in the five development zones followed a similar trend under different development and protection scenarios. As expected, the permanently unsuitable development zones provided the largest proportion of ecosystem service values, while the highly suitable development zones contributed the least. Liangzihu district, being a typical permanently unsuitable development area with a firm policy of environmental protection and ecosystem maintenance, provided nearly 1/3 of ecosystem service values. On the other hand, Echeng district, being part of the highly suitable development zones, only contributed 6%-8% of the ecosystem service values. Despite creating most of the regional GDP, its contribution to ecosystem value was relatively small. Therefore, ecological compensation between these regions would be necessary.
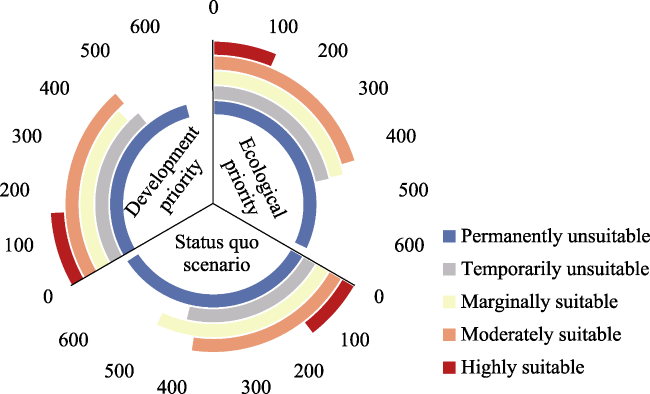
Figure 6 Ecosystem service value based on the results of each region under different scenarios (108 yuan)
Compared with the status quo scenario, 68.5% of the land in different zoning districts under the development priority scenario experienced changes, with land-use type flowing from permanently unsuitable waters, temporarily unsuitable forests, and critically suitable agricultural land and waters being transformed into deserts with mainly impermeable ground in suitable development areas, resulting in a 24.8% loss of ecosystem service value of permanently unsuitable development areas with an ecological focus. Furthermore, under the ecological priority scenario, 45% of the land area underwent change, with a smaller percentage of change in permanently unsuitable and temporarily unsuitable areas due to the conservation strategy. The change in ecosystem service value was mainly caused by the reduction of forest and waters in the marginally suitable development zones, but the overall change was not significant.

4 Discussion and implications

4.1 Research on territorial space zoning

The study on the suitability evaluation of territorial space development and utilization and the division of spatial functional zones represents the application and theoretical deepening of the main functional zones theory on the municipal scale (Zhang et al., 2019a). Compared with the traditional multi-criteria decision-making model, this study combines the index weight that reflects subjective intention preference with the order weight calculated in the OWA algorithm to evaluate spatial development suitability. This method enables dynamic simulation of policy scenarios under different decision-making preferences, division of different regions, and calculation of their ecosystem service values, accurately revealing the carrying effect of various regions on ecological functions, and providing a basis for territorial space zoning management and control. The findings of this study align well with Ezhou’s “14th Five-Year Plan (2021-2025),” which focuses on urban-rural integration and development in Huahu Airport and Gedian Development Zone, emphasizing infrastructure construction and building an open economic platform for high-quality development of Ezhou’s business economy.

4.2 Ecosystem services under zonal management

The different strategies will impact future land-use change and food and ecological security (Cláudia et al., 2022). By analyzing the differences in ecosystem service values under three policy scenarios in Ezhou, it is evident that different development and conservation scenarios affect the flow of ecosystem service values, with changes in land-use types such as water area, cropland, forest, and construction land being the main factors affecting the changes in ecosystem service values. The hydrological regulation service and water supply service have significant impacts on the regional ecological environment quality.
The interaction between land-use change, territorial spatial management policies, and changes in ecosystem services, as well as different decision-making preference scenarios, directly affect the utilization and development level of regional territorial space and indirectly impact the quality of regional ecosystem services (Liu et al., 2019). Due to the different change patterns of land-use composition in different development and utilization zones, ecosystem service values will also vary, necessitating the consideration of multi-dimensional impacts in the process of regulating ecosystem service value (Xiang et al., 2021). Clear functional zoning of territorial space, improved complexity, and diversity of regional functions lay the foundation for the preservation and appreciation of ecosystem services.

4.3 Management and policy implications

As the closest and most connected city in the Wuhan city cluster with the greatest development potential, optimizing the spatial layout of the whole area of Ezhou is of great benefit to improving the sustainability of urban development and the diversity of ecological functions. The key to spatial optimization in Ezhou city lies in accurately identifying and regulating regional functions (Miao and Zhang, 2021). The functional zoning of the three administrative regions of Ezhou city is relatively clear, and it also has two functional special zones, the national Gedian economic and technical development zone and the provincial airport economic zone.
The quantitative and qualitative services provided by ecosystems also play a crucial role in the sustainable development of territorial space and in alleviating the contradiction between development and protection. Therefore, territorial spatial planning considering ecosystem services can provide more effective guidance to decision-makers. It is necessary to improve the mechanism of ecological compensation and agricultural compensation in Ezhou and promote regional coordination. Liangzihu district should prioritize the ecological environment, improve urban supporting functions and comprehensive transportation construction, and innovate new models of ecological health, green tourism, and ecological agriculture around the resource advantages of “green mountain, clear water, and perfect location,” opening the path of ecological value realization. Meanwhile, Huarong district should steadily develop and upgrade agriculture, highlight the resource advantages of Gedian town, and promote the optimal layout of land space and high-quality development of industry in Ezhou by relying on Optics Valley Science and Technology Innovation Corridor. Echeng district needs to play a leading role in integrating low-end traditional manufacturing industries, promoting the concentration of resources to middle and high-level industries, and highlighting the strategic position of Ezhou city in the “Wuhan 1+8” city circle.

4.4 Limitations and future studies

This paper aims to explore regional management and control based on development suitability evaluation and reveal the level of ecological function to improve resource utilization efficiency and promote regional sustainable development. However, due to the complexity of spatial systems, data collection, and technology, the accuracy of eco-efficiency studies is insufficient, and the complex interaction process between ecosystem services and economic and social needs to be studied in depth. This can be achieved through accurate calculation of ecosystem functions and values using field survey methods combined with statistical data and geographic information technology. Furthermore, while the suitability evaluation of territorial space development is a priority in territorial space planning, practical needs may require higher timeliness of decision-making. Thus, exploring how to make use of existing research resources to carry out rapid and accurate dynamic evaluations is a possible direction for future research. The suitability evaluation of territorial space is the unity of macro and micro scales (Wang and Fan, 2020), meaning that further studies should consider both the spatial layout’s potential to carry urban functions and industrial development on a macro scale and the feasibility and consequences of converting non-construction land to construction land on a micro scale (Chen et al., 2020).

5 Conclusions

In this study, the researchers constructed the suitability evaluation index system of territorial space development and protection. They used AHP and OWA algorithm coupling the criterion weight of factors with the order weight to dynamically simulate the preferences of decision-makers from optimistic to pessimistic, obtaining the development zoning of territorial space under different scenarios. The researchers also used the value equivalent factor method to calculate the ecosystem service value of Ezhou city in 2018 and analyzed the impact of development and protection strategies for territorial space zoning on it. The conclusions were as follows: (1) with the increase of risk factor α, decision-makers paid less attention to risk, leading to an increase in the value of suitability evaluation of territorial space development and utilization and more positive development behavior. Under the development strategy, urban development dominated, and suitable development areas were linearly distributed along areas with the most convenient conditions for urban construction. (2) The total value of ecosystem services in Ezhou city in 2018 was 213.355 billion yuan, mainly provided by water areas, with hydrological regulation services being the dominant type. Different scenarios had varying impacts on the structural change of ecosystems, resulting in significant differences in the value of ecosystem services in different development functional areas. Therefore, it is crucial to not only conserve the entire ecosystem but also propose ecological restoration measures for different functional areas to enhance the function value of ecological services.
[1]
Chen Y, Tian W T, Zhou Q et al., 2021. Spatiotemporal and driving forces of ecological carrying capacity for high-quality development of 286 cities in China. Journal of Cleaner Production, 293: 126186.

DOI

[2]
Cláudia M V, Dulce F, Patrícia A et al., 2022. Agricultural land systems importance for supporting food security and sustainable development goals: A systematic review. Science of The Total Environment, 806(3): 150718.

DOI

[3]
Costanza R, d’Arge R, de Groot R et al., 1998. The value of the world’s ecosystem services and natural capital. Ecological Economics, 25(1): 3-15.

DOI

[4]
Deng X Z, Li Z H, Gibson J, 2016. A review on trade-off analysis of ecosystem services for sustainable land-use management. Journal of Geographical Sciences, 26(7): 953-968.

DOI

[5]
Ding Y P, Shi B, Su G J et al., 2021. Assessing suitability of human settlements in high-altitude area using a comprehensive index method: A case study of Tibet, China. Sustainability, 13(3): 1485.

DOI

[6]
Du W P, Yan H M, Feng Z M et al., 2021. The supply-consumption relationship of ecological resources under ecological civilization construction in China. Resources Conservation and Recycling, 172: 105679.

DOI

[7]
Fan J, Zhou K, 2021, Theoretical thinking and approach exploration on deepening the implementation of major function zoning strategy with “Three-zones and Three-lines”. China Land Science, 35(9): 1-9. (in Chinese)

[8]
Fan J, Zhou K, Sheng K R et al., 2023. Territorial function differentiation and its comprehensive regionalization in China. Science China: Earth Sciences, 66(2): 247-270.

DOI

[9]
Girma R, Fürst C, Moges A, 2022. Land use land cover change modeling by integrating artificial neural network with cellular automata-Markov chain model in Gidabo river basin, main Ethiopian rift. Environmental Challenges, 6: 100419.

DOI

[10]
Gomes E, Inácio M, Bogdzevič K et al., 2021. Future land-use changes and its impacts on terrestrial ecosystem services: A review. Science of The Total Environment, 781: 146716.

DOI

[11]
Guo M, Cong X, Zheng H et al., 2022. Integrating the ordered weighted averaging method to establish an ecological security pattern for the Jianghuai ecological economic zone in China: Synergistic intraregional development. Ecological Indicators, 135: 108543.

DOI

[12]
Hasan S S, Zhen L, Miah M G et al., 2020. Impact of land use change on ecosystem services: A review. Environmental Development, 34: 100527.

DOI

[13]
Jin G, Chen K, Liao T et al., 2020a. Measuring ecosystem services based on government intentions for future land use in Hubei province: Implications for sustainable landscape management. Landscape Ecology, 36(7): 2025-2042.

DOI

[14]
Jin G, Chen K, Wang P et al., 2019a. Trade-offs in land-use competition and sustainable land development in the North China Plain. Technological Forecasting & Social Change, 141: 36-46.

[15]
Jin G, Deng X Z, Zhao X D et al., 2018. Spatio-temporal patterns of urban land use efficiency in the Yangtze River Economic Zone during 2005-2014. Acta Geographica Sinica, 73(7): 1242-1252. (in Chinese)

DOI

[16]
Jin G, Li Z H, Deng X Z et al., 2019b. An analysis of spatiotemporal patterns in Chinese agricultural productivity between 2004 and 2014. Ecological Indicators, 105: 591-600.

DOI

[17]
Jin G, Shi X, He D W et al., 2020b. Designing a spatial pattern to rebalance the orientation of development and protection in Wuhan. Journal of Geographical Sciences, 30(4): 569-582.

DOI

[18]
Li J S, Sun W, Li M Y et al., 2021. Coupling coordination degree of production, living and ecological spaces and its influencing factors in the Yellow River Basin. Journal of Cleaner Production, 298: 126803.

DOI

[19]
Li Z G, Sun Z S, Tian Y J et al., 2019. Impact of land use/cover change on Yangtze River Delta urban agglomeration ecosystem services value: Temporal-spatial patterns and cold/hot spots ecosystem services value change brought by urbanization. International Journal of Environmental Research and Public Health, 16(1): 123.

DOI

[20]
Liu D Y, Zheng X Q, Wang H B, 2020a. Land-use simulation and decision-support system (LandSDS): Seamlessly integrating system dynamics, agent-based model, and cellular automata. Ecological Modelling, 417: 108924.

DOI

[21]
Liu W, Zhan J Y, Zhao F et al., 2019. Impacts of urbanization-induced land-use changes on ecosystem services: A case study of the Pearl River Delta Metropolitan Region, China. Ecological Indicators, 98: 228-238.

DOI

[22]
Liu Y L, Liu L, Zhu A X et al., 2020b. Scenario farmland protection zoning based on production potential: A case study in China. Land Use Policy, 95: 104581.

DOI

[23]
Liu Y S, Li J T, Yang Y Y, 2018. Strategic adjustment of land use policy under the economic transformation. Land Use Policy, 74: 5-14.

DOI

[24]
Luo Y Y, Yang D W, O’Connor P et al., 2022. Dynamic characteristics and synergistic effects of ecosystem services under climate change scenarios on the Qinghai-Tibet Plateau. Scientific Reports, 12(1): 2540.

DOI PMID

[25]
Miao C H, Zhang B F, 2021. Regulation strategy of zoning-gradation-classification for high-quality development in the Yellow River Basin. Economic Geography, 41(10): 143-153. (in Chinese)

[26]
Mokarram M, Hojati M, 2017. Using ordered weight averaging (OWA) aggregation for multi-criteria soil fertility evaluation by GIS (case study: southeast Iran). Computers and Electronics in Agriculture, 132: 1-13.

DOI

[27]
Ning J, Liu J Y, Kuang W H et al., 2018. Spatiotemporal patterns and characteristics of land-use change in China during 2010-2015. Journal of Geographical Sciences, 28(5): 547-562.

DOI

[28]
Ouyang Z Y, Zheng H, Xiao Y et al., 2016. Improvements in ecosystem services from investments in natural capital. Science, 352(6292): 1455-1459.

DOI PMID

[29]
Sannigrahi S, Bhatt S, Rahmat S et al., 2018. Estimating global ecosystem service values and its response to land surface dynamics during 1995-2015. Journal of Environmental Management, 223: 115-131.

[30]
Wang J, Zhai T L, Zhao X D et al., 2020. Land development suitability evaluation for sustainable urban ecosystem management: Taking Yantai as an example. Acta Ecologica Sinica, 40(11): 3634-3645. (in Chinese)

[31]
Wang Y F, Fan J, 2020. Multi-scale analysis of the spatial structure of China’s major function zoning. Journal of Geographical Sciences, 30(2): 197-211.

DOI

[32]
Xiang W Q, Yang X H, Li Y Q, 2021. A set pair analysis model for suitability evaluation of human settlement environment. Thermal Science, 25(3): 2109-2116.

DOI

[33]
Xie G D, Zhang C X, Zhang C S et al., 2015a. The value of ecosystem services in China. Resources Science, 37(9): 1740-1746. (in Chinese)

[34]
Xie G D, Zhang C X, Zhang L M et al., 2015b. Improvement of the evaluation method for ecosystem service value based on per unit area. Journal of Natural Resources, 30(8): 1243-1254. (in Chinese)

[35]
Yang Q K, Duan X J, W L et al., 2018. Land use transformation based on ecological-production-living spaces and associated eco-environment effects: A case study in the Yangtze River Delta. Scientia Geographica Sinica, 38(1): 97-106. (in Chinese)

DOI

[36]
Yao M L, Shao D G, Lv C H et al., 2021. Evaluation of arable land suitability based on the suitability function: A case study of the Qinghai-Tibet Plateau. Science of The Total Environment, 787: 147414.

DOI

[37]
Zhang J F, Liu C Y, Chang F, 2019a. A new approach for multifunctional zoning of territorial space: The Panxi area of the upper Yangtze River in China case study. Sustainability, 11(8): 2325.

DOI

[38]
Zhang Y N, Long H L, Tu S S et al., 2019b. Spatial identification of land use functions and their tradeoffs/synergies in China: Implications for sustainable land management. Ecological Indicators, 107: 105550.

DOI

Outlines

/