
Journal of Geographical Sciences >
The spatial pattern of population-land-industry coupling coordinated development and its influencing factor detection in rural China
|
Li Xuhong (2000-), PhD Candidate, specialized in rural areal system and regional sustainable development. E-mail: lixuhong2479@igsnrr.ac.cn |
Received date: 2023-02-10
Accepted date: 2023-07-28
Online published: 2023-11-15
Supported by
National Natural Science Foundation of China(41931293)
National Natural Science Foundation of China(42293271)
Exploring the coupling coordinated level of rural population-land-industry (PLI) and its underlying driving mechanism contributes to the scientific decision-making on rural sustainable development. This study assessed the coupling coordinated level of PLI based on an improved evaluation index system and then revealed the regional differentiation and driving mechanism in China’s rural areas in 2020. The results showed that the rural PLI coupling coordinated degree was 0.4694, and thus was in the stage of approximate incoordination. In addition, China’s rural PLI coupling coordinated degree formed a spatially heterogeneous pattern with high levels in the northeast, eastern and central regions, and the intragroup difference contributed more than 80% to the total difference. The rural PLI coupling coordinated level was influenced by the combined effects of rural kernel and peripheral systems, but the rural kernel system mostly determined the differentiation. In the future, rural areas should first exploit population quality improvement projects, land consolidation projects and industrial integration development strategies to promote benign mutual feedback of PLI. Second, driving factors should be comprehensively regulated by implementing a “one village, one product” strategy, breaking the urban-rural dual system, improving agricultural machinery subsidies policy, and promoting urban-rural integrated development.
LI Xuhong , LIU Yansui , GUO Yuanzhi . The spatial pattern of population-land-industry coupling coordinated development and its influencing factor detection in rural China[J]. Journal of Geographical Sciences, 2023 , 33(11) : 2257 -2277 . DOI: 10.1007/s11442-023-2175-x
Table 1 Evaluation index of the population-land-industry coupling coordinated development level in rural China |
| Index | Index meaning | Unit | |
|---|---|---|---|
| Population | Rural permanent population (+) | Represents the level of rural human resources | 104 people |
| Proportion of rural population over 65 years old (-) | Represents the aging degree of rural population | % | |
| Average years of education of residents in the county (+) | Represents the quality of rural population | year | |
| Land | Cultivated land area at the county level (+) | Represents the number of cultivated land resources | ha |
| Rural residential land (-) | Represents the scale of rural residential land | ha | |
| The comprehensive production potential of farmland | Represents the quality level and production potential of farmland | kg/ha | |
| Industry | Grain output at county level (+) | Represents rural grain output level | tons |
| The output value of primary industry at the county level (+) | Represents the output benefit of rural resources | 108 yuan |
Note: “+” refers to a positive indicator, and “-” refers to a negative indicator. |
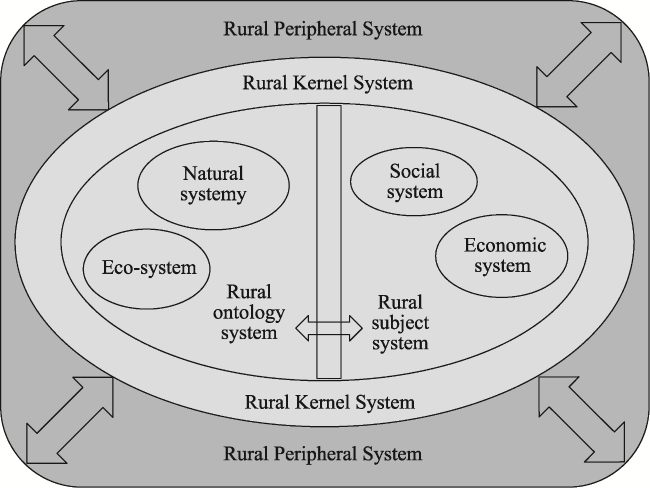
Figure 1 The hierarchical structure of the rural development system (Zhang and Liu, 2008) |
Table 2 Classification of rural population-land-industry coupling coordinated degree |
| Coupling coordinated degree | Coupling coordination level | Coupling coordinated degree | Coupling coordination level |
|---|---|---|---|
| 0.00≤D≤0.10 | Extreme incoordination | 0.50<D≤0.60 | Approximate coordination |
| 0.10<D≤0.20 | Serious incoordination | 0.60<D≤0.70 | Primary coordination |
| 0.20<D≤0.30 | Moderate incoordination | 0.70<D≤0.80 | Intermediate coordination |
| 0.30<D≤0.40 | Mild incoordination | 0.80<D≤0.90 | Good coordination |
| 0.40<D≤0.50 | Approximate incoordination | 0.90<D≤1.00 | Superior coordination |
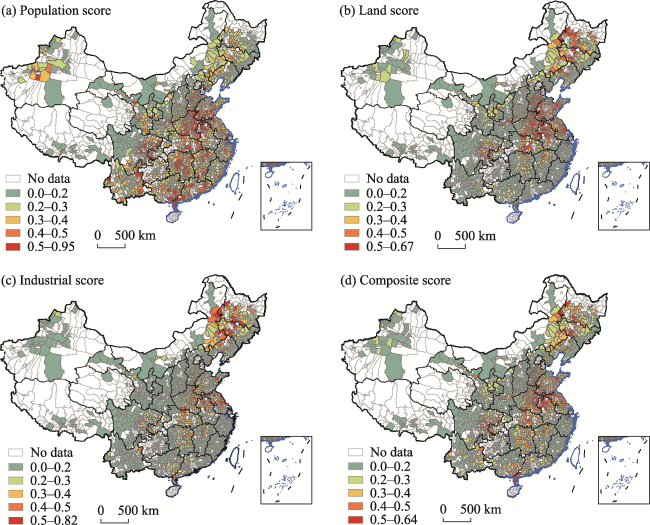
Figure 2 Each element and comprehensive development level of population-land-industry in rural China in 2020 |
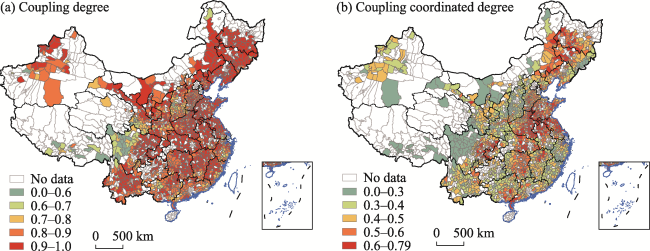
Figure 3 Spatial pattern of coupling degree and coupling coordinated degree of population-land-industry in rural China in 2020 |
Table 3 Development level of each element of rural population-land-industry in different regions of China |
| Population score | Land score | Industrial score | Composite score | Coupling degree | Coupling coordinated degree | |
|---|---|---|---|---|---|---|
| Whole China | 0.2889 | 0.2348 | 0.1495 | 0.2244 | 0.8881 | 0.4341 |
| Eastern region | 0.3249 | 0.2776 | 0.1628 | 0.2551 | 0.8909 | 0.4662 |
| Central region | 0.3218 | 0.2691 | 0.1626 | 0.2512 | 0.9000 | 0.4629 |
| Western region | 0.2509 | 0.1658 | 0.1082 | 0.1750 | 0.8646 | 0.3792 |
| Northeast region | 0.2158 | 0.2937 | 0.2630 | 0.2575 | 0.9534 | 0.4826 |
| T | 0.1154 | 0.1947 | 0.2937 | 0.1301 | 0.0434 | 0.0066 |
| Tw | 0.1057 | 0.1676 | 0.2594 | 0.1152 | 0.0385 | 0.0063 |
| Tb | 0.0097 | 0.0271 | 0.0343 | 0.0149 | 0.0049 | 0.0003 |
| Iw | 91.59% | 86.08% | 88.32% | 88.55% | 88.71% | 95.45% |
| Ib | 8.41% | 13.92% | 11.68% | 11.45% | 11.29% | 4.55% |
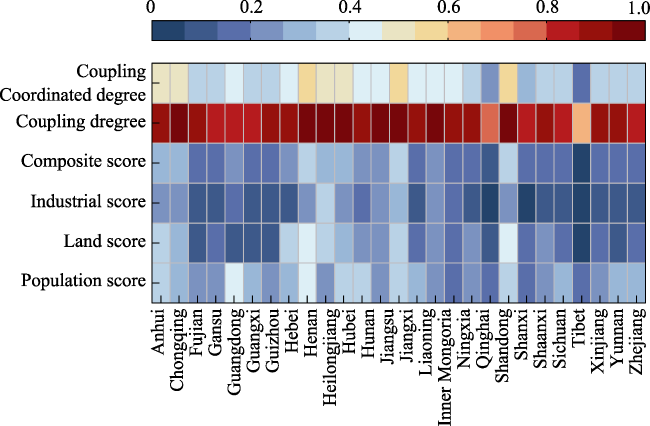
Figure 4 Development level of each element of rural population-land-industry in different provincial-level regions of China |
Table 4 q value and significance level of driving factors |
| X1 | X2 | X3 | X4 | X5 | X6 | |
|---|---|---|---|---|---|---|
| q statistic | 0.3380 | 0.4866 | 0.5029 | 0.0160 | 0.1184 | 0.0537 |
| p-value | 0.0000 | 0.0000 | 0.0000 | 0.0189 | 0.0000 | 0.0000 |
Table 5 Double-factor interaction detection results of driving factors |
| X1 | X2 | X3 | X4 | X5 | X6 | |
|---|---|---|---|---|---|---|
| X1 | 0.3380 | |||||
| X2 | 0.5694 | 0.4866 | ||||
| X3 | 0.5673 | 0.5256 | 0.5029 | |||
| X4 | 0.3971 | 0.5231 | 0.5340 | 0.0160 | ||
| X5 | 0.4177 | 0.5205 | 0.5358 | 0.1666 | 0.1184 | |
| X6 | 0.4243 | 0.5357 | 0.5517 | 0.1106 | 0.2000 | 0.0537 |
Note: |
Table 6 Ecological detection on influencing factors of rural population-land-industry coupling coordinated development level |
| X1 | X2 | X3 | X4 | X5 | X6 | |
|---|---|---|---|---|---|---|
| X1 | ||||||
| X2 | Y | |||||
| X3 | Y | N | ||||
| X4 | Y | Y | Y | |||
| X5 | Y | Y | Y | Y | ||
| X6 | Y | Y | Y | N | Y |
Note: Y indicates that the explanatory power of the two factors is different at the significance level of 95%, while N has the opposite meaning. |
Figure 5 Driving mechanism of influencing factors of the coupling coordinated development of rural population-land-industryNote: The area of the circle represents the magnitude of the determining force. |
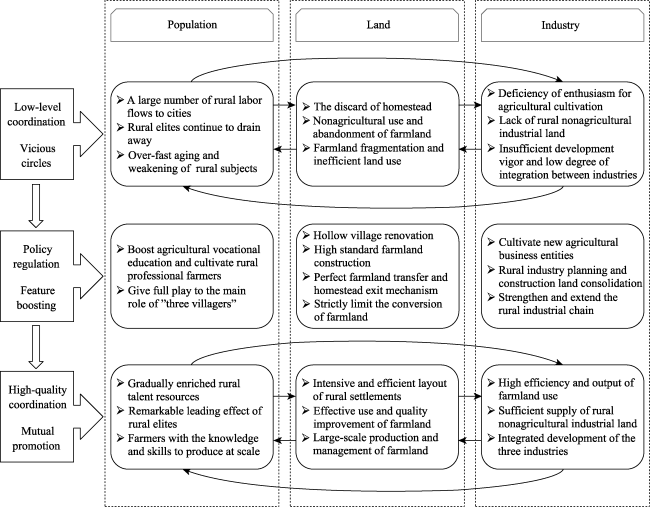
Figure 6 Mechanism of policy regulation for the coupling coordinated development of rural population-land- industry |
| [1] |
|
| [2] |
|
| [3] |
|
| [4] |
|
| [5] |
|
| [6] |
|
| [7] |
|
| [8] |
|
| [9] |
|
| [10] |
|
| [11] |
|
| [12] |
|
| [13] |
|
| [14] |
|
| [15] |
|
| [16] |
|
| [17] |
|
| [18] |
|
| [19] |
|
| [20] |
|
| [21] |
|
| [22] |
|
| [23] |
|
| [24] |
|
| [25] |
|
| [26] |
|
| [27] |
|
| [28] |
|
| [29] |
|
| [30] |
|
| [31] |
|
| [32] |
|
| [33] |
|
| [34] |
|
| [35] |
|
| [36] |
|
| [37] |
|
| [38] |
|
| [39] |
|
| [40] |
|
| [41] |
|
| [42] |
|
| [43] |
|
| [44] |
|
| [45] |
|
| [46] |
|
| [47] |
|
| [48] |
|
| [49] |
|
| [50] |
|
| [51] |
|
| [52] |
|
| [53] |
|
| [54] |
|
| [55] |
|
| [56] |
|
| [57] |
|
| [58] |
|
| [59] |
|
| [60] |
|
| [61] |
|
| [62] |
|
| [63] |
|
| [64] |
|
| [65] |
|
/
| 〈 |
|
〉 |
 Double-factor enhancement
  Double-factor nonlinear enhancement.
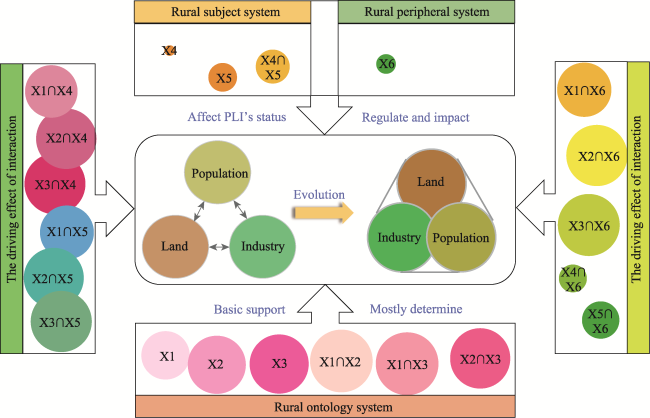