Research Articles

Quantify the impacts of climate variability and anthropogenic activities on runoff: With an improved double mass curve method

  • ZHOU Junju , 1, 3, 4 ,
  • XUE Dongxiang , 2, * ,
  • YANG Lanting 1 ,
  • LIU Chunfang 3, 4, 5 ,
  • WEI Wei 1, 3, 4 ,
  • YANG Xuemei 6 ,
  • ZHAO Yaru 7
Expand
  • 1. College of Geography and Environmental Science, Northwest Normal University, Lanzhou 730070, China
  • 2. College of Earth and Environment Sciences, Lanzhou University, Lanzhou 730000, China
  • 3. Gansu Engineering Research Center of Land Utilization and Comprehension Consolidation, Lanzhou 730070, China
  • 4. Key Laboratory of Resource Environment and Sustainable Development of Oasis, Gansu Province, Lanzhou 730070, China
  • 5. College of Social Development and Public Administration, Northwest Normal University, Lanzhou 730070, China
  • 6. Tourism School, Lanzhou University of Arts and Science, Lanzhou 730000, China
  • 7. Institute of Geology and Geophysics, CAS, Beijing 100029, China
* Xue Dongxiang (1993-), E-mail:

Zhou Junju (1972-), Associate Professor, specialized in climate and land use/cover change and ecohydrology. E-mail:

Received date: 2022-06-21

  Accepted date: 2023-07-19

  Online published: 2023-11-15

Supported by

National Natural Science Foundation of China(42361005)

National Natural Science Foundation of China(41861034)

National Natural Science Foundation of China(41661040)

National Natural Science Foundation of China(32060373)

Abstract

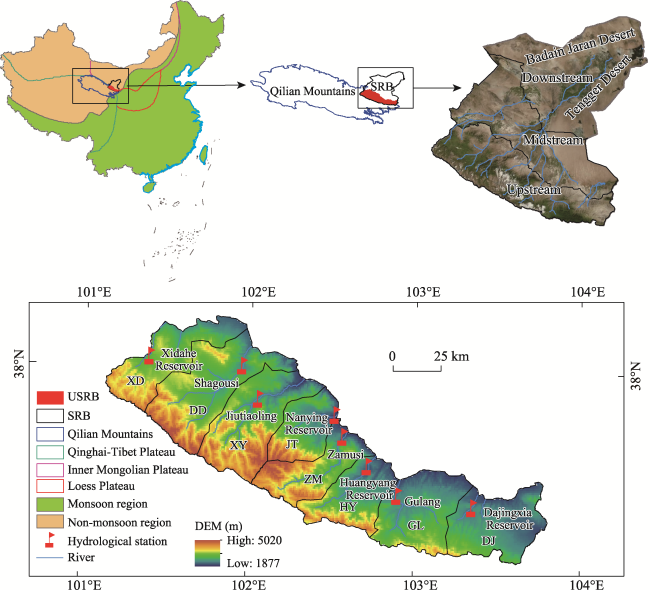
Quantitative assessments of the impacts of climate change and anthropogenic activities on runoff help us to better understand the mechanisms of hydrological processes. This study analyzed the dynamics of mountainous runoff in the upper reaches of the Shiyang River Basin (USRB) and its sub-catchments, and quantified the impacts of climate change and human activities on runoff using the improved double mass curve (IDMC) method, which comprehensively considers the effects of precipitation and evapotranspiration on runoff, instead of only considering precipitation as before. The results indicated that the annual runoff depth in the USRB showed a slightly increased trend from 1961 to 2018, and sub-catchments were increased in the west and decreased in the east. The seasonal distribution pattern of runoff depth in the USRB and its eight sub-catchments all showed the largest in summer, followed by autumn and spring, and the smallest in winter with an increasing trend. Quantitative assessment results using the IDMC method showed that the runoff change in the USRB is more significantly affected by climate change, however, considerable differences are evident in sub-catchments. This study further developed and improved the method of runoff attribution analysis conducted at watershed scale, and these results will contribute to the ecological protection and sustainable utilization of water resources in the USRB and similar regions.

Cite this article

ZHOU Junju , XUE Dongxiang , YANG Lanting , LIU Chunfang , WEI Wei , YANG Xuemei , ZHAO Yaru . Quantify the impacts of climate variability and anthropogenic activities on runoff: With an improved double mass curve method[J]. Journal of Geographical Sciences, 2023 , 33(11) : 2237 -2256 . DOI: 10.1007/s11442-023-2174-y

1 Introduction

In relation to the context of global climate warming and intensified human activities, the spatiotemporal characteristics of runoff have changed significantly, directly affecting the development, allocation, utilization, and management of water resources in the catchment (Qin et al., 2019; Zhang et al., 2020). Runoff in most of the world has shown a downward trend (Huntington, 2006; Li and Feng, 2007; Ma et al., 2008; Zheng et al., 2009; Fenta et al., 2017; Han et al., 2019), which may result in a water supply crisis, however, some areas have shown an increasing trend (Wang et al., 2013; Yang et al., 2017). This indicates that climate change and anthropogenic activities have regional and scale effects on hydrological processes (Dong et al., 2015; Berihun et al., 2019). Quantifying the impact of climate change and anthropogenic activities on runoff at different temporal and spatial scales is the basis and premise of managing scientific water resources and enhancing the response to global change. Therefore, the attribution analysis of runoff changes under changing environments has become the focus of watershed eco-hydrological research.
The combined effects of climate change and anthropogenic activities make runoff changes vary in different regions (Zhang et al., 2011; Hou and Gao, 2019; Wang et al., 2021). The Intergovernmental Panel on Climate Change (IPCC) fifth climate change assessment report highlighted that almost all regions of the world have experienced a warming process in the past half century, and the fastest warming region is in the mid-latitudes of the Northern Hemisphere (IPCC, 2013). Global warming leads to the retreat of glaciers, which directly changes the glacial runoff (Coles et al., 2017; Li et al., 2019), affects the precipitation process, and increases the frequency of extreme climate events. There is a large regional difference in its effects (Zhai et al., 2005; Ma et al., 2017; Wang et al., 2017), such as droughts and floods, which also further increases the uncertainty of runoff changes. In addition, global warming leads to changes in surface evapotranspiration (Gardner, 2009), but there are significant temporal and spatial differences in this effect, including the evapotranspiration paradox phenomenon (Peterson et al., 1995; Sun et al., 2007). Therefore, global warming is an important factor affecting runoff (Zhang et al., 2012); in particular, changes in precipitation and evapotranspiration directly affect the water production process of the basin, which in turn leads to the fluctuation in runoff. At the same time, anthropogenic activities such as deforestation, water project construction, agricultural irrigation, and urban construction are increasingly interfering with the runoff generation process. As the most active factor concerning the impact of anthropogenic activities on runoff (Zhai et al., 2005; Anache et al., 2018; Wang et al., 2019) and the most concentrated expression, LUCC profoundly affects the regional hydrological process and water resources mainly through affecting the processes of soil water infiltration, surface evapotranspiration, and vegetation interception and other processes, causing changes in the hydrological regime and runoff generation mechanism of the basin (Bracken and Croke, 2007; Wang et al., 2009). Within this context, quantitatively disentangling the impact of climate change and anthropogenic activities on runoff and identifying potential driving forces is of great significance for regional water resources management and sustainable development.
To date, the impacts of climate change and anthropogenic activities on runoff have been quantified using hydrological models, elastic coefficient methods and empirical statistics methods in different catchments located both at home and abroad (Kong et al., 2016; Ning et al., 2016; Chen et al., 2020; Darvini and Memmola, 2020; Ye et al., 2020; Xue et al., 2021). Christensen et al. (2004) used variable infiltration capacity model (VIC) to assess the potential impact of climate change on the water resources in the Colorado River Basin and found that the decreasing impacts of climate change on water resources in the future. Li et al. (2020) adopted the Soil and Water Assessment Tool (SWAT) to quantify the effects of climate variability and human activities on runoff in the Yihe River Basin in China. Although hydrological models based on physical processes have been applied at different time scales, there are limitations such as complex structure, time-consuming construction, demand for a large number of input data, and parameter uncertainty (Zhang et al., 2020; Dan et al., 2022; Wang et al., 2023). Multi-parameter elasticity method was used to assess water availability in a changing climate in Texas, USA (Brikowski, 2014). Yang et al. (2022) applied the elasticity coefficient method of Budyko hypothesis to quantify the effects of different driving forces on runoff in 64 watersheds in China and showed that runoff was more sensitive to precipitation and underlying surface parameter, the former was the dominant factor in the Northwest, Southwest, Yangtze, Southeast and Pearl River Basin, while the latter was the dominant factor in the Liaohe, Haihe, Yellow, Songhuajiang and Huaihe River basins. The elastic coefficient method is based on the elasticity coefficient of the nonparametric method (Sankarasubramanian et al., 2001) or Budyko formula (Xu et al., 2014) to distinguish the contributions of anthropogenic activities and climate change to runoff, but it requires an accurate estimation of the potential evapotranspiration, and the quantitative results have a large uncertainty. Cheng et al. (2019) used the double mass curve (DMC), the slope changing ratio of cumulative quantity (SCRCQ) and the Choudhury-Yang equation (Budyko-CY) methods to separate the impacts of climate changes and anthropogenic activities on runoff in the Heihe River Basin. In contrast, empirical statistics are simpler to calculate, the parameters are easy to obtain, and the impact of climate change and human activities on runoff can be effectively identified (Li et al., 2020; Xue et al., 2021). Among them, the DMC method is widely used in separating the impacts of climate change and anthropogenic activities on runoff owing to the easy calculation and simple operation of the method (Wei and Zhang, 2010; Li et al., 2016; Wu et al., 2017; Wang et al., 2019; Wu et al., 2020; Zhang et al., 2020).
The principle operation of the DMC method is dividing the runoff change time series into two periods: a natural reference period with little human activity influence (the baseline period) and a variation period with high human activity influence (the variation period). Based on the cumulative linear relationship between precipitation and runoff in the baseline period, the runoff only affected by climate change in the variation period can be calculated, and then the contribution of anthropogenic activities to runoff change was calculated. However, when using this method, we found the following shortcomings: when constructing the linear relationship between climate factors and runoff accumulation in the baseline period, we only considered the factor of precipitation. In fact, runoff is the result of the balance between precipitation and evapotranspiration, therefore, it is necessary to comprehensively consider the impacts of the two factors on runoff, especially in those regions where evapotranspiration has considerably changed during the runoff change in the context of global warming. Therefore, based on the principle of water balance, this study introduces the concept of Effective Precipitation (Pe, the value of precipitation minus the value of actual evapotranspiration, Pe = P-ET) (Wei and Zhang, 2010) to improve this method. On this basis, the contributions of climate change and anthropogenic activities on runoff changes are further quantified. This is the main innovation of this article.
The Shiyang River Basin (SRB) is located at the intersection of the Qinghai-Tibet Plateau, the Inner Mongolian Plateau, and the Loess Plateau, and is located at the edge of monsoon and non-monsoon regions, which are very sensitive to global climate change (He et al., 2019; Zhou et al., 2019). It has one of the most prominent water and soil contradictions and the most serious ecological and environmental problems of inland rivers in China. As the water resource conservation area of the entire SRB, the upstream mountainous area is a typical ecologically fragile area, providing more than 95% of the freshwater resources to the basin (Cheng et al., 2014), which supports the production and survival of the Wuwei and Minqin oases located in the middle and lower reaches of the area. Under the combined effects of global warming and human activities, the overall upstream runoff has shown a decreasing trend (Cheng et al., 2016; Yang et al., 2016), posing a great threat to the sustainable development of the ecology and socio-economy in the middle and lower reaches of the basin. Some scholars have attempted to analyze the influencing factors of mountainous runoff in the entire USRB or in one or more sub-catchments (Ma et al., 2008; He et al., 2019). However, because of the significant differences between the east and west sub-catchments in the USRB, the dynamics and impact factors of mountainous runoff in eight sub-catchments are very different. Therefore, based on the IDMC method, the effects of climate change and anthropogenic activities on runoff in the eight sub-catchments in the USRB are quantitatively analyzed in this study.
The main research contents include: (1) analyzing the variation dynamics of runoff in the USRB and its sub-catchments over a period of nearly 60 years; (2) quantitatively assessing the impacts of climate change and anthropogenic activities on runoff in the USRB and its sub-catchments; (3) exploring the impact mechanisms of climate change and anthropogenic activities on runoff in different sub-catchments. This study provides a basis for the scientific management and sustainable development of regional water resources in the arid inland river basin.

2 Materials and methods

2.1 Study area descriptions

The USRB is located on the northern slope of the eastern section of the Qilian Mountains on the northeastern edge of the Qinghai-Tibet Plateau (101°41'E and 103°48'E, 36°29'N and 38°18'N). The terrain descends from south to north with an elevation ranging from 1877 to 5020 m above sea level, and it covers approximately 1.15×10⁴ km2. From east to west, it consists of eight sub-catchments: DJ, GL, HY, ZM, JT, XY, DD, and XD (Figure 1). The average annual runoff in the USRB was 13.38×10⁸ m3 between 1960 and 2018. In the sub-catchments, the average annual runoff of the XY was the largest at 3.21× 10⁸ m3, followed by DD (3.07×10⁸ m3), ZM (2.36×10⁸ m3), XD (1.60×10⁸ m3), JT (1.32×10⁸ m3), HY (1.28×10⁸ m3), GL (0.65×10⁸ m3), and the smallest was the DJ (0.11×10⁸ m3).
Figure 1 Location of the study area (upper reaches of the Shiyang River Basin)
The main water source of the runoff is precipitation, and glacier meltwater accounted for only 3.7% (Yang et al., 1991). The climate is alpine semi-humid and semi-arid, with an average annual temperature ranging from -0.5 to 2.0℃, the annual precipitation from 300 to 600 mm, the annual potential evapotranspiration from 800 to 1100 mm, and the annual actual evapotranspiration from 100 to 250 mm. As the main runoff generation area for the entire basin, the upstream directly affects the sustainable development of the socio-economy in the middle and downstream regions.

2.2 Data collection and processing

The data used in this study mainly included runoff observation, meteorological, land-use, and socio-economic data.
The monthly runoff data for the eight sub-catchments in the USRB from 1961 to 2018 were obtained from the Water Resources Management Bureau of Shiyang River Basin (Table 1). Because the area and the runoff of each sub-catchment varied considerably, in order to facilitate comparison, the runoff depth (runoff/catchment area) was used to analyze the runoff change.
Table 1 Longitude, latitude, and elevation of the hydrological stations in the upper reaches of the Shiyang River Basin
Catchments Hydrological station Latitude
(°N)
Longitude
(°E)
Elevation
(m)
T
(℃)
P
(mm)
Ep
(mm)
XD Xidahe Reservoir 38°03'00" 101°22'59" 2880 1.29 439.20 982.39
DD Shagousi 38°01'00" 101°57'00" 2360 0.69 475.59 953.87
XY Jiutiaoling 37°52'00" 102°3'00" 2270 -0.45 528.41 889.66
JT Nanying Reservoir 37°48'00" 102°31'00" 1940 0.62 478.91 926.73
ZM Zamusi 37°42'00" 102°34'00" 2010 1.20 440.24 951.62
HY Huangyang Reservoir 37°34'00" 102°43'00" 2070 0.47 442.03 897.04
GL Gulang 37°25'59" 102°54'00" 2072 0.75 409.42 889.54
DJ Dajingxia Reservoir 37°22'59" 103°21'00" 2175 3.38 320.54 1003.96

Note: The time period of the mean values of T, P, and Ep is from 1961 to 2018.

Meteorological data were obtained from the China Surface Temperature/Precipitation Monthly Value 0.5° × 0.5° Grid Data Set (V2.0) of the China Meteorological Data Network (http:// data.cma.cn). Based on the meteorological data of 2472 national surface meteorological stations in China, the Thin Plate Spline method (TPS) was used to establish the precipitation and temperature grid data with a horizontal resolution of 0.5°×0.5° in China since January 1961.
Land-use data were derived from the Institute of Geographic Sciences and Natural Resources Research, Chinese Academy of Sciences (http://www.dcres.cn) and were obtained by visual interpretation based on 7 phases of American Landsat/TM remote sensing image data (1990, 1995, 2000, 2005, 2010, 2015, and 2018), with orbit numbers 131-33, 132-33, 131-34, and 132-34. The spatial resolution was 30 × 30 m. According to the China Land Resources Classification System (Cheng, 2019), the second-level classification land-use types were first obtained through visual interpretation and then merged into the first-level classification, which included cultivated land, forest land, grassland, urban land, water area, and unused land. After the completion of the interpretation, the results were verified by field investigations, and they were modified and verified by topographic maps and high-resolution images at the same scale. The accuracy of the land-use data was greater than 90%, which met our research requirements.
Socio-economic data included population data (1990, 1995, 2000, 2005, 2010, 2015, and 2018), water consumption data (1995-2010), gross domestic product (GDP), and effective irrigation area data, all of which were obtained from the statistical yearbooks for all counties and districts in the city of Wuwei.

2.3 Methodology

2.3.1 Mann-Kendall trend analysis

The Mann-Kendall test method (M-K) was developed by Mann and Kendall and is an undistributed test. It does not require the sample to follow a certain distribution, and the test results are basically not a small disturbance of outliers. It is recommended by the World Meteorological Organization and has been widely adopted to test the trend changes in hydrological and meteorological factors such as precipitation, temperature, and runoff (Fenta et al., 2017; He et al., 2017, 2019b). In this study, it was mainly used to test the change trend of runoff.

2.3.2 Change point detection method

Numerous methods are used to detect abrupt change points of climate factors and runoff, such as the Mann-Kendall mutation test, the ordered clustering method, the DMC method and the cumulative anomaly method (Zhou et al., 2021). In this study, the cumulative anomaly method was used to identify the runoff break points. The formula is as follows (Pan et al., 2021):
${{X}_{t}}=\underset{i=1}{\overset{t}{\mathop \sum }}\,\left( {{x}_{i}}-\bar{x} \right),t=1,2,3,...,n$
where Xt is the cumulative anomaly value of the runoff sequence X in the t year, xi represents the value of the runoff in the i year, $\bar{x}$ represents the average value of the runoff sequence, and n is the sequence length.

2.3.3 Improvement of the double mass curve (IDMC)

The DMC method was proposed by the American scholar Merriam in 1937 (Merriam, 1937) and has been widely used in the research to test hydro-meteorological data consistencies owing to its simplicity, intuitiveness, and practicality (Mostowik et al., 2019; Pirnia et al., 2019; Wang et al., 2019a, 2019b; Zhang et al., 2020a). With this method, the continuous cumulative values of precipitation and runoff in the same period are taken as the two axes of the coordinate system. When the hydrological sequence changed abruptly, the slope of the cumulative curve changed significantly prior to and following the abrupt change. In the baseline period, the cumulative runoff depth ($\mathop{\sum }^{}R$) and cumulative precipitation ($\mathop{\sum }^{}P$) present the following linear relationship:
$\mathop{\sum }^{}R=a\mathop{\sum }^{}P+b$
where a and b are regression coefficients and constants, respectively.
The model establishment and application steps we employed were as follows: firstly, the least squares method was used to determine a and b, and the regression model of cumulative precipitation and cumulative runoff depth in the baseline period was established. Then, the cumulative precipitation in the variation period was introduced into the abovementioned model to calculate the cumulative runoff depth under the influence of climate change, thereby separating the contribution rates of anthropogenic activities and climate change to the runoff (Figure 2).
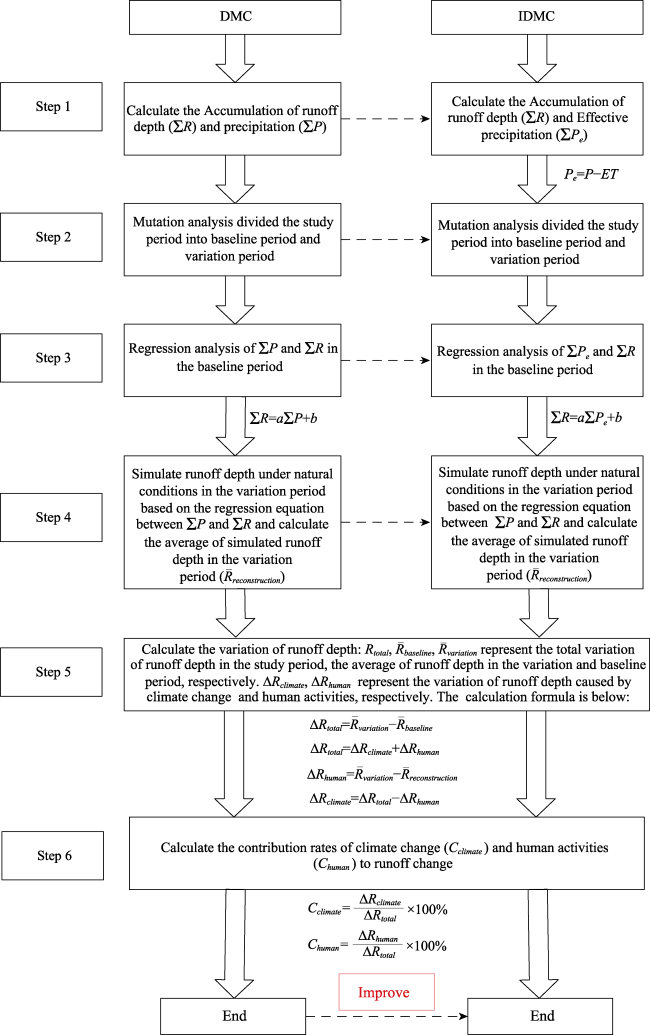
Figure 2 Improvement steps of the DMC method
It is worth noting that although runoff originates from precipitation, in fact, the process of runoff generation is affected not only by the precipitation process, but also by the evapotranspiration process. This process follows the principle of water balance. Figures S1a and S1b show that the average annual temperature and annual precipitation, annual potential evapotranspiration, and actual evapotranspiration in the USRB increased from 1961 to 2018, with increasing rates of 0.03°C/a, 0.93 mm/a, 1.17 mm/a, and 0.19 mm/a, respectively. In addition, it can be observed that the evapotranspiration fluctuated in a downwards trend before the 1990s, and subsequently fluctuates upwards. Therefore, we must consider the actual evapotranspiration when establishing the runoff response model for climate change in the baseline period. The calculation of evapotranspiration is presented in the Supplementary materials. Moreover, under the influence of global warming, the evapotranspiration changes significantly in different periods (such as prior to and following abrupt changes in runoff). When only considering precipitation to establish a response model of climate change and runoff in the baseline period, it is not accurate to simulate the impact of climate change on runoff in the variation period. Therefore, the method was improved in this study: we established a cumulative response model of Pe and runoff depth in the baseline period and used the model to simulate the runoff depth that was only affected by climate change in the variation period, and then we quantitatively distinguished the contributions of climate change and anthropogenic activities to runoff. The specific process is presented in Figure 2.
Three calculation results for the IDMC method were obtained: when the value of Cclimate∈(0, 100%) and Chuman∈(0, 100%), this indicates that climate change and anthropogenic activities affect runoff in the same direction. When the value of Cclimate ∈(100%, +∞) and Chuman∈(-∞, 0), this indicates that runoff changes are mainly determined by climate change, and climate change promotes runoff changes, while anthropogenic activities hinder runoff changes. When Cclimate∈(-∞, 0) and Chuman∈(100%, +∞), this indicates that anthropogenic activities play a key role in the runoff change and promote the runoff change, while climate change has the opposite effect.

3 Results

3.1 The inter-annual variation in runoff depth

Figures 3a and S2 show that the changes in runoff depth in the sub-catchments of the USRB are quite different. The overall annual average runoff depth in the USRB was 157.33 mm from 1961 to 2018. In the sub-catchments, the annual average runoff depth of XD was the largest (258.74 mm), followed by XY (248.47 mm), ZM (219.62 mm), DD (183.25 mm), JT (148.96 mm), HY (121.59 mm), GL (66.81 mm), and the minimum annual runoff depth for DJ was 9.75 mm. From the perspective of change trends, the runoff depth in the USRB showed a slight increase from 1961 to 2018, with an increased rate of 0.03 mm/a. XD, DD, XY and ZM showed increasing trends, with the change tendency rates of 0.68, 0.33, 0.07, and 0.14 mm/a, respectively, and this was significant in both XD and DD (p < 0.05). JT, HY, GL and DJ showed decreasing trends, with change tendency rates of -0.33, -0.12, -0.41, and -0.12 mm/a, respectively, and the decreasing trends of GL and DJ were significant (p < 0.05). Therefore, the runoff depth in the USRB showed a slightly increasing trend from 1961 to 2018, and the change trend of runoff in the sub-catchments showed an increase in the west and a decrease in the east.
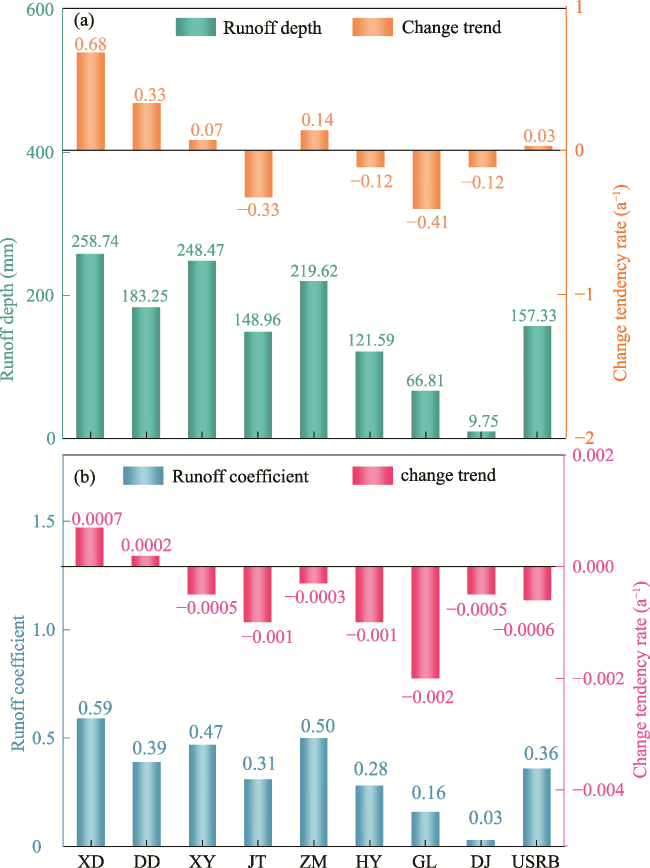
Figure 3 The average of runoff depth and change trend in the upper reaches of the Shiyang River Basin (USRB) and its sub-catchments from 1961 to 2018 (a); runoff coefficient and change trend in the USRB and its sub-catchments from 1961 to 2018 (b)
We further analyzed the changes in runoff coefficients in the USRB and its sub-catchments from 1961 to 2018. The results showed that the multi-year average of the runoff coefficient in the USRB was 0.36 and there was a downward trend, indicating that the capacity of runoff yield had become weakens over the past six decades in the study area. In the sub-catchments, XD had the highest water yield capacity (0.59), followed by ZM (0.50) and XY (0.47), and the DJ had the lowest (0.03). From the perspective of change trends, it can be observed that only XD and DD increased their runoff capacities, while the other sub-catchments decreased theirs. Therefore, although the runoff depth in the USRB showed a slightly increased trend, the water yield capacity reduced over the past six decades.

3.2 The seasonal variation in runoff depth

The seasonal distribution pattern of runoff depth in the USRB presented the highest value in summer, followed by autumn and spring, and the lowest in winter (Figure S3). Among them, the runoff depth for DD showed an increasing trend in the four seasons, a decreasing trend of runoff depth occurred only in spring in XD, and an increasing trend of runoff depth in winter in all the sub-catchments. The seasonal change trend of runoff depth in the USRB declined in spring and summer and increased in autumn and winter (Figure 4). Therefore, the trends were not completely consistent with those exhibited by the other seasons, except for the increasing trend in winter in the eight sub-catchments.
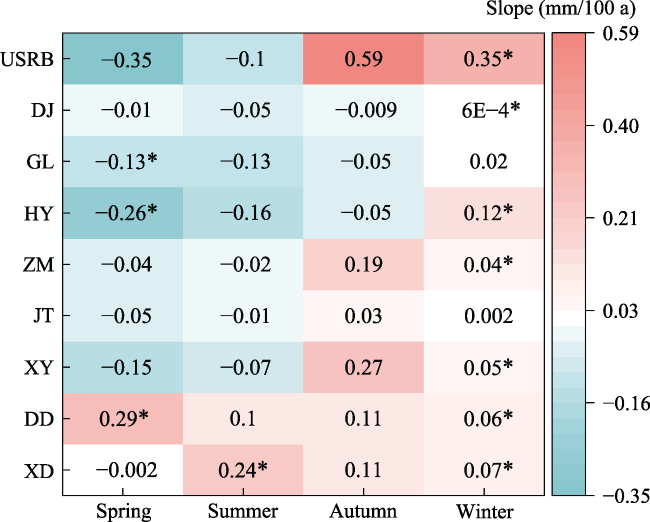
Figure 4 Seasonal variation trend of runoff depth in the upper reaches of the Shiyang River Basin and its sub-catchments from 1961 to 2018 (* indicates that the test has passed the significance level of 0.05)

3.3 Attribution of climate change and anthropogenic activities to runoff

3.3.1 Determination of the baseline period

The test results of the cumulative anomaly method show that the abrupt changes in the runoff depths of XD, DD, XY, ZM, and USRB occurred in 2002, the mutation point of JT occurred in 1990, HY and GL mutation points appeared in 1994, and that of DJ occurred in 2004 (Figure 5). Therefore, the period 1961-2002 was determined as the baseline period of the runoff depth change in the USRB. In the sub-catchments, the baseline period of XD, DD, XY and ZM was 1961-2002, JT was 1961-1990, HY and GL were 1961-1994, and DJ was 1961-2004.
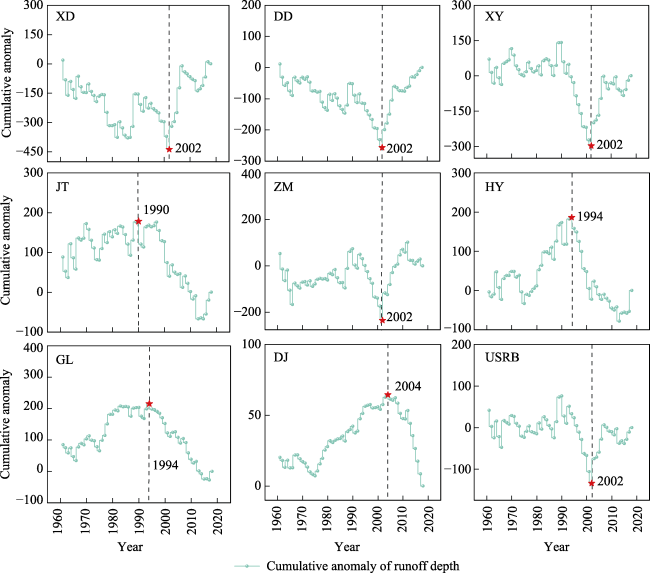
Figure 5 Detection of breakpoints based on the cumulative anomaly method in the upper reaches of the Shiyang River Basin and its sub-catchments from 1961 to 2018

3.3.2 Attribution recognition of runoff change

Based on the IDMC method, the attribution calculation of runoff changes in the USRB and its sub-catchments conducted, and the results were shown in Table 2.
Table 2 The contributions of climate change and anthropogenic activities to runoff change in the upper reaches of the Shiyang River Basin and its sub-catchments calculated using the IDMC method
Catchment Baseline
period
Variation
period
Rtotal
(mm)
Rclimate
(mm)
Rhuman
(mm)
Cclimate
(%)
Chuman
(%)
XD 1961-2002 2002-2018 37.81 36.46 1.35 96.43 3.57
DD 1961-2002 2002-2018 19.73 18.11 1.62 91.78 8.22
XY 1961-2002 2002-2018 23.17 23.48 -0.32 101.37 -1.37
JT 1961-1990 1990-2018 -12.31 0.21 -12.52 -1.68 101.68
ZM 1961-2002 2002-2018 20.30 31.86 -11.56 156.94 -56.94
HY 1961-1994 1994-2018 -13.23 10.40 -23.62 -78.64 178.64
GL 1961-1994 1994-2018 -13.78 7.47 -21.25 -54.25 154.25
DJ 1961-2004 2004-2018 -3.41 1.49 -4.90 -43.54 143.54
USRB 1961-2002 2002-2018 11.61 21.06 -9.45 181.45 -81.45

Note: The “-” in the change amount indicates that the runoff is reduced; the “-” in the contribution rate means that the impact of climate change or anthropogenic activities on runoff is opposite to the actual change in runoff.

The results showed that the runoff depth change in the USRB was mainly affected by climate change (accounting for 181.45%). In the sub-catchments, the increase in runoff depth in XD, DD, XY, and ZM were mainly attributed to climate change, while anthropogenic activities played a dominant role in the reduction in runoff depth in JT, HY, GL, and DJ. In the sub-catchments that were more affected by climate change, climate change and anthropogenic activities presented the same direction effect on runoff changes in XD and DD, while climate change and anthropogenic activities presented an opposite direction effect on runoff change in XY and ZM. The contribution of anthropogenic activities to runoff change was only -1.37% in XY, which was the sub-catchment least affected by anthropogenic activities and closest to the natural state. Anthropogenic activities have completely changed the runoff states in the four eastern sub-catchments, especially in HY, where the contribution of anthropogenic activities to runoff change was the greatest (178.64%). Therefore, the decrease in runoff depth in the western sub-catchments in the USRB was caused by human activities.

4 Discussion

4.1 The impact of climate change on runoff

Precipitation and evapotranspiration are the two main climatic factors affecting runoff. Pe was selected as a comprehensive climate index to analyze the impact of climate change on runoff. The relationship between Pe and runoff depth is shown in Figure 6.
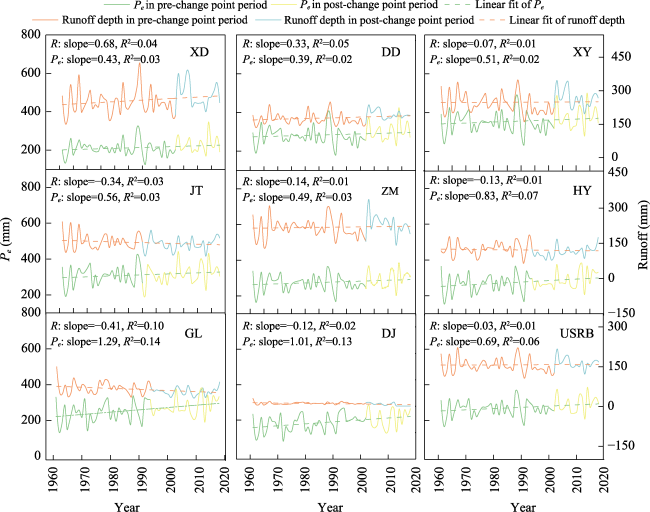
Figure 6 Relationship between Pe and runoff depth in the upper reaches of the Shiyang River Basin and its sub-catchments from 1961 to 2018
The values of Pe all showed an increasing trend in the USRB and its eight sub-catchments from 1961 to 2018 (Figure 6). The increase rate of Pe in GL was the highest, with a value of 1.29 mm/a, followed by DJ (1.01 mm/a), HY (0.83 mm/a), JT (0.56 mm/a), XY (0.51 mm/a), ZM (0.49 mm/a), XD (0.43 mm/a), and DD presented the lowest increase rate of 0.39 mm/a. In other words, the increase rates of Pe in the three eastern sub-catchments were much higher than those in the five western sub-catchments, but the rapid increase in Pe did not increase runoff. This indicated that the decrease in runoff in the eastern sub-catchments was obviously influenced by human activities, especially after mutation. The increase in Pe in the western sub-catchments was in great agreement with the change in runoff depth, which showed a very synchronous increasing trend, particularly after mutation.

4.2 The impact of anthropogenic activities on runoff

LUCC is an important component of anthropogenic activities driving global environmental changes and is one of the most important human activity factors affecting runoff (Zhai et al., 2017; Anache et al., 2018; Wang et al., 2019a). It is also a comprehensive reflection of human activities.

4.2.1 The differences in anthropogenic activities in the sub-catchments of the USRB

The proportion of construction and cultivated land (PCC) and population density (PD) can directly reflect the intensity of human activities. Therefore, the PCC and PD were used to analyze the differences in human activity in the eight sub-catchments.
It can be observed from Figure 7 that the PCC and PD in the three eastern sub-catchments (HY, GL, and DJ) are much larger than the other sub-catchments, which indicated that anthropogenic activities are mainly found in the eastern sub-catchments. Among the three eastern sub-catchments, HY had the largest PD, and GL had the largest PCC, therefore, anthropogenic activities performed in HY and GL were greater than in DJ. In the five western sub-catchments, XY had the smallest PCC and PD, with values of 1.85% and 1.96 person/km2, respectively. In addition to the results presented in Table 2, it can be observed that excessive human activity is the root cause of runoff reduction. Therefore, in the future development process of the basin, social and economic developments should be based on the carrying capacity of regional water resources and guarantee of ecological improvements. Water resources cannot be blindly overused, otherwise it will inevitably lead to the deterioration of the ecological environment of the basin and form a vicious circle of water resource shortages.
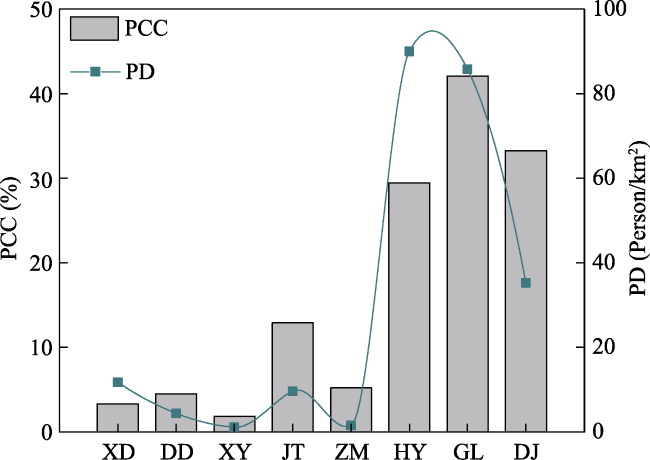
Figure 7 Variations in PCC and PD in the sub-catchments of the upper reaches of the Shiyang River Basin

4.2.2 The impact of anthropogenic activities on runoff in the eastern sub-catchments

Based on the analysis above, anthropogenic activities were found to be weak in the western sub-catchments, while they were strong in the eastern sub-catchments. Therefore, the impact of anthropogenic activities on runoff in the three eastern sub-catchments (HY, GL, and DJ) was emphasized in this study.
GL and DJ are located in Gulang county, and the area above the HY hydrological station is mainly in Tianzhu county. According to the statistics, the population of Gulang and Tianzhu counties increased from 163,600 and 100,000 in 1962 to 390,800 and 175,400 in 2018, up by 138.88% and 75.4%, respectively, which means a dramatic increase in domestic water consumption (Figure 8). In addition, the GDP values for Gulang and Tianzhu counties increased from 33 and 31 million yuan in 1980 to 5.106 and 4.791 billion yuan in 2018, respectively, and the GDP increased 154.73 and 154.55 times, which also reflected the rapid development of the socio-economy and the considerable increase in irrigation and industrial water consumption in the study area. It can be seen from Figure 8 that agricultural irrigation water use was above 75% both in Gulang and Tianzhu counties, which was similar to the research results obtained by Yang (2018) and Zhang et al. (2017). Irrigation districts were distributed close to hydrological stations in the three eastern sub-catchments (HY, GL and DJ), and agricultural irrigation water was mainly obtained from surface water. The increase in irrigation water was the main reason for the decrease in runoff.
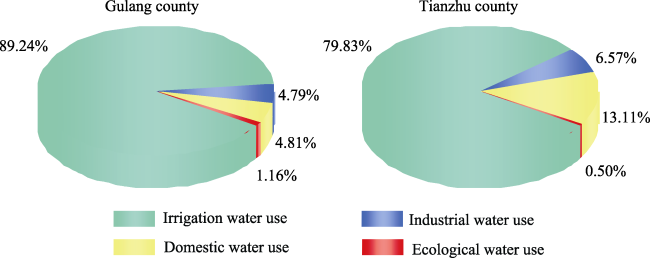
Figure 8 Water use structure of Gulang and Tianzhu counties
The total storage capacity of Shibalibao and Caojiahu reservoirs in the upper reaches of the Gulang River is 15.6 million m3, and the total length of the main and branch canals in the irrigation area is 243.5 km. Although these key structures were built in the 1960s, they were in a state of serious disrepair. In 1994, the reinforcement project of the Caojiahu Reservoir was enforced, and the reconstruction project of the Gufeng main canal in the Gulang River was completed. In recent years, with the gradual construction of channel projects at all levels, water conservancy facilities have been upgraded, and water diversion and irrigation capacities have been continuously improved. With the continuous improvement of irrigation conditions, the effective irrigation area in the Gufeng Irrigation District increased to 26,500 ha in 1994. The expansion of the irrigation area and increase in irrigation water consumption led to the decrease in mountainous runoff for GL, which mutated in 1994.
The HY Reservoir was built in 1960 with a total storage capacity of 56.44 million m3. The Zhangyi Irrigation District and Anyuan Irrigation District were built in 1984, and the main and branch canals measure 39.96 km. Most key projects were built in the 1970s and 1980s, and by the 1990s, a water conservancy project system with both storage and diversion was basically formed. Since then, the irrigation district has actively strived for new projects, raised funds in various ways to engage in irrigation and water conservancy construction, and constantly tamped the irrigation area water conservancy construction facilities. With the continuous improvement of irrigation conditions, the effective irrigation area increased to 42,900 ha in 1994. The increasing demand for irrigation water led to the continuous decrease in mountain runoff, and an abrupt change point occurred in 1994.
The Dajingxia Reservoir was built in the 1950s and 1960s, with a total storage capacity of 12.26 million m3. However, there are obvious quality problems in many water conservancy projects built during this period. Since 1974, the local government has uncovered numerous problems, learned lessons, and taken additional measures to address this issue. In the 1980s, 1990s, and early 21st century, irrigation channels with a total length of 127.8 km were built at all levels. Around 2004, the reconstruction project of the east-west main canal of DJ began, and the danger elimination and reinforcement project of the Dajingxia Reservoir was conducted. The construction of the Dajingxia Reservoir and its main and branch canals mainly served the Dajing Irrigation District. In 2004, the effective irrigation area of the district was as large as 104,400 ha. Excessive consumption of agricultural irrigation water decreased the runoff and mutated in 2004.
To sum up, with the continuous increase in the population, the rapid development of the socio-economy, and the gradual improvement of water conservancy facilities in the area, the development of agriculture had also caused the excessive consumption of water resources, resulting in the mutation and reduction of runoff, which had a significant influence on the ecological security and the sustainable development of the oases in the middle and lower reaches of the basin.

4.3 Advantages and uncertainties of the IDMC method

Comparing the calculation results achieved using the IDMC and DMC methods, we can found that the values of JT and ZM are quite different. This is mainly related to the fact that the DMC method only considers precipitation, while the change of runoff is the result of the combined effect of precipitation and evapotranspiration. The calculation results achieved by the DMC method show that both the climate change and human activities have a positive impact on runoff in JT, human activities play a decisive role in runoff change and climate change has a negative effect on runoff in ZM (Table S2). This obviously does not match the actual situation. According to the analyses presented in Sections 4.1 and 4.2, it can be observed that the effective precipitation increased, but runoff decreased in JT, which shows that the supplementary effect of precipitation on runoff has not altered the consumption of human activities on runoff. Both effective precipitation and runoff increase in ZM. Therefore, the results for the IDMC method are more in line with the actual situation (Table 2). In contrast, the IDMC method is more reasonable and accurate. However, long-term meteorological and hydrological data are required for this method, and the results are based on the accuracy of the dataset, so there is a certain degree of uncertainty. In addition, Wei and Zhang (2010) used this method to quantify the contribution of forest disturbance and climatic variability on streamflow in the Willow River watershed in a temperate continental climate in central British Columbia, Canada. Therefore, this method has great application potential in distinguishing the impact of climate change and human activities on hydrological processes.

5 Conclusions

This paper improved the traditional DMC method, and quantitatively evaluated the impacts of climate change and anthropogenic activities on runoff in the eight sub-catchments of the USRB. The variation trend of runoff was quite different in sub-catchments of the USRB from 1961 to 2018. On an annual scale, the runoff depth in the USRB showed a slightly increasing trend, and the spatial distribution of runoff depth in the sub-catchments showed a trend of increasing in the west and decreasing in the east. Quantitative assessment results using the IDMC method indicate that climate change plays a decisive role in runoff in XD, DD, XY, and ZM, while anthropogenic activities have a considerable impact on the runoff reduction in JT, HY, GL, and DJ. This reduction in runoff in the sub-catchments in USRB will threaten the eco-hydrological safety and the sustainable development of oases located in the middle and lower reaches of the area. Therefore, the differences among sub-catchments should be fully considered in the governance of the upstream area in the future. In sub-catchments with less human activities, the protection of grassland and forest should be strengthened to increase water conservation capacity. In sub-catchments with stronger human activity, agricultural planting structures should be adjusted, public water saving awareness should be raised, and water saving irrigation technology should be promoted, and thus improving water use efficiency. At the same time, the water diversion project should be continued to increase the amount of available water resources in the basin, and ensure the coordinated and sustainable development of the socio-economic-ecological conditions of the entire basin.

Data availability

Thanks to the Water Resources Management Bureau of Shiyang River Basin in China for providing measured runoff data (http://www.yrcc.gov.cn/). The meteorological data was provided by the China Meteorological Data Network (http://data.cma.cn). Land-use data were obtained from the Institute of Geographic Sciences and Natural Resources Research, Chinese Academy of Sciences (http://www.dcres.cn). Socioeconomic data were obtained from the statistical yearbooks for all counties and districts in the city of Wuwei.
Quantify the impacts of climate variability and anthropogenic activities on runoff: With an improved double mass curve method
ZHOU Junju1,3,4, *XUE Dongxiang2, YANG Lanting1, LIU Chunfang3,4,5, WEI Wei1,3,4, YANG Xuemei6, ZHAO Yaru7
1. College of Geography and Environmental Science, Northwest Normal University, Lanzhou 730070, China;
2. College of Earth and Environment Sciences, Lanzhou University, Lanzhou 730000, China;
3. Gansu Engineering Research Center of Land Utilization and Comprehension Consolidation, Lanzhou 730070, China;
4. Key Laboratory of Resource Environment and Sustainable Development of Oasis, Gansu Province, Lanzhou 730070, China;
5. College of Social Development and Public Administration, Northwest Normal University, Lanzhou 730070, China;
6. Tourism School, Lanzhou University of Arts and Science, Lanzhou 730000, China;
7. Institute of Geology and Geophysics, CAS, Beijing 100029, China

Calculation of evapotranspiration

(1) The calculation of potential evapotranspiration
Many studies at home and abroad have proved that Penman-Monteith (P-M) (Table S1 a) has good applicability and high accuracy in calculating potential evapotranspiration (ET0). Therefore, this method is widely used internationally and recommended by the Food and Agriculture Organization of the United Nations (FAO). However, P-M requires detailed meteorological data. In many areas, especially in mountainous areas, there are a few meteorological stations, and the effective meteorological data sequence is relatively short, which introduces certain difficulties into the accurate calculation of ET0 by P-M. There is only the Wushaoling Meteorological Station in the USRB, which cannot meet the calculating requirements of the P-M model for potential evapotranspiration. Later, the FAO also recommended the Hargreaves formula (H formula) to calculate the potential evapotranspiration for regions with fewer meteorological data (Table S1b), but much research has shown that it has overestimated or underestimated ET0 in different regions. Therefore, in order to calculate ET0 more accurately, the calculating process in this study was as follows: firstly, the potential evapotranspiration values ET0-PM and ET0-H of the Wushaoling Meteorological Station were calculated for the P-M model and the H formula, respectively, based on the daily meteorological data. Secondly, the regression model of ET0-PM and ET0-H was established (Table S1c), the t test method was carried out and there was no significant difference between the regression model and the P-M model (t = 0.179 < t0.05 = 6.87). Thirdly, based on the regression model established above, the potential evapotranspiration calculated by the H formula in the eight sub-catchments of the USRB was corrected to obtain the potential evapotranspiration with high accuracy.
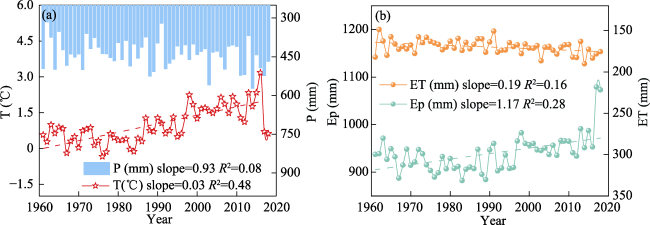
Figure S1 Annual temperature and precipitation in the upper reaches of the Shiyang River Basin (USRB) from 1961 to 2018 (a); Annual potential evapotranspiration and actual evapotranspiration in the USRB from 1961 to 2018 (b)
Table S1 The formula used to calculate potential evapotranspiration
Equation References
a $E{{T}_{0-PM}}=\frac{0.408\Delta {{R}_{n}}-G+\gamma \frac{900}{T+273}{{\mu }_{2}}\left( {{e}_{s}}-{{e}_{a}} \right)}{\Delta +\gamma 1+0.34{{\mu }_{2}}}$ (Allen-Wardell et al., 1998)
b $E{{T}_{0-H}}={{C}_{0}}{{R}_{a}}\left( \frac{{{T}_{min}}+{{T}_{min}}}{2}+17.8 \right)\times {{\left( {{T}_{\max }}-{{T}_{min}} \right)}^{1/2}}$, C0 =2.3×10⁻³ (Hargreaves and Allen, 2003)
c $E{{T}_{0-PM}}=0.404E{{T}_{0-H}}+0.493,\text{ }{{R}^{2}}=0.91$ This study
(2) The calculation of actual evapotranspiration
Actual evapotranspiration (ET) is the amount of water actually entering the atmosphere from the underlying surface (Liu et al., 2008), and it is an important part of the water balance in the watershed. The actual evapotranspiration is controlled by precipitation and evapotranspiration capacity (Sun et al., 2007), so the actual evapotranspiration can usually be calculated based on the potential evapotranspiration. This study used the water production module of the InVEST model to calculate the actual evapotranspiration. The calculation principle is based on the Budyko framework (Zhang et al., 2001), and the formula is as follows:
$\text{ET}=\frac{1+\omega \frac{E{{T}_{0}}}{P}}{1+\omega \frac{E{{T}_{0}}}{P}+{{\left( \frac{E{{T}_{0}}}{P} \right)}^{-1}}}*P$
$\text{ }\!\!\omega\!\!\text{ }=\text{Z}\frac{AWC}{P}$
where ET denotes the actual evapotranspiration, ET0 is the potential evapotranspiration, P is the precipitation, ω is the underlying surface parameter of the basin, AWC represents the effective water content of plants (mm), the value is determined by the soil texture and effective soil depth. Z is the Zhang coefficient, indicating the characteristics of precipitation in the basin, which vary in different regions. This study referred to the research results of Zhao et al. (2019), Z = 4.1.
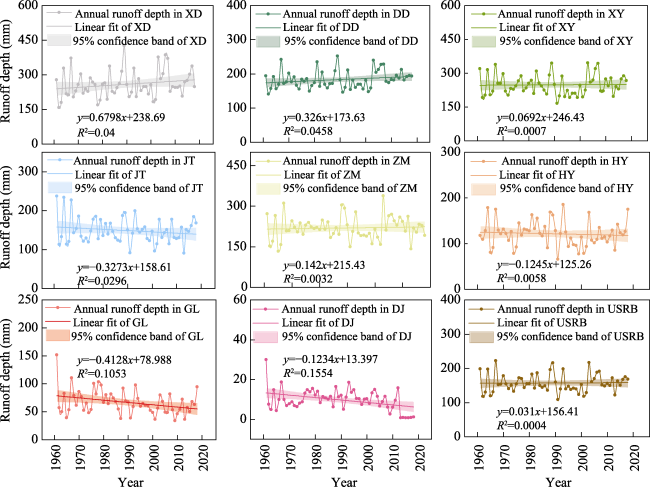
Figure S2 The inter-annual variation trend of runoff in the upper reaches of the Shiyang River Basin and its sub-catchments from 1961 to 2018
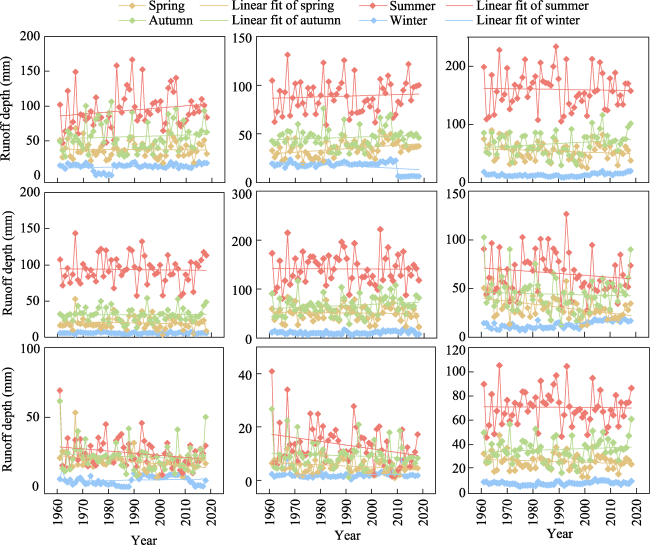
Figure S3 The seasonal variation trends of runoff in the upper reaches of the Shiyang River Basin and its sub-catchments from 1961 to 2018
Table S2 The contributions of climate change and anthropogenic activities to runoff in the upper reaches of the Shiyang River Basin and its sub-catchments calculated with the DMC method
Catchment Baseline
period
Variation
period
Rtotal
(mm)
Rclimate
(mm)
Rhuman
(mm)
Cclimate
(%)
Chuman
(%)
XD 1961-2002 2002-2018 37.81 30.70 7.10 81.21 18.78
DD 1961-2002 2002-2018 22.14 20.09 2.05 90.72 9.28
XY 1961-2002 2002-2018 23.17 24.21 -1.04 104.48 -4.48
JT 1961-1990 1990-2018 -9.21 -8.05 -1.15 87.44 12.56
ZM 1961- 2002 2002-2018 5.04 7.92 -12.94 -157.09 257.09
HY 1961- 1994 1994-2018 -8.37 7.31 -15.68 -87.28 187.28
GL 1961- 1994 1994-2018 -11.75 9.00 -20.76 -76.61 176.61
DJ 1961- 2004 2004-2018 -4.21 1.03 -5.24 -24.49 124.49
USRB 1961-2002 2002-2018 11.61 17.88 -6.27 154.09 -54.09

Note: The “-” in the change amount indicates that the runoff is reduced; the “-” in the contribution rate means that the impact of climate change or anthropogenic activities on runoff is opposite to the actual change in runoff.

References
Allen-Wardell G, Bernhardt P, Bitner R et al., 1998. The potential consequences of pollinator declines on the conservation of biodiversity and stability of food crop yields. Conservation Biology, 12(1): 8-17.
Hargreaves G H, Allen R G, 2003. History and evaluation of hargreaves evapotranspiration equation. Journal of Irrigation and Drainage Engineering, 129(1): 53-63.
Liu B, Ma Z, Feng J et al., 2008. The relationship between pan evapotranspiration and actual evapotranspiration in Xinjiang since 1960. Acta Geographica Sinica, 63(11): 1131-1139. (in Chinese)
Sun F, Yang D, Liu Z et al., 2007. Research on the water-heat coupling balance law of the Yellow River Basin based on Budyko hypothesis. Journal of Hydraulic Engineering, 367(4): 409-416. (in Chinese)
Zhang L, Dawes W R, Walker G R, 2001. Response of mean annual evapotranspiration to vegetation changes at catchment scale. Water Resources Research, 37(3): 701-708.
Zhao Y, Zhou J, Lei L et al., 2019. Identification of drivers factors for water yield in the upstream of Shiyang River based on InVEST model. Chinese Journal of Ecology, 38(12): 3789-3799. (in Chinese)
[1]
Anache J A A, Flanagan D C, Srivastava A et al., 2018. Land use and climate change impacts on runoff and soil erosion at the hillslope scale in the Brazilian Cerrado. Science of the Total Environment, 622/623: 140-151.

DOI

[2]
Berihun M L, Tsunekawa A, Haregeweyn N et al., 2019. Hydrological responses to land use/land cover change and climate variability in contrasting agro-ecological environments of the Upper Blue Nile Basin, Ethiopia. Science of the Total Environment, 689: 347-365.

DOI

[3]
Bracken L J, Croke J, 2007. The concept of hydrological connectivity and its contribution to understanding runoff-dominated geomorphic systems. Hydrological Processes, 21(13): 1749-1763.

DOI

[4]
Brikowski T H, 2014. Applying multi-parameter runoff elasticity to assess water availability in a changing climate: An example from Texas, USA. Hydrological Processes, 29(7): 1746-1756.

DOI

[5]
Chen Q, Chen H, Zhang J et al., 2020. Impacts of climate change and LULC change on runoff in the Jinsha River Basin. Journal of Geographical Sciences, 30(1): 85-102.

DOI

[6]
Cheng G, Li X, Zhao W et al., 2014. Integrated study of the water-ecosystem-economy in the Heihe River Basin. National Science Review, 1(3): 413-428.

DOI

[7]
Cheng Q P, Zuo X A, Zhong F L et al., 2019. Runoff variation characteristics, association with large-scale circulation and dominant causes in the Heihe River Basin, Northwest China. Science of the Total Environment, 688: 361-379.

DOI

[8]
Cheng W, 2019. The discussion about the land use classification system in ecological impact assessment. Environment and Development, 31(9): 17-18. (in Chinese)

[9]
Christensen N S, Wood A W, Voisin N et al., 2004. The effects of climate change on the hydrology and water resources of the Colorado River Basin. Climatic Change, 62: 337-363.

DOI

[10]
Coles A E, McConkey B G, McDonnell J J, 2017. Climate change impacts on hillslope runoff on the northern Great Plains, 1962-2013. Journal of Hydrology, 550: 538-548.

[11]
Dan D, Xi C, Zhou H J et al., 2022. Quantitative impacts of climate change and human activities on runoff in the Huolin River catchment. Journal of Water and Climate Change, 13(11): 3851-3866.

DOI

[12]
Darvini G, Memmola F, 2020. Assessment of the impact of climate variability and human activities on the runoff in five catchments of the Adriatic Coast of south-central Italy. Journal of Hydrology: Regional Studies, 31: 100712.

[13]
Dong L H, Xiong L H, Lall U et al., 2015. The effects of land use change and precipitation change on direct runoff in Wei River watershed, China. Water Science and Technology, 71(2): 289-295.

DOI PMID

[14]
Fenta A A, Yasuda H, Shimizu K et al., 2017. Response of streamflow to climate variability and changes in human activities in the semiarid highlands of northern Ethiopia. Regional Environmental Change, 17(4): 1229-1240.

DOI

[15]
Gardner L R, 2009. Assessing the effect of climate change on mean annual runoff. Journal of Hydrology, 379 (3/4): 351-359.

DOI

[16]
Han Z Y, Long D, Fang Y et al., 2019. Impacts of climate change and human activities on the flow regime of the dammed Lancang River in Southwest China. Journal of Hydrology, 570: 96-105.

DOI

[17]
He Y, Jiang X H, Wang N L et al., 2019a. Changes in mountainous runoff in three inland river basins in the arid Hexi Corridor, China, and its influencing factors. Sustainable Cities and Society, 50: 101703.

DOI

[18]
He Y, Qiu H J, Song J X et al., 2019b. Quantitative contribution of climate change and human activities to runoff changes in the Bahe River watershed of the Qinling Mountains, China. Sustainable Cities and Society, 51: 101729.

DOI

[19]
He Y, Wang F, Mu X M et al., 2017. Human activity and climate variability impacts on sediment discharge and runoff in the Yellow River of China. Theoretical and Applied Climatology, 129 (1/2): 645-654.

DOI

[20]
Hou W, Gao J, 2019. Simulating runoff generation and its spatial correlation with environmental factors in Sancha River Basin: The southern source of the Wujiang River. Journal of Geographical Sciences, 29(3): 432-448.

DOI

[21]
Huntington T G, 2006. Evidence for intensification of the global water cycle: Review and synthesis. Journal of Hydrology, 319 (1/4): 83-95.

DOI

[22]
Intergovernmental Panel on Climate Change IPCC, 2013. Climate Change 2013: The Physical Basis. Cambridge: Cambridge University Press,.

[23]
Kong D X, Miao C Y, Wu J W et al., 2016. Impact assessment of climate change and human activities on net runoff in the Yellow River Basin from 1951 to 2012. Ecological Engineering, 91: 566-573.

DOI

[24]
Li B F, Shi X, Lian L S et al., 2020. Quantifying the effects of climate variability, direct and indirect land use change, and human activities on runoff. Journal of Hydrology, 584: 124684.

DOI

[25]
Li J, Feng P, 2007. Runoff variations in the Luanhe River Basin during 1956-2002. Journal of Geographical Sciences, 17(3): 339-350.

DOI

[26]
Li Z W, Xu X L, Yu B F et al., 2016. Quantifying the impacts of climate and human activities on water and sediment discharge in a karst region of southwest China. Journal of Hydrology, 542: 836-849.

DOI

[27]
Li Z X, Yuan R F, Feng Q et al., 2019. Climate background, relative rate, and runoff effect of multiphase water transformation in Qilian Mountains, the Third Pole region. Science of the Total Environment, 663: 315-328.

DOI

[28]
Ma S M, Zhou T J, Stone D A et al., 2017. Detectable anthropogenic shift toward heavy precipitation over eastern China. Journal of Climate, 30 (4): 1381-1396.

DOI

[29]
Ma Z, Kang S, Zhang L et al., 2008. Analysis of impacts of climate variability and human activity on streamflow for a river basin in arid region of northwest China. Journal of Hydrology, 352 (3/4): 239-249.

DOI

[30]
Merriam C F, 1937. A comprehensive study of rainfall on the Susquehanna Valley. Eos Transactions American Geophysical Union, 18(2): 471-476.

DOI

[31]
Mostowik K, Siwek J, Kisiel M et al., 2019. Runoff trends in a changing climate in the Eastern Carpathians (Bieszczady Mountains, Poland). Catena, 182: 104174.

[32]
Ning T T, Li Z, Liu W Z, 2016. Separating the impacts of climate change and land surface alteration on runoff reduction in the Jing River catchment of China. Catena, 147: 80-86.

DOI

[33]
Pan B, Han M, Wei F et al., 2021. Analysis of the variation characteristics of runoff and sediment in the Yellow River within 70 years. Water Resources, 48(5): 676-689.

DOI

[34]
Peterson T C, Golubev V S, Groisman P Y, 1995. Evaporation losing its strength. Nature, 377(6551): 687-688.

[35]
Pirnia A, Golshan M, Darabi H et al., 2019. Using the Mann-Kendall test and double mass curve method to explore stream flow changes in response to climate and human activities. Journal of Water and Climate Change, 10(4): 725-742.

DOI

[36]
Qin P C, Liu M, Du L M et al., 2019. Climate change impacts on runoff in the upper Yangtze River basin. Climate Change Research, 15(4): 405-415.

[37]
Sankarasubramanian A, Vogel R M, Limbrunner J F, 2001. Climate elasticity of streamflow in the United States. Water Resources Research, 37(6): 1771-1781.

DOI

[38]
Sun F, 2007. Study on Watershed Evapotranspiration Based on Budyko Hypothesis. Beijing: Tsinghua University. (in Chinese)

[39]
Wang D D, Yu X X, Jia G D et al., 2019a. Sensitivity analysis of runoff to climate variability and land-use changes in the Haihe Basin mountainous area of north China. Agriculture, Ecosystems and Environment, 269: 193-203.

DOI

[40]
Wang G S, Xia J, Che J, 2009. Quantification of effects of climate variations and human activities on runoff by a monthly water balance model: A case study of the Chaobai River basin in northern China. Water Resources Research, 45(7): 1-12.

[41]
Wang H J, Chen Y N, Li W H et al., 2013. Runoff responses to climate change in arid region of northwestern China during 1960-2010. Chinese Geographical Science, 23(3): 286-300.

DOI

[42]
Wang H X, Ma Y C, Yang H et al., 2023. Quantitative evaluation of the impact of climate change and human activities on Jialing river runoff changes in the past 60 years, China. Journal of Water and Climate Change, 14(2): 590-609.

DOI

[43]
Wang Q, Wang S, Hu Q et al., 2021. Calculation of instream ecological water requirements under runoff variation conditions: Taking Xitiaoxi River in Taihu Lake Basin as an example. Journal of Geographical Sciences, 31(8): 1140-1158.

DOI

[44]
Wang X B, He K N, Dong Z, 2019b. Effects of climate change and human activities on runoff in the Beichuan River Basin in the northeastern Tibetan Plateau, China. Catena, 176: 81-93.

DOI

[45]
Wang Y J, Zhou B T, Qin D H et al., 2017. Changes in mean and extreme temperature and precipitation over the arid region of northwestern China: Observation and projection. Advances in Atmospheric Sciences, 34(3): 289-305.

DOI

[46]
Wei X H, Zhang M F, 2010. Quantifying streamflow change caused by forest disturbance at a large spatial scale: A single watershed study. Water Resources Research, 46(12): 1-15.

[47]
Wu J W, Miao C Y, Zhang X M et al., 2017. Detecting the quantitative hydrological response to changes in climate and human activities. Science of the Total Environment, 586: 328-337.

DOI

[48]
Wu L Y, Zhang X, Hao F H et al., 2020. Evaluating the contributions of climate change and human activities to runoff in typical semi-arid area, China. Journal of Hydrology, 590: 125555.

DOI

[49]
Xu X Y, Yang D W, Yang H B et al., 2014. Attribution analysis based on the Budyko hypothesis for detecting the dominant cause of runoff decline in Haihe Basin. Journal of Hydrology, 510: 530-540.

DOI

[50]
Xue D X, Zhou J J, Zhao X et al., 2021. Impacts of climate change and human activities on runoff change in a typical arid watershed, NW China. Ecological Indicators, 121: 107013.

DOI

[51]
Yang C, Lan Y, Wang N et al., 2017. Mountainous runoff changes and climate factors analysis of the Shule River Basin in 1958-2015. Scientia Geographica Sinica, 37(12): 1894-1899. (in Chinese)

DOI

[52]
Yang J, 2018. Analysis of the status of water resources development and utilization and water-saving potential in Gulang county. Gansu Water Resources and Hydropower Technology, 54(11): 13-17. (in Chinese)

[53]
Yang L, Zhao G J, Tian P et al., 2022. Runoff changes in the major river basins of China and their responses to potential driving forces. Journal of Hydrology, 607: 127536.

DOI

[54]
Yang Z, 2016. Analysis of characteristic and variation trends of mountain runoff in Shiyang River Basin. Groundwater, 38(4): 168-169. (in Chinese)

[55]
Yang Z N, 1991. Glacier Water Resources in China. Lanzhou: Gansu Science and Technology Press. (in Chinese)

[56]
Ye X C, Xu C Y, Zhang Z X, 2020. Comprehensive analysis on the evolution characteristics and causes of river runoff and sediment load in a mountainous basin of China’s subtropical plateau. Journal of Hydrology, 591: 125597.

DOI

[57]
Zhai P M, Zhang X B, Wan H et al., 2005. Trends in total precipitation and frequency of daily precipitation extremes over China. Journal of Climate, 18(7): 1096-1108.

DOI

[58]
Zhai R, Tao F L, 2017. Contributions of climate change and human activities to runoff change in seven typical catchments across China. Science of the Total Environment, 605/606: 219-229.

DOI

[59]
Zhang H L, Meng C C, Wang Y J et al., 2020a. Comprehensive evaluation of the effects of climate change and land use and land cover change variables on runoff and sediment discharge. Science of the Total Environment, 702: 134401.

DOI

[60]
Zhang K, Ruben G B, Li X et al., 2020b. A comprehensive assessment framework for quantifying climatic and anthropogenic contributions to streamflow changes: A case study in a typical semi-arid North China basin. Environmental Modelling & Software, 128: 104704.

[61]
Zhang S, Chen F, 2017. Analysis on the status and existing problems of water resources development and utilization in Tianzhu county. Gansu Science and Technology, 33(8): 11-15. (in Chinese)

[62]
Zhang S, Hua D, Meng X et al., 2011. Climate change and its driving effect on the runoff in the “Three-River Headwaters” region. Journal of Geographical Sciences, 21(6): 963-978.

DOI

[63]
Zhang Y, Zhang S, Zhai X et al., 2012. Runoff variation and its response to climate change in the Three Rivers Source Region. Journal of Geographical Sciences, 22(5): 781-794.

DOI

[64]
Zheng H X, Zhang L, Zhu R R et al., 2009. Responses of streamflow to climate and land surface change in the headwaters of the Yellow River Basin. Water Resources Research, 45(7): 1-9.

[65]
Zhou J J, Xue D X, Lei L et al., 2019. Impacts of climate and land cover on soil organic carbon in the eastern Qilian Mountains, China. Sustainability, 11(20): 5790.

DOI

[66]
Zhou J J, Zhao X, Wu J Y et al., 2021. Wind speed changes and influencing factors in inland river basin of monsoon marginal zone. Ecological Indicators, 130: 108089.

DOI

Outlines

/