Research Articles

Glacier service value and influence on human well-being in Qilian Mountains

  • CAI Xingran , 1 ,
  • XU Chunhai 2 ,
  • LIANG Yanqing 3 ,
  • ZHANG Zhongwu 1 ,
  • LI Zhongqin 2 ,
  • WANG Feiteng 2 ,
  • WANG Shijin 2
Expand
  • 1. Geography Science Institute, Shanxi Normal University, Taiyuan 030031, China
  • 2. State Key Laboratory of Cryospheric Science, Northwest Institute of Eco-Environment and Resources, CAS, Lanzhou 730000, China
  • 3. School of Geographic Sciences, Hebei Normal University, Shijiazhuang 050024, China

Cai Xingran (1993‒), PhD and Lecturer, specialized in cryosphere and sustainable development. E-mail:

Received date: 2022-11-28

  Accepted date: 2023-07-20

  Online published: 2023-11-15

Supported by

Shanxi Province Graduate Education and Teaching Reform Project(2023JG095)

Hebei Province Scholarship Program for Introducing Overseas Students(C20230510)

The Natural Science Foundation of Gansu Province(21JR7RA059)

Hebei Province Cultural and Art Science Planning and Tourism Research Project(HB23-YB063)

National Natural Science Foundation of China(42001067)

State Key Laboratory of Cryospheric Science(SKLCS-ZZ-2021)

Key Science and Technology Project of Gansu Province(22ZD6FA005)

Abstract

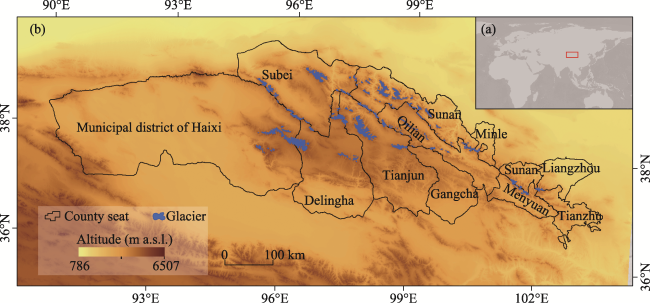
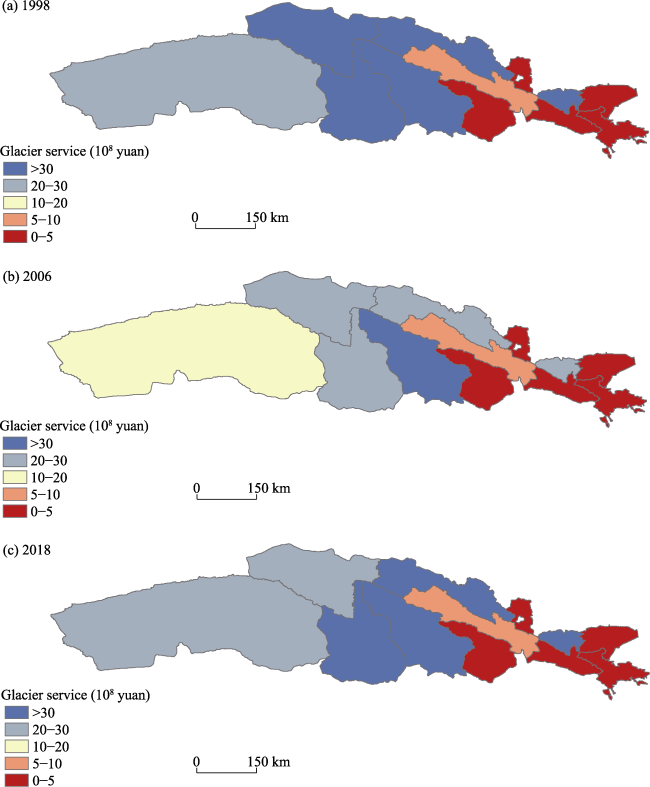
Global warming is causing melting of glaciers, which is affecting socioeconomic development. It is essential to study the combined influence of changes in structures of glaciers on human well-being and socioeconomic systems. Herein, we considered Qilian Mountains as an example, quantified the regional socioeconomic benefits of glaciers and human well-being, and attempted to draw a correlation between glacier service value and human well-being. The findings of our study reveal that the value of glacier services in Qilian Mountains decreased from 1.84 × 10¹⁰ yuan in 1998 to 1.72 × 10¹⁰ yuan in 2018, with a spatial trend of circling down from the central region to the western and eastern regions. The distribution of human well-being showed an increasing trend, and a phenomenon of “low value central and western clustering, high value eastern sporadic distribution.” There is an increasing degree of coordination between human well-being and glacier services value; the spatial distribution shows a decreasing trend from the west to the east, with differences in the nature of coordinated development in different regions at the same coordination stage being obvious. We analyzed the changes in glacier services value and their relationship with human well-being from both micro and macro perspectives to provide theoretical support for formulating management strategies for glacier resource conservation and improving the interface between glacier service evaluation results and government decision-making.

Cite this article

CAI Xingran , XU Chunhai , LIANG Yanqing , ZHANG Zhongwu , LI Zhongqin , WANG Feiteng , WANG Shijin . Glacier service value and influence on human well-being in Qilian Mountains[J]. Journal of Geographical Sciences, 2023 , 33(11) : 2211 -2236 . DOI: 10.1007/s11442-023-2173-z

1 Introduction

Glaciers are a key element of the cryosphere and play a critical role in maintaining regional water balance, regulating local climate, providing biological habitats, and inheriting unique social and cultural structures (Frans et al., 2018; David et al., 2019; Geissler et al., 2021; Shan et al., 2021). Glaciers are an important water resource for the arid regions in Northwest China (Duethmann et al., 2015). Because of their high albedo, latent heat of phase change, and huge ice reserves, glaciers considerably influence earth’s climate (Deng and Chen, 2017; Li et al., 2019; Wang et al., 2021b); nevertheless, glacial meltwater, as a fairly stable runoff supply source, is an important indicator for formulating rational water resources utilization measures (Qin and Ding, 2010; Farinotti et al., 2015; Huai et al., 2015). Global warming accelerate the melting of glaciers (Petrakov et al., 2016), causing them to be in a general state of negative mass balance (Sorg et al., 2012; Arindam et al., 2021; King et al., 2021). Changes in glaciers and the resulting meltwater have significant effects on the water cycle, utilization of water resources, natural ecological environment evolution, social and economic development, and human well-being (Mukherji et al., 2019; Su et al., 2019; Wang et al., 2019). Contemporary studies have mainly focused on the disastrous effects of glacier change and a few have considered the benefits of glaciers on human society (Carey et al., 2012; Fugazza et al., 2018).
Similar to forests, grasslands, wetlands, oceans, and other ecosystems, glaciers have several ecological service functions (Zhang et al., 2019; Sun et al., 2020). Studies on glacier service value are in a continuous exploring phase because of the relatively low public awareness and attention (Xiao et al., 2015). The concept of “cryosphere services and functions” was first proposed by Chinese scholars in 2015; in 2019, cryosphere services were included in the assessment in the Special Report on Ocean and Cryosphere in a Changing Climate (SROCC) (Xiao et al., 2015; Ying, 2020). Cryosphere services include the various benefits that mankind obtains directly or indirectly from the cryosphere (Su et al., 2019). Contemporary studies on cryosphere services have focused on (1) function divisions, (2) evaluation methods, (3) service value estimates, and (4) different perspectives. Under cryosphere services function divisions, in China, there are mainly four types, namely, supply services, regulation services, support services, and cultural services, with nine sub-categories (Xiao et al., 2015). There are diverse cryosphere services evaluation methods, such as material quality, value, and energy analysis (Ying et al., 2019; Zhang et al., 2019). Different elements of the cryosphere have diverse service functions. Many studies have evaluated the service value of glaciers, snow (Yang et al., 2019; Wu et al., 2020), and frozen soil; in particular, glaciers provide different values at different scales, basins, and mountain systems, with significant temporal and spatial differences (Sun et al., 2020; Zhang et al., 2021b). In terms of different perspectives for cryosphere services value, for example, evaluation from the perspective of “resources-assets-capital” can help understand the spatial pattern of the utility potential of cryosphere flow assets (Li et al., 2020), while ecological service systems can help clarify the role of cryosphere resources in specific practices (Xiao et al., 2020). Most studies have thus considered the cryosphere service as a whole, while the single element of glacier service values also needs in-depth and systematic discussion.
As an important part of the watershed ecosystem, glaciers are crucial to the sustainable and healthy development of the local socioeconomic system and human well-being (Su et al., 2019; Cook et al., 2021). Human well-being is primarily defined as a state of health, happiness, prosperity, and activity (MA, 2005; Costanza et al., 2017). While there has been focus mainly on the level of economic development and national income, with increasing urbanization, increasing focus has been placed on the level of social livelihood, social welfare, spiritual requirements, mental health, and ecological environment (Wang et al., 2021a). Therefore, it is necessary to study the relationship between glacier services and human well-being as well as realize the coordination between the provision of glacier services and requirements for human well-being for ensuring sustainable development (Fountain et al., 2012; Rasul and Molden, 2019; Xiao et al., 2019). Human well-being needs and the sustainable development of glacier services are both influenced by one another. As a link between the environment and the socioeconomic system, glacier services primarily manifest themselves in the enhancement of people’s quality of life and development requirements at various levels, thus enhancing human well-being (Pederson et al., 2006; Zhang et al., 2022). In general, glacier services make a significant contribution to human well-being. However, because of increasing global warming, glaciers continue to melt, and glacier services are reaching an inflection point and continue to decline until they are completely lost (Xiao et al., 2019; Mukherji et al., 2019). Over time, successive glacier services are predicted to have a detrimental impact on human well-being, exhibiting the “ecological spell” phenomenon of declining service value and rising well-being levels (Xiao et al., 2015). By 2050, the global population is predicted to increase by a net 3 billion people, and economic growth is predicted to increase by a factor of four. Increase in population and economic growth lead to increasing demand for glacier services and have an intensifying effect on these services. Since the completion of the UN Millennium Ecosystem Assessment (MA), researchers in ecology have concentrated on the connections between ecosystem services and human well-being (Wu, 2013; Bennett et al., 2015; Fang et al., 2018). Research on the relationship between cryospheric services and human well-being is still in exploratory stages compared with ecology research (Lin et al., 2019; Mukherji et al., 2019; Rasul and Molden, 2019; Su et al., 2019). Hence, when evaluating glacier services, we also need to closely focus on human well-being, explore the interaction mechanism between glacier services and human well-being by analyzing their difference in space and time, and create a framework that links glacier functions and services to human well-being (Pederson et al., 2006; Su et al., 2019).
Qilian Mountains are one of the most sensitive and vulnerable locations to global environmental change and are situated in the dry region of Northwest China (Tian et al., 2014; Sun et al., 2018a; Cai et al., 2022). Glacier meltwater contributes to the ecological health of inland river basins and economic development, protecting the ecological security of oases (Sakai et al., 2006; Wang et al., 2011; Li et al., 2014). Strengthening the assessment of glacier services in the region is crucial to highlight the contribution of glaciers in supporting economic development and human well-being and to strengthen human society’s awareness of glacier conservation (Sun et al., 2020). However, contemporary research on glaciers in this region has mainly focused on glacier area (Sakai et al., 2012; Tian et al., 2014; Sun et al., 2018b), volume (Xu et al., 2013; He et al., 2019), glacier thickness (Cao et al., 2014), biological (Takeuchi et al., 2005; Segawa and Takeuchi, 2010; Ali et al., 2019), snowline altitude (Wang et al., 2010; Guo et al., 2021), and so on. Considering the urgent need for research on the relationship between glacier services and human well-being, in this study, we constructed a glacier service assessment index system based on remote sensing images from 1998-2018 and the second China Glacier Inventory data, combined with the basic principles of cryosphere science, and guided by multidisciplinary theories of economics, ecology, and sociology; we used the service price per unit area method to quantitatively assess the service value of Qilian Mountains and the related increases or decreases. Based on these findings, we link glacier services with human well-being and explore the development relationship between them, thus improving the knowledge and understanding of glacier services in Qilian Mountains, providing a reference for coordinating socioeconomic development with ecological environmental protection, and achieving sustainable development.

2 Data and methods

2.1 Study area

Qilian Mountains are located on the northeast edge of the Tibetan Plateau (36°30′-39°30′N, 93°30′-103°00′E), along the northwest-southeast direction, in the east from the Wushaoling Mountains, west to the Jinshan mouth, south of the Qaidam Basin, and north from the Hexi Corridor (Sun et al., 2016; Zhang et al., 2021a) (Figure 1). This region has obvious variances in elevation, with Unity Peak (5826 m a.s.l.) being the highest peak and Qinghai Lake (2162 m a.s.l.) being the lowest having an average elevation of 4000-4500 m (Deng et al., 2013). Qilian Mountains are located far inland and have a continental alpine semi-humid mountain climate, with an average yearly temperature of approximately 5°C. The westerly winds dominate the western portion of the mountain area, which experiences little precipitation, whereas the eastern portion, which experiences abundant precipitation, is under the influence of the East Asian summer winds (Tian et al., 2016). Accordingly, the amount of precipitation decreases from east to west and is primarily concentrated in the summer, with an average annual rainfall of approximately 250 mm. Following the results of the second Chinese Glacier Inventory, 2684 glaciers covering 1597.81 km2 were established in this region, making up 5.5% and 3.1% of all glaciers in China (Sun et al., 2016). By 2018, glacier area decreased to 1554.89 ± 68.41 km2 (Cai et al., 2022), and the trend of glacier melting continued.
Figure 1 Overview of the study area (Qilian Mountains)
As an important glacial and water-conserving ecological function area in Northwest China, Qilian Mountains are a “source of life” for the economic and social development of Gansu, Qinghai, and Inner Mongolia and the production and livelihoods of the people, providing a stable source of water for the north and south oasis and desert ecosystems (Liu et al., 2021). However, the intensification of human activities such as the exploitation of mineral resources and overgrazing has led to major ecological and environmental issues such as vegetation loss, soil contamination, and deterioration of water supplies (Duan et al., 2021). In addition, the area is densely populated, serving as a key implementation region for the Belt and Road construction, and conflicts exist between economic development and ecological protection in the region (Wang et al., 2022). Consequently, investigating the green and high-quality development path of ecological and livelihood win-win is necessary.

2.2 Data

To determine the glacier service value and human well-being index, we examined data on glacier area, glacier volume, temperature, precipitation, remote sensing images, digital elevation model (DEM), population, and socioeconomic information for 11 counties. Glacier distribution in 2006 was derived from the second Chinese Glacier Inventory, which is available from the National Cryosphere Desert Data Center (http://www.ncdc.ac.cn/portal/). Glacier distribution from 1998 and 2018 published by Cai et al. (2022) was used, and it was delineated through manual visual interpretation with the help of Google Earth high-resolution image correction. Errors in glacier area in 1998 and 2018 were ±71.53 km2 and ±68.42 km2, respectively, which were similar to the second Chinese Glacier Inventory data. Shuttle Radar Topography Mission (SRTM) C-band DEM with a 30-m spatial resolution was used to determine the elevation characteristics of glaciers; the data were obtained from the Geospatial Data Cloud platform (http://www.gscloud.cn). The meteorological data were the monthly surface temperature and precipitation gridded data set of China (V3.0) with a spatial rate of 0.5°×0.5°, provided by the National Meteorological Science Data Center (http://data.cma.cn/). Considering the coarse resolution of the gridded data, these data were cropped according to county vector data in practical use, and then, the average values of all grids within each county and city were obtained to represent the temperature and precipitation conditions in each region. Socioeconomic data from the 1998, 2006, and 2018 Gansu Provincial Statistical Yearbook, National Economic and Social Statistical Bulletins of Counties and Cities, and China County Statistical Yearbook were obtained. Some of the missing data were extrapolated using the average annual rate of change to make up for the difference. The above data were processed using ArcGIS 10.2 software, including redefining the projection and resampling the resolution to ensure spatial consistency of all data.

2.3 Methods

2.3.1 Glacier service assessment

(1) Index system construction
Currently, many studies (Xiao et al, 2015; Zhang et al., 2018; Sun et al., 2021) have systematically classified glacier service functions, among which, the most used and authoritative classification system was formed by referring to the MA method. Based on this, we combined the characteristics of glacier area, volume, and meltwater in Qilian Mountains and learned from the classification methods of Constanza et al. (1997) and MA for ecosystem services. We referred to the classification of glacier service functions of Xiao et al. (2015), that is, supply, regulation, culture, and support. At the same time, each category was divided into different sub-items, and then, a glacier service value evaluation index system for Qilian Mountains was constructed (Table 1). Due to the availability, quantification, and objectivity of the data, we made some trade-offs on the evaluation indices when calculating the glacier service value to ensure that the evaluation results were accurate and scientific.
Table 1 Evaluation index system of glacier service value in Qilian Mountains
Service type Evaluation Index Index meaning and service value accounting Evaluation method
Supply
service
Freshwater
resources
The use-value of regional glacier water resources is calculated based on the annual change in glacier volume and the unit price of water resources Market
value method
Hydroelectric
power
The utilization value of glacier hydropower resources is calculated through the annual change of glacier volume and power generation per unit storage capacity Shadow
project method
Regulation service Runoff regulation The regulation effect of the glacier on runoff is evaluated by the annual change in glacier volume Shadow
project method
Climate regulation The regulation effect of the glacier on surface temperature and humidity is composed of the solar radiation energy reflected by the glacier surface and the heat absorbed by the glacier melting Market
value method
Air purification The absorption of surface dust by glaciers is obtained by the absorption equivalent of glaciers to dust Shadow
project method
Cultural
service
Aesthetic
and recreation
The leisure, tourism and entertainment functions of the landscape are calculated based on the research parameters Apportionment method
Scientific research and environmental education Glacier is an important medium for understanding the material cycle and energy transformation in nature, which is supported by projects of National Natural Science Foundation of China Expense method Shadow
project method
Table 1 shows the specific accounting, indicating a problem that one service corresponds to different evaluation methods. Such methods of evaluating the value of scientific research and environmental education include the shadow project method and expense method. To improve the reliability of fair value measurement results, specific measurement methods should be compared and selected for providing a reference for policymakers.
(2) Evaluation method
① Freshwater resources
Glaciers are an important water resource in the arid areas of Northwest China and replenish rivers through melting, playing a significant role in alleviating the water resource crisis. These water resources are mainly used for social production, living, and ecological water. Therefore, we consider the multi-year average change value of glacier volumes as the annual supply of freshwater resources provided by glaciers for human socioeconomic systems and ecological environment systems and used the market value method for accounting (Zhang et al., 2019).
${{V}_{1}}={{r}_{g}}\times {{p}_{i}}$
where V1 is the supply value of glacier water resources (yuan); rg is the average change value of glacier volume over the years (m3); and pi is the price of water (yuan/m3), in which the first average price of water in Gansu region is considered the unit water consumption price of living, ecological, agricultural, industrial, and service industries. The price of water supply was 0.98 yuan/m3 in 1998, 1.36 yuan/m3 in 2006, and 1.75 yuan/m3 in 2018.
② Hydroelectric power
Sufficient glacier meltwater and large torrents are beneficial for regional hydroelectric power generation, especially in the United States, Alps, and Norway. The hydroelectric power function of glaciers is influenced by the gravitational potential energy of glacier meltwater, and its purpose is to produce this function with glacier melt, rather than to generate electricity, thus indirectly providing hydropower for human use. Therefore, we used the shadow project method to calculate the value of hydropower (Sun et al., 2020).
${{V}_{2}}={{r}_{g}}\times {{q}_{hp}}\times {{p}_{r}}$
where V2 refers to the value of glacier hydropower (yuan); rg is the average change value of glacier volume over the years (m3); qhp is the generating capacity per storage capacity (kW·h/m3); and pr denotes the price of hydropower. According to Sun et al. (2020), the average annual power generation per unit storage capacity of reservoirs in Qilian Mountains was 1.46 kw·h/m3 from 1998 to 2018. According to Zhang et al. (2018), we adopted the on-grid electricity price of small hydropower (yuan/kw·h) in Gansu to replace it. The price of hydropower in 2006 and 2018 was 0.227 and 0.257, respectively.
③ Climate regulation
As a special underlying surface, glaciers are characterized by high reflectivity and low thermal conductivity. The reflectivity of glaciers to solar light is nearly 90%, which decreases the absorption of heat by the surface and helps maintain a low local temperature; however, when the glacier reaches the melting state due to an increase in air temperature, the temperature decreases due to the absorption of radiant heat. Glaciers are thus significant for heat absorption, decreasing regional temperature and increasing the atmospheric moisture content. Based on this, most studies take the sum of the solar radiation energy reflected by the glacier surface and the heat absorbed by the glacier melting as the contribution of the glacier to alleviating climate warming; we used the market value method to calculate its climate regulation value with electricity price (Zhang et al., 2018; Sun et al., 2021).
${{V}_{3}}=\left( {{a}_{g}}\times R\times {{\alpha }_{a}}\times {{\alpha }_{s}}+{{r}_{g}}\times {{\rho }_{g}}\times {{q}_{g}} \right)\times {{p}_{e}}$
where V3 is the climate regulation value of the glacier (yuan); ag is the glacier area (km2); R is the annual total solar radiation per unit area of Qilian Mountains (MJ/(m2·a)); aa is glacier albedo (0.6); as means the terrain shading rate (0.5); rg is the average change value of glacier volume over the years (m3); ρg is the glacier density (0.9 g/m3); qg denotes the specific heat capacity of glacier melting (3.36×10⁵ J/kg); and pe is the electricity price (yuan/kw·h). Electricity price in the Qilian region in 1998, 2006, and 2018 was the average price of 0.50 yuan/kw·h for industrial, commercial, and human use.
④ Runoff regulation
As solid reservoirs, glaciers have no construction cost and are useful for water storage; glacier mass balance can redistribute water resources on the temporal and spatial scales, regulate runoff, and avoid and reduce natural disasters. This function is similar to that of a reservoir, and can be evaluated using the shadow project method (Zhang et al., 2019).
${{V}_{4}}={{r}_{g}}\times {{p}_{s}}$
where V4 denotes the runoff regulation value of the glacier (yuan); rg is the average change value of glacier volume over the years (m3); and ps is the unit storage capacity cost of the reservoir (yuan/m3). Based on data from the China Water Conservancy Yearbook from 1991 to 1999, the unit storage capacity cost of the reservoir was 2.17/m3, and the price index in 2005 was 2.816. Hence, following the code for forest ecosystem service evaluation, the unit storage capacity cost of the reservoir from 1998 to 2018 was estimated to be 6.11 yuan/m3 based on the alternative engineering method.
⑤ Air purification
Because of the glacier underlying surface on the temperature field and humidity field clear difference with the surrounding environment, the alpine glacier area formed the cold zone and high-humidity center to some extent, strengthening the horizontal turbulence, changing the regional atmospheric circulation, and intercepting more moisture, which has increased the air humidity and absorption of dust and some of the toxic gases in the atmosphere. Considering the availability of data, we used the shadow project method to calculate the value of glacier purifying air based on total dust fall and glacier area (Sun et al., 2020).
${{V}_{5}}={{c}_{a}}\times {{a}_{g}}\times {{p}_{a}}$
where V5 is the value of glacier air purification (yuan); ca is the total dust fall (kg); ag is the glacier area (km2); and pa refers to unit dust treatment cost (yuan/kg). According to the Code of Forest Ecosystem Service Assessment, the dust treatment cost from 1990 to 2018 was 1.20 yuan/kg.
⑥ Aesthetic and recreation service
Qilian Mountains are rich in glacier resources, providing a unique advantage for the development of glacier tourism. Ice and snow tourist resorts have attracted a large number of domestic and foreign tourists, thus increasing the tourism revenue in this region significantly. At the same time, the region vigorously implements “ice and snow tourism +” to promote the integration of ice and snow tourism with culture, food, homestays, and hot spring, which has contributed to the continuous economic and social development. To facilitate the study, this function value was assessed using the apportionment method, which separated the contribution of the glacier landscape to the tourism income for assessing the tourism value of glacier landscapes. The contribution rate of glacier landscape to total tourism revenue was calculated using the method proposed by Liang et al. (2016), with 12.3% as the proportion of water ecosystem in tourism revenue.
${{V}_{6}}=G\times R\times \frac{{{a}_{g}}}{s}$
where V6 refers to the value of glacier aesthetic and recreation (yuan); G is the total tourism revenue of the Qilian region (yuan); R is the proportion of glacier landscape in tourism revenue (12.3%); ag is the glacier area (km2); and S is the total area of the Qilian region (km2).
⑦ Scientific research and environmental education
This service function was embodied in the national economic growth and people’s welfare improvement brought by educational and scientific research activities such as basic research of cryosphere science, science popularization, training of scientific research talents, and interaction with other disciplines (Cheng et al., 2016). Its value was determined using the following formula:
${{V}_{7}}=11.92\times {{N}_{i}}\times \frac{{{a}_{g}}}{s}$
where V7 is the value of glacier scientific research and environmental education (yuan). Referring to Cheng et al. (2016), the annual cost of each academic paper was 119,200 yuan. Ni is the total number of articles published in the research year; ag is the glacier area (km2); and S is the total area of the Qilian region (km2).

2.3.2 Multi-regional evaluation model of human well-being

(1) Selection and construction of the index system
Considering the requirements for the construction of the human well-being evaluation index system, we counted the number of studies related to the human well-being index system in the China Knowledge Resource Database from 2019 to 2021. Among the three dimensions of material requirements, health and safety requirements, and spiritual needs, we selected the indicators with higher credibility for statistics and those that were cited more than 10 times for human well-being evaluation. We combined the characteristics of Qilian Mountains to develop a human well-being evaluation index system (Table 2).
Table 2 Human well-being evaluation index system and weight
Feature layer Criterion layer Indicators Game combination weight
Material well-being Basic income Total urban disposable income (104 yuan) 0.07
Total rural disposable income (104 yuan) 0.06
Basic substances Grain output per unit area (kg/ha) 0.08
Health and safety needs Health Number of hospital beds (piece) 0.06
hygienic personnel (person) 0.06
Safety Per capita cultivated area (ha/person) 0.15
Per capita grain output (kg/person) 0.18
Forest coverage (%) 0.15
Spiritual needs Good social
relations
Social nursing homes (number) 0.07
Cultural
education
Primary school (number) 0.07
Students in primary and secondary schools (person) 0.06
(2) Standardization of indicator data
Due to the difference in measurement units and standards of the original index data obtained in our study, index data disparity was relatively heavy and incommensurable. Consequently, before measuring the level of human well-being, we adopted the range standardization method for original indicator data to eliminate dimensional influence. Positive and negative indicators were processed using the following formula:
${{Y}_{it}}=\frac{{{X}_{it}}-{{X}_{\text{min}}}}{{{X}_{\text{max}}}-{{X}_{\text{min}}}}$
${{Y}_{it}}=\frac{{{X}_{\text{max}}}-{{X}_{\text{it}}}}{{{X}_{\text{max}}}-{{X}_{\text{min}}}}$
where Yit is the index value after standardization, which varied from 0 to 1. To ensure that all index values were >0, the normalized 0 value was replaced by one-tenth of the minimum value after dividing the index value by 0. Xit is the original index value of the i-th region and item t, and Xmax and Xmin are the maximum and minimum values of the original index value of item t, respectively.
(3) Determination of index weight: game combination weighting method
The level of human well-being does not depend on the subjective will of researchers and has objective attributes. The game combination weighting based on FAHP-CRITIC method explores the process of integration of mutual competition and coordination between the subjective and objective weights, and ensuring partial accuracy of the weighing results. The specific steps of game combination weighting method were obtained by referring to Su et al. (2022).
(4) Human well-being assessment model
We calculated the index value of the human well-being benchmark layer according to Qiu et al. (2023) and obtained the values of the material well-being, health and safety need, and spiritual need indices.

2.3.3 Quadrant map classification method

To explore the relationship between glacier services and human well-being, we applied the quadrant map classification method proposed by Chen et al. (2010). Furthermore, using this method, combined with the degree of deviation, we probed into the spatial relation between glacier services and human well-being (Figure 2).
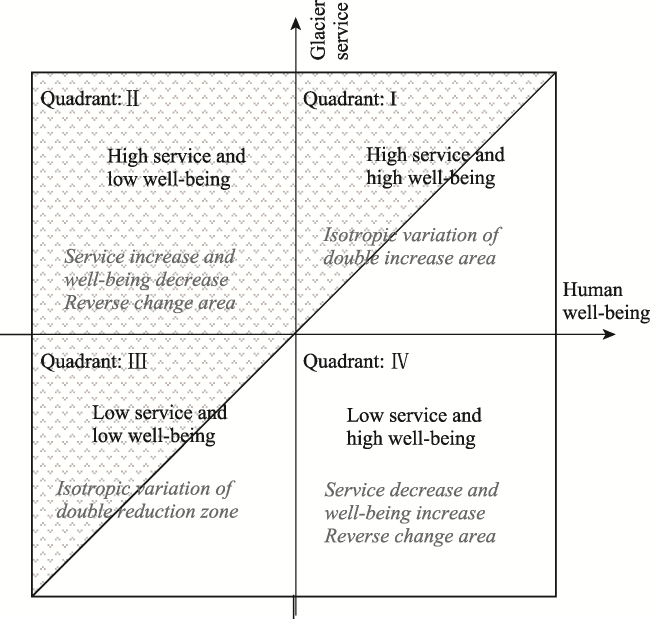
Figure 2 Coordinated relationship between human well-being and glacier service
The basic process is as follows:
(1) The human well-being data (HB) and glacier services data (GSV) were standardized to generate the new human well-being (ZHB) and glacier service level (ZGSV). The standardized formula combined with the degree of deviation is as follows:
$ZHB=\left( H{{B}_{ij}}-{{\overline{HB}}_{i}} \right)/{{S}_{HB}}$
$ZGSV=\left( GS{{V}_{ij}}-{{\overline{GSV}}_{i}} \right)/{{S}_{GSV}}$
where ZHB and ZGSV represent the standardized human well-being and glacier services data, respectively; HBij and GSVij are the human well-being and the glacier service level in the j-th year of the i-th region, respectively; ${{\overline{HB}}_{i}}$ and ${{\overline{GSV}}_{i}}$ refer to the average values of human well-being and glacier services level, respectively; and SHB and SGSV are the standard deviations of human well-being and glacier services levels, respectively.
(2) With human well-being level (ZHB) as the abscissa and glacier services level (ZGSV) as the ordinate, we built the quadrant map of the interaction between human well-being and glacier services. The human well-being and glacier services in different years and areas formed a point set (ZHB, ZGSV), which was plotted in the quadrant map of a scatter plot. We also added a straight line K in the quadrant map of the interaction between human well-being and glacier services, which passed through the origin and bisected the first and third quadrants. The distance from each point to the straight line K represented the coordination relationship between human well-being and glacier services.
(3) The interaction between human well-being and glacier services was identified according to the position of each point in the quadrant map. In the first quadrant, ZHB>0 and ZGSV>0 indicated that human well-being and glacier services level changed along the same direction, which was divided into the “double growth areas changing in the same direction,” with a coordinated relationship. In the second quadrant, ZHB<0 and ZGSV>0 demonstrated that human well-being and glacier service levels changed inversely, which was divided into the “reverse change areas of well-being decrease - service increase,” with low coordination or imbalanced relationship. In the third quadrant, ZHB<0 and ZGSV<0 manifested that human well-being and glacier service levels were both low, which were divided into the “double reduction areas changing in the same direction,” with a low coordination relationship. In the fourth quadrant, ZHB>0 and ZGSV<0 showed that the level of glacier services was low and human well-being was high, which was divided into the “reverse change areas of well-being increase - service decrease,” and the coordination relationship between the two was worse than that in the first and third quadrants.

2.3.4 HR coordination degree model

To obtain a more precise coordination degree between human well-being and glacier services, we used an HR coordination degree model to conduct relevant research (Zhou and Kong, 2015).
$HR\text{ }\!\!~\!\!\text{ =1}-\frac{S}{P}$
$\text{ }\!\!~\!\!\text{ }{{C}_{v}}=\frac{\text{S}}{\text{P}}$
${{C}_{v}}=\frac{S}{P}=\frac{\sqrt{\frac{{{\left( {{P}_{1}}-\bar{P} \right)}^{2}}+{{\left( {{P}_{2}}-\bar{P} \right)}^{2}}}{2}}}{\frac{\left( {{P}_{1}}+{{P}_{2}} \right)}{2}}$
where HR, S, and $\bar{P}$ denote the coordination degree, standard deviation, and arithmetic mean of human well-being and glacier services, respectively; P1 and P2 represent the human well-being index and glacier services value, respectively; and Cv refers to the variation coefficient.
To maintain HR at [0,1], Cv was set to [0,1], whereas Cv did not have this property in essence. Therefore, we adjusted Formula 14 as follows:
$HR\text{ }\!\!~\!\!\text{ =1}-\frac{{{C}_{v}}}{{{C}_{\text{max}}}}\text{=1}-\frac{\text{1}}{{{C}_{\text{max}}}}\times \frac{\sqrt{\frac{{{\left( {{P}_{\text{1}}}-\bar{P} \right)}^{\text{2}}}\text{+}{{\left( {{P}_{\text{2}}}-\bar{P} \right)}^{\text{2}}}}{\text{2}}}}{\frac{\left( {{P}_{1}}\text{+}{{P}_{\text{2}}} \right)}{\text{2}}}$
where Cmax represents the maximum value of Cv, so $\frac{{{C}_{v}}}{{{C}_{\text{max}}}}$ was [0,1]. HR = 1 denotes that human well-being and glacier service value were highly coordinated, whereas HR = 0 denotes that human well-being and glacier services value were completely imbalanced.
According to the degree of coordination between human well-being and glacier services calculated using the HR coordination degree model, we referred to relevant research foundations and combined with the actual situation of the northwest arid region to divide the coordination degree between human well-being and glacier services into severe imbalance [0,0.2], weak imbalance (0.2, 0.4], basic coordination (0.4, 0.6], good coordination (0.6, 0.8], and extreme coordination (0.8, 1].

3 Results

3.1 Glacier services

3.1.1 Overall characteristics of glacier service value

Glacier service value in Qilian Mountains decreased from 1.84×10¹⁰ yuan in 1998 to 1.71× 10¹⁰ yuan in 2018, showing a cumulative decrease of 1.3 × 10⁹ yuan during the past 20 years, which indicates that the glacier service values decreased with the melting of glaciers, mainly due to fewer regulating services.
Value composition of each service function (Table 3) indicates that the total glacier service value in Qilian Mountains was mainly climate regulation with an average value of 1.21×10¹⁰ yuan, which accounted for 75.17% of the total service value, implying that glaciers in Qilian Mountains had an obvious effect on regulating local air temperature. With the continuous retreat of glaciers and rising of the snow line, the average albedo on the glacier surface decreased, which increased the absorption of solar short-wave radiation. The average values of runoff regulation and freshwater resources services were 3.17×10⁹ and 9.14×10⁸ yuan, respectively, which corresponded to 18.39% and 5.35% of the total service value, indicating that glaciers play a key role in maintaining the balance of regional water resources. While glaciers are huge freshwater reserves, glacial meltwater is a fairly stable runoff supply source, playing a vital role in regulating the annual distribution of river runoff and water reserves. Glacier meltwater provides water for downstream animals and plants and is the main source of domestic and production water for residents, which is crucial. Characterized by stable glacier melt runoff and small changes in wet and dry seasons, the hydroelectric power service value accounted for 0.99% of the total value, which is very small, but it played a positive role in supplementing local electricity, promoting social and economic development, and protecting the ecological environment. In addition, the total value of air purification, aesthetic and recreation services, and scientific research and environmental education services accounted for only 0.10%, and the value of scientific research and environmental education services accounted for only 0.002% of the total service value. Glaciers are sensitive to climate change and continue to melt in light of current atmospheric conditions. Therefore, extensive research has been conducted to scientifically investigate glaciers in Qilian Mountains, aiming to strengthen the scientific research to protect these glacial resources and improve glacier service value in scientific research and environmental education. Changes in service functions with relatively small values have some impact on the normal core functions, such as glacier tourism has played a positive role in promoting regional social and economic development, but the overexploitation of glacier tourism and the lack of management measures have exacerbated glacier melting, which has influenced runoff regulation, freshwater resources, hydroelectric power, and so on.
Table 3 Glacier service values in Qilian Mountains in 1998, 2006, and 2018
Service type Service function value 1998 2006 2018
Value
(yuan)
Ratio
(%)
Value
(yuan)
Ratio
(%)
Value
(yuan)
Ratio
(%)
Supply service Freshwater resources 8.08×10⁸ 4.38 2.47×10⁸ 1.82 1.69×10⁹ 9.86
Hydroelectric power 2.41×10⁸ 1.31 6.01×10⁷ 0.44 2.07×10⁷ 1.21
Subtotal 1.05×10⁹ 5.69 3.07×10⁸ 2.26 1.90×10⁹ 11.07
Regulation service Runoff regulation 5.04×10⁹ 27.32 1.10×10⁹ 8.17 3.37×10⁹ 19.68
Climate regulation 1.24×10¹⁰ 66.99 1.21×10¹⁰ 89.53 1.18×10¹⁰ 69.01
Air purification 7.08×10⁵ 0.00 9.80×10⁵ 0.01 6.10×10⁵ 0.00
Subtotal 1.74×10¹⁰ 94.31 1.32×10¹⁰ 97.71 1.52×10¹⁰ 88.69
Cultural service Aesthetic and recreation 9.09×10⁵ 0.00 3.92×10⁶ 0.03 4.06×10⁷ 0.24
Scientific research and environmental education 8.95×10⁴ 0.00 3.29×10⁵ 0.00 3.63×10⁵ 0.00
Subtotal 9.98×10⁵ 0.01 4.25×10⁶ 0.03 4.10×10⁷ 0.24
Total 1.84×10¹⁰ 100 1.36×10¹⁰ 100 1.71×10¹⁰ 100

3.1.2 Spatial dynamic change of glacier service value

Spatially, glacier service values in Qilian Mountains have shown a decreasing trend from the central to the western and eastern regions. Among these, the central region is dominated by extreme grades, the western region mainly exhibits high grades, and the eastern region has low to middle grades. As shown in Figure 3, glacier service value in Qilian Mountains in 1998 was dominated by high and extreme grades, occupying 80.79% of the total area. Light and slight grades accounted for 19.21%, with no moderate grade distribution area. In 2006, moderate, high, and extreme grades were observed, the total number of counties and area ratio remained unchanged, and only the Haixi changed from high to moderate grade. The number of counties with light and slight grades was still 6, and the area ratio remained constant. In 2018, high grade was dominant, accounting for 50.87% of the total area. The second was extreme grade (29.92%), and the low and medium grades accounted for a stable 19.21%.
Figure 3 Spatial distribution of glacier service value in Qilian Mountains in 1998, 2006, and 2018
Further, we used the grid calculator in ArcGIS 10.2 software to calculate dynamic changes in glacier service value in Qilian Mountains during 1998-2006, 2006-2018, and 1998-2018 (Figure 4). Glacier service value decreased in Qilian Mountains from 1998 to 2006, while from 2006 to 2018, it showed an increasing trend, with no reduced areas. Overall, changes in the glacier service value from 1998 to 2018 were dominated by decreased area in Qilian Mountains, which held 89.52% of the total area, with Subei and Tianjun as the centers.
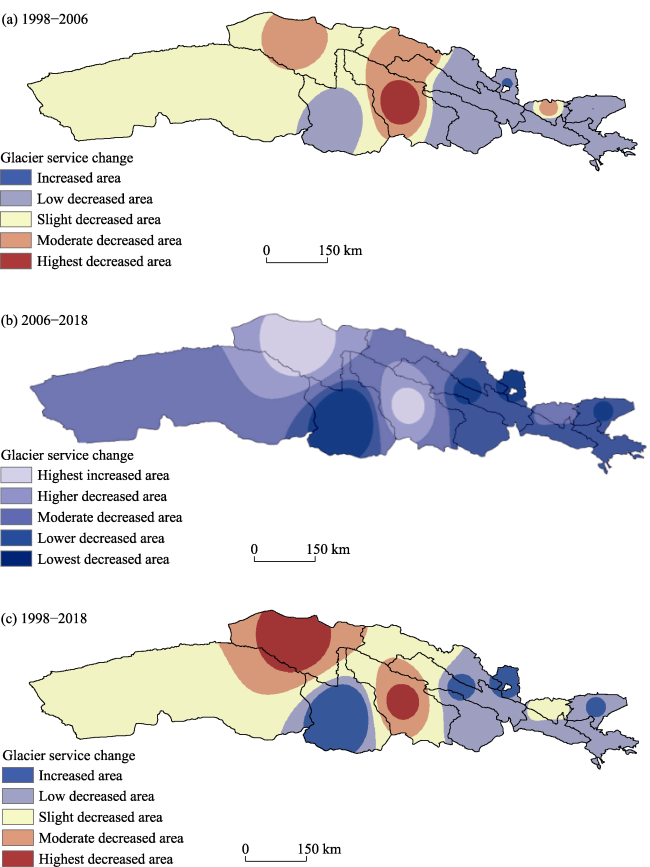
Figure 4 Changes in glacier service value in Qilian Mountains from 1998 to 2018

3.2 Spatio-temporal characteristics of human well-being

The human well-being level in Qilian Mountains was relatively stable from 2006 to 2018, with a slight increasing tendency, showing that people’s happiness in Qilian Mountains increased, along with economic development.
Spatially, the distribution of human well-being in Qilian Mountains was significantly different (Figure 5), showing the distribution characteristics of “low values clustered in the central and western regions, and high values scattered in the eastern regions.” Slight and light levels of human well-being were concentrated in the central and western regions of Qilian Mountains. For example, Haibei, which is located at the north shore of Qinghai Lake, has abundant mineral resources; however, because of its late industrialization, its economic development mode and industrial system are imperfect, leading to low benefits. In addition, the ecological environment is relatively vulnerable. Therefore, the level of human well-being is relatively low under the interaction of multiple factors. The moderate and above levels of human well-being were mainly distributed in the central region, for examples, Liangzhou, which is located in Wuwei City. Under the background of diversified economic development in the west, the external environment of social and economic development is superior in this region. It also integrates superior resources, such as transportation, talents, technology, and agriculture, leading to a high level of internal economic development. In addition, local education and health care continue to improve. The comprehensive influence of various advantages contributes to improving residents’ happiness and well-being levels.
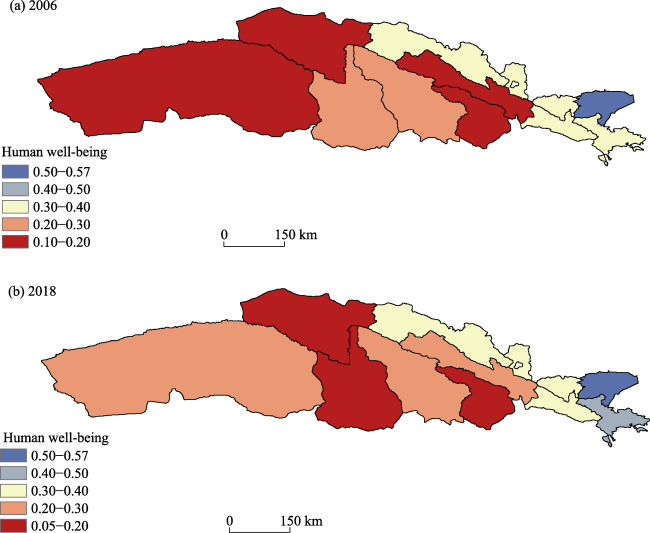
Figure 5 Distribution of human well-being in Qilian Mountains between 2006 and 2018

3.3 Coordination relationship between glacier services and human well-being

Quadrant map classification method indicated that there was one county (Minle county) in the first quadrant of Qilian Mountains in 2006 and 2018, showing that human well-being and glacier services were in the same growth stage; this may be because the county’s human basic material demand satisfaction is high, the levels of material and health and safety welfare are constantly increasing, and the contribution of glacier services to the social economy is increasing, resulting in a relative coordination between glacier services and human well-being. The number of counties in the second quadrant remained unchanged in 2006 and 2018, with a total of four counties (Haixi, Delingha, Tianjun, and Subei). This was because these counties have rich and concentrated glaciers, the glacier service level is relatively high, and the human well-being level is relatively low, which account for a comparatively low coordination degree between them. There were fewer counties in the third quadrant, decreasing from two in 2006 to one in 2018 (Gangcha); the glacier service and human well-being were low, and thus, the two were in low coordination. The number of counties in the fourth quadrant increased from four in 2006 to five in 2018 (Liangzhou, Tianzhu, and Menyuan), with a reverse change characteristic of increasing well-being and decreasing glacier service value (Figure 6).
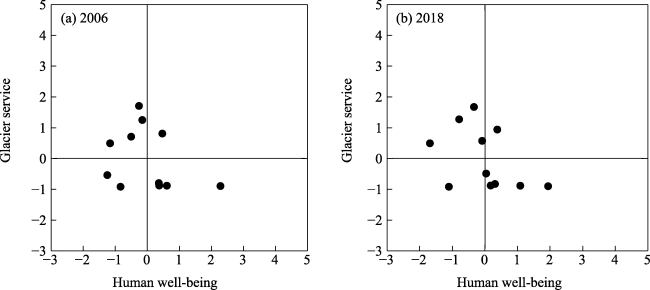
Figure 6 Quadrant diagram of the coordinated relationship between human well-being and glacier service value in Qilian Mountains between 2006 and 2018
In general, human well-being and glacier services in Qilian Mountains were located in the counties in the first or third quadrant, which were mainly areas with relatively good (bad) socioeconomic levels and relatively large (small) glacier resources; glacier services showed some degree of coordination with human well-being. The counties in the second or fourth quadrant were mainly distributed in areas with relatively low (high) socioeconomic levels and rich (scattered) glacier resources. Therefore, under the guidance of high-quality socioeconomic development, people focus on the coordinated green development among environment, ecology, and economic benefits while pursuing material gains, so that in the process of increasing the level of human well-being, people also focus on glacier service value, increasing the awareness of human society to protect glaciers and strive to use limited glacier resources; with this goal, counties in the second and fourth quadrants showed human well-being and glacier services changing toward those in the first or third quadrant, with constant expansion of the coordinated development of human well-being and glacier services and an increase in the trend of coordinated development.

3.4 Coordination degree between glacier services and human well-being

To explore the relationship between glacier services and human well-being, we used the quadrant map classification method, which determined whether they were coordinated; however, the degree of coordination or imbalance between them could not be distinguished. Therefore, we adopted the HR coordination degree model to analyze the coordination degree between glacier services and human well-being.
As shown in Figure 7, human well-being and glacier services in Qilian Mountains developed from a low to high coordination level during 2006-2018, and the coordination degree improved continuously. Spatially, the coordination degree of human well-being and glacier services exhibited distinct regional differences. In 2006, Qilian Mountains had good and extreme coordination areas distributed mainly in the eastern and western regions (Haixi and Haibei), and the basic coordination area was mainly concentrated in the eastern region, with only Gangcha county showing imbalance. Overall, the coordination degree decreased from the western to eastern region. Considering the current regional differentiation patterns, clearly, the imbalance of coordinated development deserves attention, especially in the regions that showed reverse changes of increasing glacier services and decreasing human well-being. In future, focus should be placed on the rational utilization and protection of glacier resources while enhancing human well-being. The level of coordinated development in Qilian Mountains also needs to be improved in future. Although some regions showed high levels of coordination, they essentially showed low-level coordinated development. These areas should constantly move toward a high level of coordinated development based on the natural ecological environment, economic development level, glacier resources, and so on.
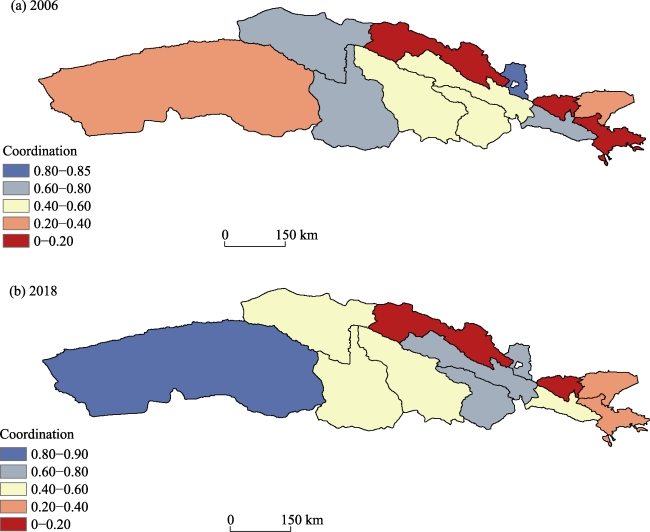
Figure 7 Spatial distribution of the coordination degree between human well-being and glacier services in Qilian Mountains between 2006 and 2018
Additionally, the nature of coordinated development in different regions at the same coordination level is obviously different. Moreover, divergences in human well-being and glacier services exist among different regions, but the level of coordination among these regions may be the same. For example, Haixi and Sunan in Qilian Mountains are at an extreme coordination level, with an obvious discrepancy in the coordination degree. In 2006, the human well-being index and glacier service index in Haixi (0.11 and 0.54, respectively) were lower than those in Sunan (0.32 and 0.66, respectively). Thus, the former showed extremely low-level of coordination, while the latter had high levels of coordination. This may be because Sunan, located in the Centra Hexi Corridor, is the area with the most significant social and economic impact at the northern foot of Qilian Mountains, and its unique geographical location determines that its arid oasis is highly coupled with the ice layer. In 1998, the area was included in Qilian Mountain National Nature Reserve, which improved the level of human settlements. Moreover, the region has actively developed national industry and characteristic tourism, constantly improved infrastructure and welfare system, and vigorously promoted education, which, to some extent, have satisfied people’s material needs. Moreover, it has relatively large glaciers and abundant glacier volumes, which have obvious regulating effects on the Shiyang, Heihe, and Shule Rivers. Glaciers also “regulate” local ecological balance and environmental quality. Consequently, glacier services and human well-being in the region showed high levels of coordination. In Qinghai province, the economic development of Haixi is mainly driven by industry, which is partly influenced by sustainable and healthy economic development. Based on this, together with the limited resources and environment carrying capacity, culture and education, social welfare, social security, and health care, the level of human well-being is high, but it is increasing slowly. The contribution of glaciers to the social economy is increasing simultaneously, thereby improving the coordination of glacier services with human well-being. Compared with Sunan, Haixi has low levels of coordination. Therefore, during the comparative analysis of the coordinated development of human well-being and glacier services, we should not only consider the level of coordination but also combine the actual level of human well-being and glacier services to analyze results accurately and objectively.

4 Discussion

4.1 Impact of glacier change vulnerability on glacier services

Glacier change vulnerability is the degree of how a system is affected by glacier changes, and its evaluation results can reflect the socioeconomic impact of glacier change on a region. The evaluation of glacier services, represented by the various benefits obtained by human society directly or indirectly from glaciers, are an important element to measure whether a region can achieve sustainable development. Therefore, we attempted to combine the vulnerability of glacier changes with glacier services and explore the impact of glacier change vulnerability on glacier services. According to Cai et al. (2022), we obtained the glacier change vulnerability distribution characteristics of Qilian Mountains. To clearly understand the impact of glacier change vulnerability on glacier services, we refined the glacier service value of Qilian Mountains and divided it into seven grades (0-5, 5-10, 10-15, 15-20, 20-25, 25-30, and >3 billion yuan). As shown in Figure 8, under the influence of glacier change vulnerability, the glacier service level in Qilian Mountains showed a decreasing trend, while the degree of decrease varied greatly. The central region was more significant, followed by the western and eastern regions (smallest trend). Thus, in the regions with high vulnerability, glacier service value was higher, and the vulnerability had a greater impact on glacier services, otherwise, the impact was weak.
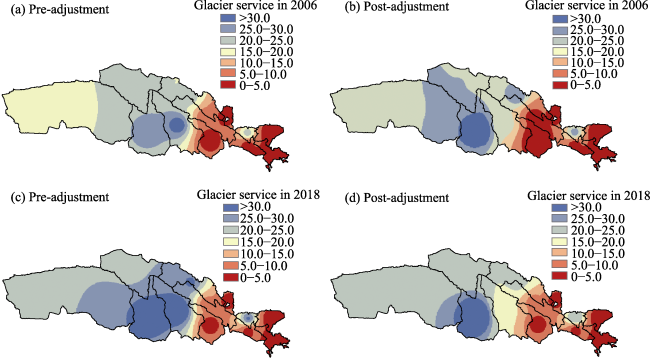
Figure 8 Impacts of glacier change vulnerability on service value in Qilian Mountains between 2006 and 2018

Lables: pre-adjustment refers to glacier service value unaffected by the glacier change vulnerability, and post-adjustment refers to the glacier service value influenced by glacier change vulnerability

To specifically study the impact of glacier change vulnerability on glacier services, we divided the reduction scope of glacier service value in Qilian Mountains between 2006 and 2018 into 10 grades: <−27, between -27 and -24, between -24 and -21, between -21 and -18, between -18 and -15, between -15 and -12, between -12 and -9, between -9 and -6, between -6 and -3, and between -3 and 0 million yuan. As shown in Figures 9 and 10, regions with the decreasing degree of glacier service value between -3 and 0 were dominant, accounting for 59.6% in 2006 and increased to 74.2% in 2018. The proportion of regions between -6 and -3 was second, and it decreased from 2006 to 2018 (22.4% and 12.7%, respetively). The proportion of regions between -9 and -6 decreased from 9.0% in 2006 to 6.7% in 2018. The proportion of regions between -12 and -9 and between -15 and -12 increased slightly from 2006 to 2018, with an increase of 4.0% and 1.0%, respectively. From 2006 to 2018, except for between -15 and -18, when reduction decreased from 1.4% to 0.8%, the proportion of regions in the remaining grades presented a downward trend, decreasing to 0%. The effect of glacier change vulnerability on glacier services was concentrated between -9 and 0, with the area ratio increasing from 91.0% in 2006 to 93.6% in 2018, indicating that glacier change vulnerability led to a decrease in the glacier service level, but the impact was weak.
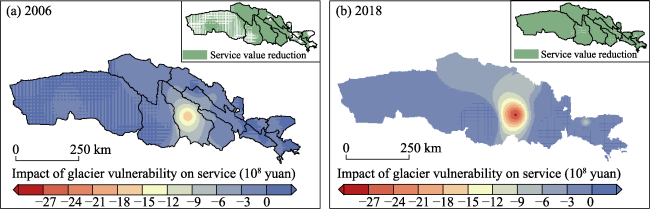
Figure 9 Spatially distributed glacier service value in Qilian Mountains between 2006 and 2018
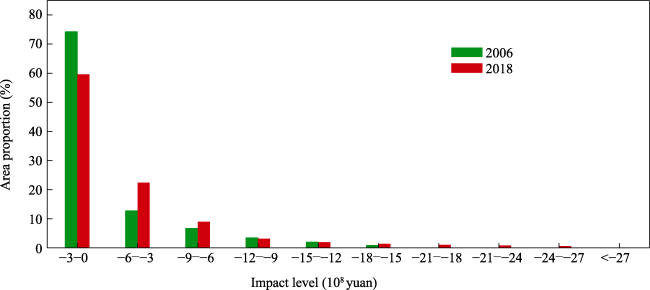
Figure 10 Area proportion of glacier service value in Qilian Mountains between 2006 and 2018

4.2 Reliability analysis of glacier services value results

Glacier services are diverse and complex. Few studies have focused on this aspect; therefore, we verified the reliability of the results by comparing the glacier service value in similar regions and different scales. Glaciers provide various services, and glaciers with different scales have obviously diverse service values. Based on correlation research, we compared the glacier service values of Chinese Tianshan Mountains and Qilian Mountains, and the results showed good agreement (Zhang et al., 2019).
However, our estimation of glacier services value in Qilian Mountains has definite errors and uncertainties within a reasonable range. Glaciers not only provide shelter for animals and plants but also offer provenance protection of scarce wildlife, playing an obvious supporting role. It is difficult to choose assessment indicators and methods; thus, we did not carry out quantitative accounting for glacier support services, and our estimated total value of glacier services is conservative. Moreover, in the estimation of glacier aesthetic appreciation and recreation services, because of many quantitative research methods and considering the comparability of research results, we directly used the domestic cost of issuing documents for calculation, which partly affected the estimation results of the total value of glacier services.

4.3 Standardization and uncertainty of the human well-being evaluation system

One possible reason why it is difficult to deeply study the relationship between glacier services and human well-being is the lack of a standardized method for constructing a human well-being evaluation index system. Human well-being is a multi-dimensional integrated concept. Studies have shown that subjectivity and uncertainty exist in the selection of indicators or the construction of indicator systems, leading to significant differences in the evaluation indicator systems, which make it difficult to compare similar studies in different regions horizontally. Additionally, due to limited data availability, representativeness, and finiteness, we opted for the most popular material, spiritual and cultural, and health and safety indicators as the representative indicators of human well-being, which is objective but not normative. In addition, the multi-dimensional characteristics of human well-being require that subjective, objective, ecological, and economic and social perspectives should be considered to construct an indicator system, which can help standardize the evaluation of human well-being at different scales, regions, and individuals. Therefore, it is crucial to strengthen and improve the standardization of the human well-being evaluation system for ensuring the objectivity, comparability, and accuracy of evaluation contents, methods, and results.

4.4 Limitation analysis of the relationship between glacier services and human well-being

As a bridge linking natural ecosystems and human well-being, ecosystem service has become an increasingly popular research topic, and glacier services are a part of ecosystem services. Therefore, exploring and analyzing the relationship between glacier services and human well-being is a crucial research topic in the cryosphere and ecosystem. Qilian Mountains are rich in glacier resources, which are not only an important part of the Asian water tower, but also an eco-environmental sensitive and fragile area. Therefore, accurately understanding the relationship between glacier services and human well-being is essential for strengthening glacier services and promoting human well-being. We discussed the relationship between glacier services and human well-being by using the quadrant map classification method and HR coordination degree model, which can clarify the relationship between glacier services and human well-being in different regions; however, there are obvious limitations in directly revealing the impact or contribution process of glacier services to human well-being. Because of the lack of a standardized method for the construction of the human well-being evaluation index system, restrictions in the availability of index data and the increasing contradiction between the melting of glaciers, and improved human well-being since the beginning of the 21st century, we did not evaluate human well-being in 1998 to collect more adequate and realistic data to objectively reflect the human well-being evaluation results. However, currently, quantitative studies of glacier services and human well-being are in the preliminary exploration stage, and the mechanisms of glacier services on human well-being remain unclear. If those glacier service types are clearly relevant to human well-being, are those irrelevant glacier services unimportant? Which elements of glacier services contribute to human well-being and to what extent? To what extent does the glacier service benefit the local society and economy? These issues must be quantitatively analyzed to examine the impact mechanism of glacier services on human well-being. Accordingly, after understanding the relationship between glacier services and human well-being, we strive to clarify and grasp the influence of glacier services on human well-being, which not only directly reflects the social contribution of glacier services but also provides favorable support for the sustainable utilization of glacier resources, in addition to promoting the coordinated development of people and land in arid areas.
Furthermore, the contribution of glacier services to human well-being represents a subset rather than a whole. Human well-being depends on both glacier and non-glacier elements, which accounts for a complex coupling relationship between glacier services and human well-being. In future research, we aim to combine policy, economic, and other factors to examine the welfare effect of glacier services under the interaction of multiple factors.

5 Conclusions

The study, taking the Qilian Mountains as an example, firstly builds an assessment system for glacier services based on data from multiple sources and socio-economic parameters to quantify the value of glacier services; secondly, gauges the level of human well-being in terms of material, health and safety, and spiritual needs; and finally, dissects the relationship between glacier services and human well-being. The conclusions are as follows:
(1) The spatial heterogeneity of glacier services value is significant, with extreme grade dominating in the central Qilian Mountains, a high grade in the western region, and moderate to lower grade in the eastern part, showing a trend of decreasing circles from the central region to the western and eastern regions. In the short term, the value of glacier services as a whole rises, but over the long term, that value declines or is even lost. Climate regulation and runoff regulation are the primary services in the Qilian Mountains, according to the analysis of each service type.
(2) Human well-being has been increasing over time, with the human well-being index increasing from 0.27 in 2006 to 0.29 in 2018, but the spatial distribution varies, with moderate and above levels concentrated in the central region, and low level clustered in a contiguous distribution in the central and western regions.
(3) Human well-being and glacier services have evolved from a low level of coordination stage to a high level of coordination stage, and the degree of coordination has been increasing, but it should be noted that there are obvious differences in the nature of coordinated development in different areas of the same coordination stage. The degree of spatial coordination exhibits a characteristic of diminishing distribution from the west to the east.
We have explored the development characteristics of glacier services and human well-being in different development periods and their relationships, which help to identify the socio-economic effects of glacier services at a macro level but ignore the influence of other uncertain factors on the relationship. Due to this, the future study should focus more on the scientific implications of how glacier services are formed, human well-being, and how these factors interact with one another, as well as undertake thorough research based on the confluence of several fields and disciplines.
[1]
Ali B, Sajjad W, Ghimire P S et al., 2019. Culture-dependent diversity of bacteria from Laohugou glacier, Qilian Mts., China and their resistance against metals. Journal of Basic Microbiology, 59(11): 1065-1081.

DOI PMID

[2]
Bennett E M, Cramer W, Begossi A et al., 2015. Linking biodiversity, ecosystem services, and human well-being: three challenges for designing research for sustainability. Current Opinion in Environmental Sustainability, 14: 76-85.

DOI

[3]
Cai X R, Li Z Q, Xu C H, 2022. Glacier wastage and its vulnerability in the Qilian Mountains. Journal of Geographical Sciences, 32(1): 117-140.

DOI

[4]
Cao B, Pan B T, Wang J et al., 2014. Changes in the glacier extent and surface elevation along the Ningchan and Shuiguan river source, eastern Qilian Mountains, China. Quaternary Research, 81(3): 531-537.

DOI

[5]
Carey M, Huggel C, Bury J et al., 2012. An integrated socio-environmental framework for glacier hazard management and climate change adaptation: Lessons from Lake 513, Cordillera Blanca, Peru. Climatic Change, 112: 733-767.

DOI

[6]
Chen M X, Lu D D, Liu H, 2020. The provincial pattern of the relationship between China’s urbanization and economic development. Acta Geographica Sinica, 65(12): 1443-1453. (in Chinese)

[7]
Cheng M, Zhang L Y, Cui L Y et al., 2016. Progress in ecosystem services value valuation of coastal wetlands. Acta Ecologica Sinica, 36(23): 7509-7518. (in Chinese)

[8]
Cook D, Malinauskaite L, Davíðsdóttir B et al., 2021. Co-production processes underpinning the ecosystem services of glaciers and adaptive management in the era of climate change. Ecosystem Services, 50: 101342.

DOI

[9]
Costanza R, de Groot R, Braat L et al., 2017. Twenty years of ecosystem services: How far have we come and how far do we still need to go? Ecosystem Services, 28: 1-16.

DOI

[10]
David B B, John E C, Knut C, 2019. Influence of North Atlantic climate variability on glacier mass balance in Norway, Sweden and Svalbard. Journal of Glaciology, 65: 580-594.

DOI

[11]
Deng H J, Chen Y N, 2017. Influences of recent climate change and human activities on water storage variations in Central Asia. Journal of Hydrology, 544: 46-57.

DOI

[12]
Deng S F, Yang T B, Zeng B et al., 2013. Vegetation cover variation in the Qilian Mountains and its response to climate change in 2000-2011. Journal of Mountain Science, 10(6): 1050-1062.

DOI

[13]
Duan Q T, Luo L H, Zhao W Z et al., 2021. Mapping and evaluating human pressure changes in the Qilian Mountains. Remote Sensing, 13(12): 2400.

DOI

[14]
Duethmann D, Bolch T, Farinotti D et al., 2015. Attribution of streamflow trends in snow and glacier melt dominated catchments of the Tarim River, Central Asia. Water Resources Research, 51: 4727-4750.

DOI

[15]
Fang X N, Zhou B B, Tu X Y et al., 2018. What kind of a science is sustainability science? An evidence-based reexamination. Sustainability, 10: 16.

DOI

[16]
Farinotti D, Longuevergne L, Moholdt G et al., 2015. Substantial glacier mass loss in the Tien Shan over the past 50 years. Nature Geoscience, 8: 716-722.

DOI

[17]
Frans C, Istanbulluoglu E, Lettenmaier D P et al., 2018. Glacier recession and the response of summer streamflow in the Pacific Northwest United States, 1960-2099. Water Resources Research, 54: 6202-6225.

[18]
Fugazza D, Scaioni Marco, Corti Manuel et al., 2018. Combination of UAV and terrestrial photogrammetry to assess rapid glacier evolution and map glacier hazards. Natural Hazards and Earth System Sciences, 18: 1055-1071.

[19]
Geissler J, Mayer C, J Juilson et al., 2021. Analyzing glacier retreat and mass balances using aerial and UAV photogrammetry in the Ötztal Alps, Austria. The Cryosphere, 15: 3699-3717.

DOI

[20]
Guo Z M, Wang N L, Shen B S et al., 2021. Recent spatiotemporal trends in glacier snowline altitude at the end of the melt season in the Qilian Mountains, China. Remote Sensing, 13(23): 4935.

DOI

[21]
He J, Wang N L, Chen A A et al., 2019, Glacier changes in the Qilian Mountains, Northwest China, between the 1960s and 2015. Water, 11(3): 623.

DOI

[22]
Huai B J, Li Z Q, Sun M P et al., 2015. Change in glacier area and thickness in the Tomur Peak, western Chinese Tien Shan over the past four decades. Journal of Earth System Science, 124: 353-363.

DOI

[23]
Li C Y, Wang X M, Ding Y J et al., 2020. A study on sustainable use of cryospheric resources. Climate Change Research, 16: 570-578. (in Chinese)

[24]
Li Y J, Ding Y J, Shangguan D H et al., 2019. Regional differences in global glacier retreat from 1980 to 2015. Advances in Climate Change Research, 10: 203-213.

DOI

[25]
Li Z X, Feng Q, Liu W et al., 2014. Study on the contribution of cryosphere to runoff in the cold alpine basin: A case study of Hulugou River Basin in the Qilian Mountains. Global and Planetary Change, 122: 345-361.

DOI

[26]
Liang H, Pan X F, Yu X F et al., 2016. Valuation of water ecosystem services in Shenzhen city. Journal of Natural Resources, 31(9): 1474-1485. (in Chinese)

DOI

[27]
Lin H X, Huang J C, Fang C L et al., 2019. A preliminary study on the theory and method of comprehensive regionalization of cryospheric services. Advances in Climate Change Research, 10(2): 115-123.

DOI

[28]
Liu L, Song W, Zhang Y J et al., 2021. Zoning of ecological restoration in the Qilian Mountain area, China. International Journal of Environmental Research and Public Health, 18(23): 12417.

DOI

[29]
Millennium Ecosystem Assessment MA, 2005. Ecosystems and Human Well-Being:Synthesis; Millennium Ecosystem Assessment. Washington DC, USA.

[30]
Mukherji A, Sinisalo A, Nüsser M et al., 2019. Contributions of the cryosphere to mountain communities in the Hindu Kush Himalaya: A review. Regional Environmental Change, 19(5): 1311-1326.

DOI

[31]
Pederson G T, Gray S T, Fagre D B et al., 2006. Long-duration drought variability and impacts on ecosystem services: A case study from Glacier National Park, Montana. Earth Interactions, 10(4): 1-28.

[32]
Petrakov D, Shpuntova A, Aleinikov A et al., 2016. Accelerated glacier shrinkage in the Ak-Shyirak massif, Inner Tien Shan, during 2003-2013. Science of the Total Environment, 562: 364-378.

[33]
Qin D H, Ding Y J, 2010. Key issues on cryospheric changes, trends and their impacts. Advances in Climate Change Research, 1: 1-10.

DOI

[34]
Qiu J J, Liu Y H, Chen C J et al., 2023. Spatial structure and driving pathways of the coupling between ecosystem services and human well-beings: A case study of Guangzhou. Journal of Natural Resources, 38(3): 760-778. (in Chinese)

DOI

[35]
Sakai A, Fujita K, Duan K et al., 2006. Five decades of shrinkage of July 1st glacier, Qilian Shan, China. Journal of Glaciology, 52(176): 11-16.

DOI

[36]
Sakai A, Inoue M, Fujita K et al., 2012. Variations in discharge from the Qilian Mountains, Northwest China, and its effect on the agricultural communities of the Heihe Basin, over the last two millennia. Water History, 4(2): 177-196.

DOI

[37]
Segawa T, Takeuchi N, 2010. Cyanobacterial communities on Qiyi glacier, Qilian Shan, China. Annals of Glaciology, 51(56): 135-144.

DOI

[38]
Shan Z H, Li Z D, Dong X Y, 2021. Impact of glacier changes in the Himalayan Plateau disaster. Ecological Informatics, 63: 101316.

DOI

[39]
Su B, Xiao C, Chen D et al., 2019. Cryosphere services and human well-being. Sustainability, 11(16): 1-23.

DOI

[40]
Su G Q, Lv H S, Zhu Y H et al., 2022. Combined weight method based on game theory for flood risk assessment in the Wuwei region. Arid Zone Research, 39(3): 801-809. (in Chinese)

[41]
Sun F X, Lyu Y H, Fu B J et al., 2016. Hydrological services by mountain ecosystems in Qilian Mountain of China: A review. Chinese Geographical Science, 26(2): 174-187.

DOI

[42]
Sun M P, Liu S Y, Yao X J et al., 2018a. Glacier changes in the Qilian Mountains in the past half-century: Based on the revised First and Second Chinese Glacier Inventory. Journal of Geographical Sciences, 28(2): 206-220.

DOI

[43]
Sun M P, Ma W Q, Yao X J et al., 2020. Evaluation and spatiotemporal characteristics of glacier service value in the Qilian Mountains. Journal of Geographical Sciences, 30(8): 1233-1248.

DOI

[44]
Sun W J, Qin X, Wang Y T et al., 2018b. The response of surface mass and energy balance of a continental glacier to climate variability, western Qilian Mountains, China. Climate Dynamics, 50(9): 3557-3570.

DOI

[45]
Takeuchi N, Matsuda Y, Sakai A et al., 2005. A large amount of biogenic surface dust (cryoconite) on a glacier in the Qilian Mountains, China. Bulletin of Glaciological Research, 22: 1-8.

[46]
Tian F, Y H, Fu B J et al., 2016. Effects of ecological engineering on water balance under two different vegetation scenarios in the Qilian Mountain, northwestern China. Journal of Hydrology, 5: 324-335.

[47]
Tian H Z, Yang T B, Liu Q P, 2014. Climate change and glacier area shrinkage in the Qilian Mountains, China, from 1956 to 2010. Annals of Glaciology, 55(66): 187-197.

DOI

[48]
Wang B J, Zhang Q, Cui F Q, 2021a. Scientific research on ecosystem services and human well-being: A bibliometric analysis. Ecological Indicators, 107449.

[49]
Wang N L, He J Q, Pu J C et al., 2010. Variations in equilibrium line altitude of the Qiyi Glacier, Qilian Mountains, over the past 50 years. Chinese Science Bulletin, 55(33): 3810-3817.

DOI

[50]
Wang P Y, Li Z Q, Gao W Y, 2011. Rapid shrinking of glaciers in the Middle Qilian Mountain region of Northwest China during the last ∼50 years. Journal of Earth Science, 22(4): 539-548.

DOI

[51]
Wang R H, Peng Q, Zhang W D et al., 2022. Ecohydrological service characteristics of Qilian Mountain ecosystem in the next 30 years based on scenario simulation. Sustainability, 14(3): 1819.

DOI

[52]
Wang S J, Che Y J, Wei Y Q, 2021b. Spatiotemporal dynamic characteristics of typical temperate glaciers in China. Scientific Reports, 11: 657.

DOI

[53]
Wang X M, Liu S W, Zhang J L, 2019. A new look at roles of the cryosphere in sustainable development. Advances in Climate Change Research, 10: 124-131.

DOI

[54]
Wu J, 2013. Landscape sustainability science: Ecosystem services and human well-being in changing landscapes. Landscape and Ecological Engineering, 28: 999-1023.

[55]
Wu X J, Wang X, Liu, S W et al., 2020. Snow cover loss compounding the future economic vulnerability of western China. Science of the Total Environment, 755: 143025.

DOI

[56]
Xiao C D, Su B, Wang X M et al., 2019. Cascading risks to the deterioration in cryospheric functions and services. Chinese Science Bulletin, 64(19): 1975-1984.

[57]
Xiao C D, Wang S J, Qin D H, 2015. A preliminary study of cryosphere service function and value evaluation. Advances in Climate Change Research, 6(3/4): 181-187.

DOI

[58]
Xiao C D, Wang X M, Su B, 2020. Key viewpoint of cryospheric human-sociology: Function and service. Bulletin of Chinese Academy of Sciences, 35: 504-513. (in Chinese)

[59]
Xu J L, Liu S Y, Zhang S Q et al., 2013. Recent changes in glacial area and volume on Tuanjiefeng Peak region of Qilian Mountains, China. PloS One, 8(8): e70574.

DOI

[60]
Yang Y, Wu X J, Liu S W et al., 2019. Valuating service loss of snow cover in Irtysh River Basin. Advances in Climate Change Research, 10: 109-114.

DOI

[61]
Ying X, 2020. Assessment of glaciers and permafrost services on the Tibetan Plateau[D]. Beijing: University of Chinese Academy of Sciences. (in Chinese)

[62]
Zhang J L, Zhang W, Liu S W et al., 2022. Cryosphere services to support SDGs in high mountains. Sustainability, 14(2): 791.

DOI

[63]
Zhang L F, Yan H W, Qiu L A et al., 2021a. Spatial and temporal analyses of vegetation changes at multiple time scales in the Qilian Mountains. Remote Sensing, 13(24): 5046.

DOI

[64]
Zhang W, Wang X M, Shen Y P et al., 2021b. Cryospheric water regime by its functions and services in China. Advances in Climate Change Research, 12: 430-443.

DOI

[65]
Zhang Z Y, Liu L, He X L et al., 2019. Evaluation on glaciers ecological services value in the Tianshan Mountains, Northwest China. Journal of Geographical Sciences, 29(1): 101-114.

DOI

[66]
Zhou Z, Kong X Z, 2015. Patter and influencing factors of coordinated implementation of “four tasks” in China: Perspective of agricultural modernization. China Soft Science, (10): 9-26. (in Chinese)

Outlines

/