Research Articles

Evolution characteristics of ecosystem functional stability and ecosystem functional zoning on the Qinghai-Tibet Plateau

  • WANG Qianxin , 1, 2 ,
  • CAO Wei , 1, * ,
  • HUANG Lin 1
Expand
  • 1. Key Laboratory of Land Surface Pattern and Simulation, Institute of Geographic Sciences and Natural Resources Research, CAS, Beijing 100101, China
  • 2. University of Chinese Academy of Sciences, Beijing 100049, China
* Cao Wei (1982-), PhD and Associate Professor, specialized in regional ecosystem assessment. E-mail:

Wang Qianxin (2000-), Master Candidate, specialized in remote sensing of ecology and GIS. E-mail:

Received date: 2023-07-23

  Accepted date: 2023-08-17

  Online published: 2023-11-15

Supported by

The Second Tibetan Plateau Scientific Expedition and Research Program(2019QZKK0404)

Abstract

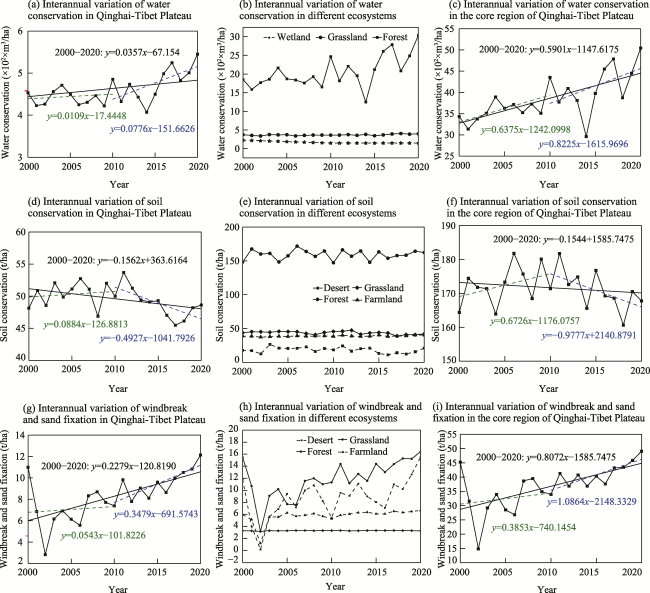
The Qinghai-Tibet Plateau (QTP), also known as the Third Pole of the Earth, is a vital ecological security barrier for China. It is a tremendously sensitive region affected by the impacts of global climate change. The escalating intensity of climate change has presented profound challenges to its ecosystem functions and stability. This study first analyzes the spatiotemporal variations of the QTP ecosystem patterns and the key functions of the Plateau including water conservation, soil conservation, and windbreak and sand fixation from 2000 to 2020. It clarifies the regional differences in ecosystem functions and their importance, further evaluates the stability of ecosystem functions, and lays a scientific foundation for an ecological civilization on the Plateau by implementing conservation and restoration projects. The main results show that: (1) From 2000 to 2020, the wetland area in the QTP increased, while the grassland area significantly decreased. There were improvements in water conservation and windbreak and sand fixation capacities, with annual rates of change being 3.57 m3·ha-1·a-1 and 0.23 t·ha-1·a-1, respectively. However, the overall soil conservation trend declined during the same period, with an annual change rate of -0.16 t·ha-1·a-1. (2) The core areas of water conservation, soil conservation, and windbreak and sand fixation on the QTP accounted for 12.7%, 13.9%, and 14.2% of the total area, respectively. The core water conservation areas are mainly the southeastern QTP, Sanjiangyuan, and Naqu, while the core windbreak and sand fixation areas were concentrated in the central and western parts of the Plateau. The core soil conservation areas surrounded the entire interior of the Plateau. (3) From 2000 to 2020, the water conservation, soil conservation, and windbreak sand-fixation function on the QTP had higher stability in the southeastern and central parts, while stability was lower in the western region. Considering the stability assessment and ecological protection and restoration practices, the QTP can be divided into three major categories and 16 ecological functional zones. Differentiated ecological protection and restoration efforts can be implemented based on the different core ecosystem functions and zoning.

Cite this article

WANG Qianxin , CAO Wei , HUANG Lin . Evolution characteristics of ecosystem functional stability and ecosystem functional zoning on the Qinghai-Tibet Plateau[J]. Journal of Geographical Sciences, 2023 , 33(11) : 2193 -2210 . DOI: 10.1007/s11442-023-2172-0

1 Introduction

Ecosystem services are the goods and services that humans obtain directly or indirectly from ecosystem functions, which are indispensable for the functioning of the Earth’s life-support systems and are the basis for the survival and development of human society (Costanza et al., 1997). Due to the increasing interference of human activities in ecosystems, the functions of ecosystem services are continuously declining (Han et al., 2020). Through 20 years of ecological conservation and restoration, the deterioration of various natural ecosystems in China has been effectively curbed, the ecological service functions of key ecological function areas have been steadily improved, and a framework for a national ecological security barrier has been constructed. However, China’s natural ecosystems are still relatively fragile, and the contradictions in some areas accumulated by the emphasis on development rather than on conservation are becoming increasingly pronounced (Niu et al., 2022; Xu et al., 2022). Ecological construction goals and ecological conservation priorities vary across China. As a result, researchers often delineate regional ecological functional zones based on the spatial differentiation patterns of ecosystem services and resource environmental conditions when studying ecosystem functionality (Bai et al., 2020; Li et al., 2022). Research on ecosystem stability in China started only recently (Song et al., 2022). Huang et al. (1995) and Liu et al. (2004) were the first to theorize on ecosystem stability in China. Chen et al. (2021) reviewed the definition, spatial patterns, and influencing mechanisms of terrestrial ecosystem stability, and identified problems in current research. In addition, evaluation models (Zhong et al., 2005) and assessment methods (Cui et al., 2021; Wang et al., 2021) for regional ecological stability also suggested appropriate adjustment and control strategies for regional ecological spatial structures. Ecosystem functionality is crucial for maintaining ecosystem stability, but few studies have quantitatively assessed the stability of ecosystem functions. Promoting the steady improvement of regional ecological quality and service functions while constructing an ecological security barrier remains the core goal of ecological protection and restoration in the longer term.
As a global biodiversity conservation hotspot and a sensitive area for global climate change, the Qinghai-Tibet Plateau (QTP) is a strategic location for water resources in China and even in Asia, as well as a strategic highland of ecological security (Sun et al., 2012). Existing studies of the QTP ecological functions are often limited to the assessment of a single ecological service function (Lan et al., 2021) or to service functions in specific regions, such as Sanjiangyuan (Shao et al., 2016; Wang et al., 2016), Naqu city (Jing et al., 2022), the Yangtze River (Fu et al., 2021b), and Yushu (Liu et al., 2022). Due to the lack of analysis of the QTP ecosystems’ primary functions and their changes over a long time series, it is difficult to grasp the overall state of ecosystem functions on the Plateau. This hinders a clear understanding of the importance of ecosystem functions and their stability changes, which limits in-depth ecological protection and restoration. Moreover, there is scant research on the stability of ecosystem functions on the QTP.
Water conservation, soil conservation, wind and sand control, carbon fixation, and biodiversity conservation are the main functions of the QTP ecological security barrier (Sun et al., 2012; Fu et al., 2021a). Therefore, we conducted quantitative estimations and spatial and temporal variation analyses of the core functions of water conservation, windbreak and sand fixation, and soil conservation. The three primary objectives of our study were as follows: (1) to evaluate the importance of ecosystem functions and their stability; (2) to zone ecosystems with important ecosystem functions on the QTP; and (3) to provide necessary scientific support for the maintenance of ecosystem functions and the conservation and restoration of ecosystems in different regions of the QTP, which are essential for the sustainable development of the QTP region.

2 Materials and methods

2.1 Study area and data sources

The QTP is the highest and youngest natural geographic unit in the world with strong horizontal and vertical zonation. The topography is complex, with terrain that is high in the west and low in the east (Liu et al., 2009; Feng et al., 2020). The average annual temperature of the Plateau hinterland is below 0℃, and in most areas, even the warmest month has an average temperature of below 10℃. The ecosystem types of the QTP include grassland, forest, farmland, wetland, settlement, and desert. Grassland ecosystems dominate, accounting for 59% of the Plateau area. Forests account for 10.4% and are concentrated in the southeastern part of the Plateau. Deserts also account for 10.4% and are distributed in the northern part of the Plateau.
The five data source types for this study are as follows:
(1) Ecosystem data. The Land Use and Land Cover Change Dataset (LUCC) (Liu et al., 2014) from the Resource and Environment Science Data Center of the Chinese Academy of Sciences (Data source i); the China Annual Land Cover Dataset (CLCD) (Yang et al., 2021) based on Google Earth Engine (GEE) satellite data (Data source ii); and Chinese regional data from GlobeLand30 (Chen et al., 2015) (Data source iii) were converted into ecosystem types such as farmland, forest, grassland, wetland, town, and desert. The spatial distributions of QTP ecosystem types in 2000, 2010, and 2020 were obtained with 30-m spatial resolution. On this basis, the same spatial distribution data of LUCC and CLCD and GLobeland 30 ecosystem types were calculated (Data source iv).
(2) Soil data: The soil attribute table and spatial distribution data for the 1:1,000,000 soil type map were obtained from the Western Environmental and Ecological Sciences Data Center in China, and the soil erodibility factor was estimated by the Nomo graphic method (Cohen, 1998).
(3) Meteorological data. Daily observations of rainfall, temperature, wind speed, and other meteorological data on the QTP from 2000 to 2020 were collected at the China Meteorological Science Data Sharing Service (http://data.cma.cn), and the daily observations were synthesized to obtain monthly and annual datasets. The ANUSPLIN interpolation platform (Liu et al., 2008) was used to perform spatial interpolations based on the characteristics of different variables. ANUSPLIN selects different covariates (elevation, slope, aspect, etc.) and spline orders for the interpolation. Observational data from national meteorological reference stations and basic stations are used for validation. The interpolation schemes are evaluated, and the one with the highest accuracy is selected to obtain gridded datasets for variables such as rainfall, temperature, wind speed, etc. The spatial resolution of the data is 1 km. Finally, the method of Zhang et al. (2002) was used to estimate the rainfall erosion force.
(4) Topographic data. Digital elevation model (DEM) data were obtained from the geospatial data cloud platform (https://www.gscloud.cn), and the SRTM3v4.1 DEM dataset with 90-m spatial resolution was downloaded. The slope and slope length factors were calculated according to the core algorithms of McCool et al. (1987) and Liu et al. (1994), respectively.
(5) Nature reserve and major ecological protection and restoration project data. The nature reserve data were obtained from the National Nature Reserve Boundary Data of the Resource and Environment Science Data Center, Chinese Academy of Sciences. The data of major ecological protection and restoration projects were collected from the State Forestry and Grassland Administration website (https://www.forestry.gov.cn/).

2.2 Methods

2.2.1 Quantification of ecosystem functions

This study uses the improved parameter-based rainfall storage method (Wu, 2014) to estimate the water storage capacity of forest, grassland, wetland, and other ecosystems on the QTP. This method is suitable for estimating water storage capacity at larger spatial and temporal scales; details of the method can be found in the work of Wu (2014).
Changes in soil conservation function are assessed using the soil conservation volume, which is calculated as the difference between the potential soil erosion modulus without vegetation cover and the actual soil erosion modulus (Xiao et al., 2017). The calculation formula is as follows:
${{A}_{retention}}={{A}_{pot}}-{{A}_{act}}$
where Aretention is soil retention (t·ha-1), Apot is the potential soil erosion modulus (t·ha-1), and Aact is the actual soil erosion modulus (t·ha-1). The soil erosion modulus is calculated using the revised universal soil loss equation (RUSLE) (Wischmeier et al., 1978).
Windbreak and sand fixation refers to the role of ecosystems in reducing wind erosion of soil (Niu et al., 2022), which is affected by wind speed, soil, topography, vegetation, etc. In this study, the windbreak and sand fixation capacity is a functional evaluation indicator calculated as the difference between the potential wind erosion under bare soil conditions and the actual wind erosion under vegetation cover. The calculation formula is as follows:
$S{{L}_{sv}}=S{{L}_{s}}-S{{L}_{v}}$
where SLsv is the potential windbreak and sand fixation quantity (kg·m2), SLs is the potential soil wind erosion quantity (kg·m2), and SLv is the actual soil wind erosion quantity (kg·m2), where the soil wind erosion quantity is calculated using the revised wind erosion equation (RWEQ) (Fryrear et al., 2000; Gong et al., 2014).

2.2.2 Trend analysis

The annual trends of water conservation, soil conservation, and windbreak and sand fixation were calculated by the least squares method with the following equation:
$S=\frac{n\times \mathop{\sum }_{i=1}^{n}i\times {{X}_{i}}-\mathop{\sum }_{i=1}^{n}i\mathop{\sum }_{i=1}^{n}{{X}_{i}}}{n\times \mathop{\sum }_{i=1}^{n}{{i}^{2}}-{{\left( \mathop{\sum }_{i=1}^{n}i \right)}^{2}}}$
where S is the change trend of an ecological function; if the value is greater than 0, it indicates that the trend is increasing in this period. Conversely, a value less than 0 indicates a decreasing trend. Xi denotes the value of ecosystem services in the i-th year and n represents the total number of years.
Ecosystems carry several types of functions. However, there are certain differences in different ecosystem data, so this study only considers regions where the LUCC, CLCD, and Globeland30 data are completely consistent in ecosystem type for 2010.

2.2.3 Assessment of the importance of ecosystem functions

Ecosystem functions are affected by human activities and are also closely related to human interests. Thus, this study identifies the importance of major ecological functions based on the methodology in the Guidelines for the Delimitation of the Ecological Protection Red Line published by the Ministry of Environmental Protection of China (MEP, 2017). By taking the water conservation function as an example, the normalized water conservation values were sorted from high to low, and the cumulative values were calculated. The grid values corresponding to 50% and 80% of the cumulative water conservation values were taken as the thresholds for ecological function assessment classification. Based on these thresholds, the water conservation function is reclassified into the three levels of extremely important, important, and generally important areas, and the extremely important area is the core ecological function area.

2.2.4 Assessment of ecosystem functional stability

The ecosystem stability index formula is as follows:
$ES{{I}_{i}}=\left\{ \begin{matrix} 10 & c{{v}_{i}}\ge c{{v}_{max}} \\ 10+\left( c{{v}_{max}}-c{{v}_{i}} \right)\times \left( \frac{100-10}{c{{v}_{max}}-c{{v}_{min}}} \right) & c{{v}_{min}}<c{{v}_{i}}<c{{v}_{max}} \\ 100 & c{{v}_{i}}\le c{{v}_{min}} \\ \end{matrix} \right.$
where ESIi is the stability of a certain ecological function of a pixel i, for which a higher value indicates greater stability. cvi is the coefficient of variation for the long-term variability of a specific ecological function of pixel i, cvmax is the upper limit of the multiyear coefficient of variation of a certain type of ecological function in the study area, and cvmin is the lower limit of the same multiyear coefficient.
Each ecosystem functional stability distribution was classified by equal interval segmentation. When ESI > 95, the ecosystem function is categorized as extremely stable. When ESI is in the range of 85 to 95, it is considered stable. ESI between 75 and 85 is weakly stable, ESI between 65 and 75 is unstable, and ESI < 65 is extremely unstable. The stability of each ecosystem function was synthesized and mapped with 2000-2020 yearly CLCD data for consistent ecosystem types, where A, B, and C represent water conservation, soil conservation, and windbreak and sand fixation functions, respectively. Lowercase letters a, b, and c represent ecological function stability as weakly stable, stable, and extremely stable, and I-V represent farmland, forest, grassland, wetland, and desert ecosystem types, respectively.

2.2.5 Ecosystem functional zoning

In recent years, China has developed a nature reserve system with key ecological function areas and biodiversity conservation priority areas as important supplements in the construction of the national ecological security framework (Zhu et al., 2022). Therefore, based on the distribution of functional core areas with water conservation, soil conservation, and windbreak and sand fixation on the QTP, the type of stability assessment, and the type of ecosystem, this study considers nature reserves as important areas, and the major project areas of ecological protection and restoration on the QTP as areas with ecological problems and urgent restoration needs. The characteristics of different geographical and administrative units are then combined to divide the QTP into three major categories and 16 regions: A1-A6 represent water conservation ecosystem function zones, B1-B5 represent soil conservation ecosystem function zones, and C1-C5 represent windbreak and sand fixation ecosystem function zones. Then, the different geographical units and their core ecological function positioning, as well as the main ecological issues they face, require different measures in different regions. These measures may include adaptation or mitigation measures for climate-change sensitivity, restoration measures for human development and construction, ecological protection measures for grassland or wetland degradation, and asset management measures for ecological resources.

3 Results and analysis

3.1 Macroscale ecosystem pattern changes

From 2000 to 2020, the area of wetland ecosystems on the QTP increased by 2079.4 km2 to 11,769.8 km2, while the area of grassland ecosystems decreased by 2194.7 km2 to 9807.9 km2 (Table 1). Compared with the period of 2000 to 2010, there has been a significant decrease in grassland area from 2010 to 2020, while wetland area has significantly increased. Due to variations in ecosystem types among datasets from various sources, the trends of farmland area and forest area are difficult to characterize but dominated by decreases.
Table 1 The changes in areas of different ecosystem types on the Qinghai-Tibet Plateau (QTP) from 2000 to 2020 (km2)
Year Data source
type
Ecosystem type
Farmland Forest Grassland Wetland Town Desert Other
2000-
2010
i −147.4 −154.2 −715.7 602.5 432.1 −52.9 36.2
ii −516.6 4546.6 −1441.5 7705.5 47.1 −18980.8 8639.7
iii −75.9 241.7 −36284.7 7197.6 202.0 21188.9 7534.0
iv −420.5 −3249.8 −16470.0 1722.4 6.2 16458.5 259.6
2010-
2020
i −130.5 −106.1 −1478.9 1476.9 591.8 −553.2 201.6
ii −939.2 2499.9 −1748.5 4064.2 24.8 6901.9 −10803.3
iii 3885.9 −294.9 −83176.1 7741.2 2038.7 56565.5 13241.2
iv −269.1 −10938.3 −214780.0 7247.4 2.2 47699.7 −5776.2
2000-
2020
i −277.9 −260.4 −2194.7 2079.4 1024.0 −606.1 237.8
ii −1455.9 7046.6 −3190.0 11769.8 71.9 −12078.9 −2163.6
iii 3810.0 −53.3 −9807.9 3815.4 2240.7 77754.4 20775.2
iv −689.6 −14188.1 −231250.0 8969.8 8.4 64158.2 −5516.6
The areas with consistent ecosystem types in 2000, 2010, and 2020 (Figure 1) for the three datasets accounted for 59.9%, 59.8%, and 52.7% of the total Plateau area, respectively. The areas of farmland, grassland, and forest all decreased, while the areas of wetland, settlement, and desert all increased to different degrees.
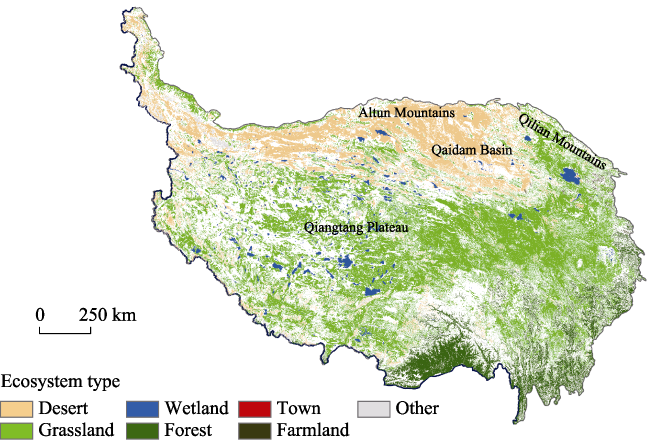
Figure 1 Spatial distribution of consistent ecosystem types from the different data sources on the Qinghai-Tibet Plateau in 2020

3.2 Ecosystem functions and spatiotemporal changes

3.2.1 Distribution characteristics of ecosystem functionality

As shown in Figure 2, we calculated the multiyear average unit area biomass of ecosystem functioning on the QTP from 2000 to 2020. The total water conservation capacity is 118.698 billion m3·a-1, and water conservation capacity per unit area is 459.38 m3·ha-1·a-1, with the overall spatial distribution characteristics of high in the southeast and gradually decreasing to low in the northwest. The extremely important and important areas of water conservation function are mainly distributed in the southeastern QTP, accounting for 12.7% and 24.6% of the total area of the QTP, respectively. The total soil conservation capacity is 12.798 billion t·a-1, and the soil conservation capacity per unit area is 49.60 t·ha-1·a-1, with high values in the southern part of the Plateau. The extremely important and important regions for soil conservation functionality account for 13.9% and 22.0%, respectively, of the total Plateau area. The total windbreak and sand fixation capacity is 2.034 billion t·a-1, with a unit area of 8.29 t·ha-1·a-1. High values are concentrated in the central part of the Plateau and low values are found in the northwestern and southeastern parts. The extremely important and important regions are in the central and western parts, with corresponding area shares of 14.2% and 25.4%, respectively.
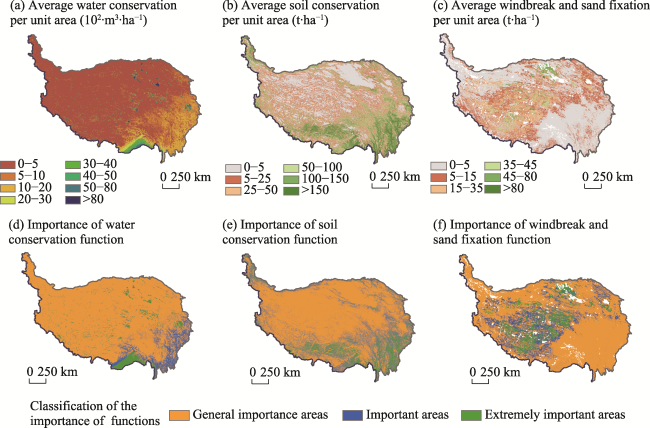
Figure 2 (a-c) Spatial distribution of annual mean mass per unit area on the Qinghai-Tibet Plateau from 2000 to 2020 for water conservation, soil conservation, and windbreak and sand fixation and (d-f) importance classifications for water conservation, soil conservation, and windbreak and sand fixation function
As the Water Tower of Asia, the water conservation core areas of the QTP ecosystem functionality are mainly distributed in the southeastern forest areas, Sanjiangyuan area, and Naqu region in the northeast of the plateau, while the soil conservation core areas are mainly distributed in the eastern part of the plateau, the Yarlung Zangbo River and its two tributaries, and the northwestern QTP. The core areas of windbreak and sand fixation ecosystem functionality are located in the Qiangtang Plateau in the northern QTP, the Qaidam Basin, the Gonghe Basin, and other desert areas (Figure 3).
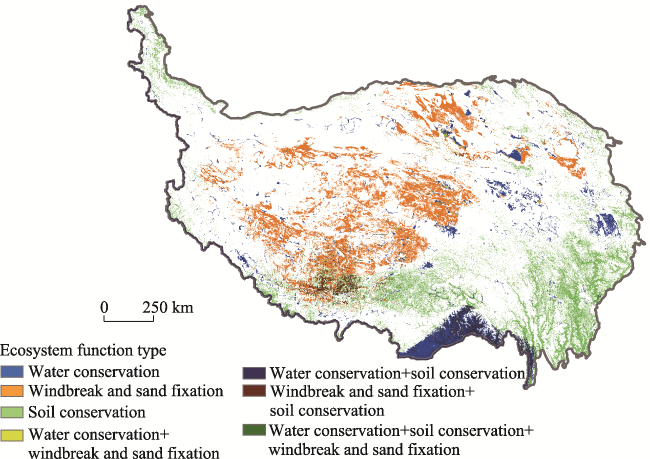
Figure 3 Spatial distributions of core regions of important ecosystem functionalities on the Qinghai-Tibet Plateau from 2000 to 2020

3.2.2 Spatial and temporal changes in ecosystem functionality

From 2000 to 2020, the water conservation functionality of the ecosystems on QTP show a fluctuating, upward trend, with an annual growth rate of 3.57 m3·ha-1·a-1 (Figure 4a). The water conservation functionality of forest is much higher than that of other ecosystem types and shows a continuous upward trend. The water conservation functionality of grassland remains unchanged, while the water conservation functionality of wetland slightly decreases (Figure 4b). The soil conservation functionality of the ecosystems decreases from 2000 to 2020, with an annual change rate of -0.16 t·ha-1·a-1 (Figure 4d). The soil conservation functionality of forest is much higher than that of other ecosystem types, fluctuating but remaining unchanged overall from 2000 to 2020, while the soil conservation functionality of grassland slightly decreases, and the changes of soil conservation function in desert and farmland are slight (Figure 4e). The overall windbreak and sand fixation functionality of the ecosystem fluctuates upward between 2000 and 2020, with an annual growth rate of 0.23 t·ha-1·a-1 (Figure 4g). The windbreak and sand fixation functionality of grassland is higher than that of other ecosystem types, reaching a minimum in 2002 and then increasing. The trends of desert and farmland are like that of grassland ecosystems, while the functionality remains relatively stable in forest (Figure 4h).
Figure 4 Statistical analysis of the annual variations about the total, different ecosystem types, and core region on the Qinghai-Tibet Plateau from 2000 to 2020 of (a-c) water conservation capacity, (d-f) soil conservation capacity, and (g-i) windbreak and sand fixation capacity
As shown in Figure 5a from 2000 to 2020, the core area of water conservation functionality of the QTP is dominated by forest, and the water conservation capacity in the southeastern QTP shows an obvious increasing trend of more than 100 m3·ha-1·a-1 although it is less than 10 m3·ha-1·a-1in most areas of the Plateau. The water conservation capacity decreases by −10 m3·ha-1·a-1 in the southeastern part of the Plateau and in some areas of the northern Plateau. The water conservation capacity of the Plateau is 444.43 m3·ha-1·a-1 from 2000 to 2010, with an overall slight upward trend and an annual change rate of about 1.10 m3·ha-1·a-1. From 2010 to 2020, the water conservation capacity is 476.69 m3·ha-1, showing a more significant upward trend. The annual change rate is 7.76 m3·ha-1·a-1, with an increase in the southeast and a decrease in the northwest.
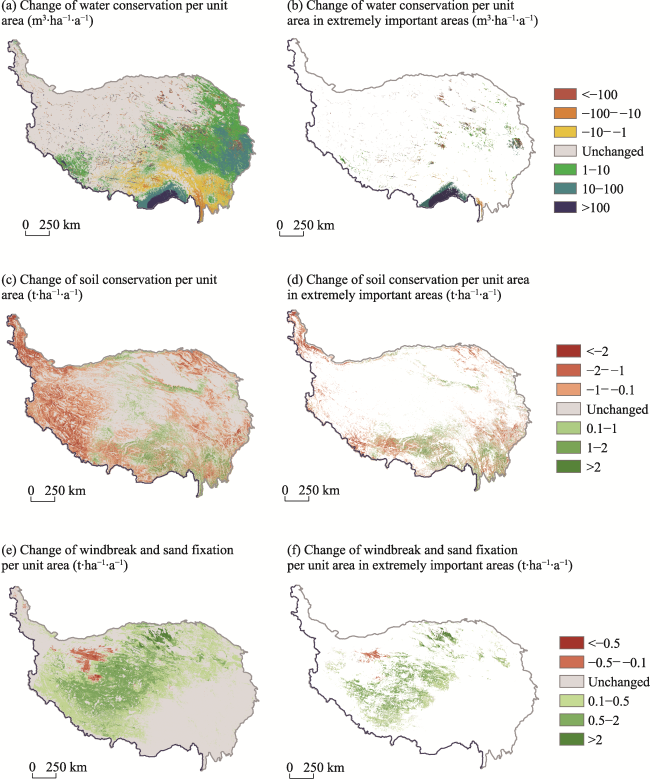
Figure 5 Spatial and temporal variations on the Qinghai-Tibet Plateau from 2000 to 2020 of (a, b) water conservation capacity overall and in extremely important areas, (c, d) soil conservation capacity overall and in extremely important areas, and (e, f) windbreak and sand fixation capacity overall and in extremely important areas
The core areas of soil conservation functionality also primarily consist of forest. The soil conservation capacity of the Yarlung Zangbo River and its two tributaries significantly increases, while that of the northwestern region of the Plateau decreases by −5 t·ha-1·a-1 (Figure 5b). From 2000 to 2010, the soil conservation capacity of the Plateau is 50.31 t·ha-1, showing a slight overall increase. The annual growth rate is 0.09 t·ha-1·a-1. The soil conservation capacity is 48.93 t·ha-1 from 2010 to 2020, showing an obvious decrease. The annual decrease is −0.49 t ha-1·a-1, with an overall increase in the southern regions and a decrease in the northwest (Figure 5c).
The core areas for windbreak and sand fixation functionality are grassland and desert. The desert windbreak and sand fixation capacity in the Qaidam Basin significantly increase to more than 2 t·ha-1·a-1. The grassland windbreak and sand fixation capacity in the Qiangtang Plateau slightly increases to 1 t·ha-1·a-1, while most areas of the Plateau are stable and unchanged. From 2000 to 2010, the windbreak and sand fixation capacity in the Plateau is 7.05 t·ha-1, with an overall slight increasing trend and an annual change rate of 0.05 t·ha-1·a-1. Windbreak and sand fixation capacity decreases in the central and western parts of the Plateau, and the rest of the Plateau remains stable and unchanging. From 2010 to 2020, the windbreak and sand fixation capacity is 9.44 t·ha-1, showing an obvious increase with an annual change rate of 0.35 t·ha-1·a-1. There are increases in the central and western parts and a stable change in the rest of the Plateau.

3.3 Ecosystem functional stability analysis and zoning

The stability of the ecosystem functions of water conservation, soil conservation, and windbreak and sand fixation are stable in most areas of the southeastern and central parts of the Plateau, as shown in Figures 6a-6f, with ESI index values greater than 85. The water conservation function in the western Plateau is unstable, with an ESI index of less than 65 in some areas. The soil conservation function in the northern Plateau is weakly stable, while the Yarlung Zangbo River and its two tributaries and the central and western parts of the Plateau are unstable. There are more regions with unstable windbreak and sand fixation function, particularly in the northwestern and northern parts of the Qiangtang Plateau. Specifically, in Nima and Minfeng counties, the ESI index values are less than 40.
Water conservation ecosystem functionality zone (A): A1 and A2 are forested areas with stable core ecosystem functionality, primarily characterized by AbⅡ and AcⅡ. In these areas it is necessary to enhance natural forest protection measures and reduce forest destruction to adapt to climate change. A3-A5 are grassland stabilization types (AbⅢ), which require strengthened comprehensive management measures for alpine grassland, including the protection and restoration of high-altitude grassland. A3 requires increased protection of alpine wetland in Gannan. A4 focuses on protecting the wetland and wildlife at the source of the Yellow River, such as Zhaling Lake, Eling Lake, and Winter Gecuo Na Lake. A5 focuses on source wetland such as Mansarugar in the upper reaches of the Yarlung Zangbo River; A6 is an ecosystem functional area for water conservation and windbreak and sand fixation. This zone requires a focus on strengthening grassland protection and restoration with measures for controlling desertification in the Qinghai Lake basin.
Soil conservation ecosystem functionality zone (B): B1 and B2 are core ecological functional zones primarily composed of forest and grassland. These zones are highly stable areas, with BcⅡ and BcⅢ as the dominant types. B3 is the extremely stable forest and grassland type of soil conservation and water conservation dual ecosystem functional area, which requires strengthening protection for natural forest and grassland, inhibiting the overuse of resources, and improving the quality of forest and grassland to enhance overall ecosystem functionality. Conversely, B4 and B5 are stable soil conservation ecosystem functional areas with grassland the main type. Efforts should be made to strengthen sand control and soil erosion control, as well as to mitigate grassland desertification.
Windbreak and sand fixation functionality zone (C): C1 and C5 are stable ecological zones primarily dominated by desert, serving as windbreak and sand fixation ecosystems. It is necessary to intensify efforts in desertification prevention and control and to improve the quality and functionality of ecological resources by adjusting the industrial structure. C2 represents an extremely stable dual-function ecological zone primarily consisting of grassland focused on windbreak and sand fixation and water conservation. In areas like the Yangtze River source, it is crucial to enhance the protection of rivers and lakes, restore “Black soil patch” degraded grassland, implement comprehensive management of desertified land, and improve grassland productivity and ecosystem functionality. C3 and C4 are stable ecological zones primarily dominated by grassland, serving as windbreak and sand fixation ecosystems. Measures such as controlling toxic and harmful grasses, rodent and pest prevention, seasonal grazing restrictions, and biological sand control should be strengthened to curb further land degradation and desertification. Efforts should be intensified to restore and manage any moderately to severely degraded grassland and meadows.

4 Discussion

The assessment and analysis in this study concluded that the water conservation and soil conservation ecosystem functions of the QTP from 2000 to 2020 gradually decreased from southeast to northwest, which is in overall agreement with the findings of Zhu et al. (2021) and Zhang et al. (2022). Although the overall water conservation and windbreak and sand fixation capacities of the QTP have increased in recent years, the overall soil conservation capacity has decreased. These trends are closely related to the changes in climate, topography, and vegetation dynamics on the QTP (Di et al., 2019; Mo et al., 2022). With the implementation of a series of ecological protection projects, the overall condition of vegetation cover on the QTP has improved (Ding et al., 2021). However, the ecological background of the QTP is extremely fragile, and the area of grassland ecosystems is still decreasing because of the rapid development of cities and towns and the intensification of human activities (Li et al., 2017; Feng and Li, 2020; Hu et al., 2022). In the future, it will be important to continue monitoring and assessing the overall status of grassland ecosystems, while also strengthening the restoration and sustainable management of degraded grassland ecosystems (Huang et al., 2020). For the core functional areas of water conservation, soil conservation, and windbreak and sand fixation on the QTP, emphasis should be placed on overall protection. In other regions, there is a need to balance the rational use of natural resources with enhanced ecological conservation efforts to maximize economic, social, and ecological benefits.
Ecosystem functional stability is influenced by both climate change and human activities. Previous studies have shown that the water conservation function is positively correlated with precipitation, temperature, and other climatic factors (Gong et al., 2017; Mo et al., 2022). Figure 6 shows that the water conservation function of the southeastern QTP is mainly extremely stable, and the stability of the forest area of the southeastern QTP is stable. The water conservation function in this region increased significantly between 2000 and 2020 (Figure 5). Precipitation and temperature in this region are extremely unstable, as depicted in Figure 8. This has increased the instability of the water conservation function. Various ecological protection and restoration projects, such as the Four Rivers watershed protection forest system and the ecological comprehensive management project in the high mountain and valley secondary forest areas of southeastern Tibet, have been implemented to enhance the stability of the water conservation function. In the western part of the QTP, specifically the Qiangtang Plateau, the stability of the water conservation function is poor. Although some ecological protection and restoration projects have been implemented, the water conservation function has not improved. This could be attributed to the highly unstable and weakly stable precipitation patterns over the years, the increase in cultivated land area, and the continuous economic growth (Wu et al., 2019).
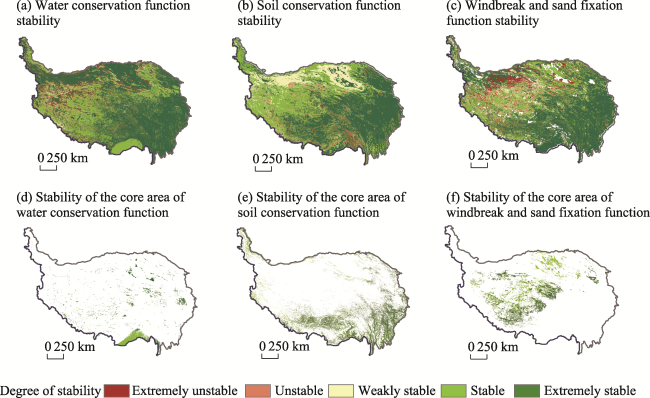
Figure 6 Spatial distributions of ecosystem functionality stability overall and in core areas on the Qinghai-Tibet Plateau from 2000 to 2020 for (a, d) water conservation, (b, e) soil conservation, and (c, f) windbreak and sand fixation
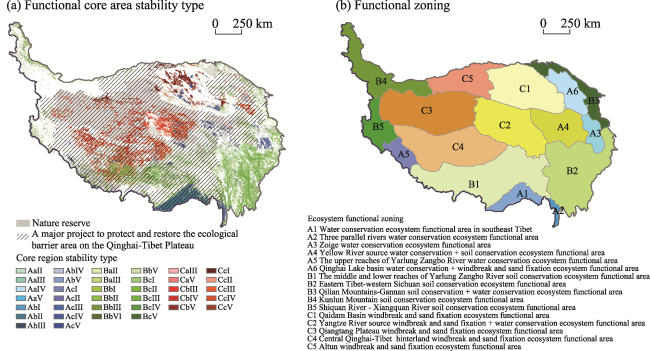
Figure 7 Zoning of ecosystem functionality on the Qinghai-Tibet Plateau
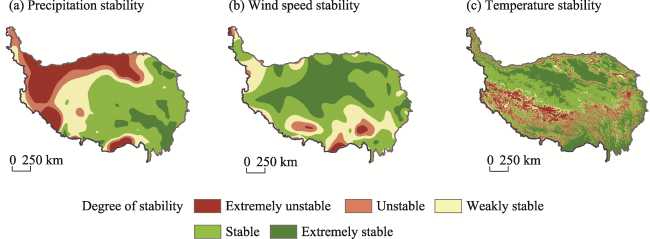
Figure 8 Spatial distribution of precipitation, wind speed, and temperature stability on the Qinghai-Tibet Plateau during 2000-2020
Precipitation is extremely unstable in the Qaidam Basin and Altun Mountains, while temperature is extremely stable. Efforts such as establishing the Qaidam Nature Reserve and implementing grassland and desert ecological protection and restoration projects have improved the ecosystem quality in these regions. However, the soil conservation function in this region is weakly stable, and the stability of the soil conservation function in desert areas is more susceptible to climate change. In other areas of the Plateau, the soil conservation function is extremely stable, which can be attributed to the implementation of various ecological protection measures. The rare occurrence of temperature and precipitation in these areas also plays a role in maintaining the stability of soil conservation function.
Compared with the stability of soil conservation function on QTP, there are more areas with unstable windbreak and sand fixation function. Specifically, regions in the northwest and north of the Qiangtang Plateau exhibit extremely unstable windbreak and sand fixation function (Figure 6). This instability is attributed to significant variations in the windbreak and sand fixation capacity in these areas, as shown in Figure 5. However, although there are noticeable variations in the windbreak and sand fixation capacity in the QTP central hinterland and the Qaidam Basin, its stability is good. This suggests that the ecological protection and restoration efforts in the alpine grassland of the Qiangtang Plateau hinterland and the desertification control measures in the Qaidam Basin have improved the stability of windbreak and sand fixation function. The influence of climatic factors such as wind speed and precipitation on the stability of the windbreak and sand fixation function are unclear. Further efforts to analyze and quantify the driving factors behind the changes in various ecosystem functions are required. This will provide detailed decision-making guidance for the ecological protection and management of the QTP.
The uncertainties in this work are as follows: First, only three main ecological functions of the QTP have been evaluated and analyzed: water conservation, soil conservation, and windbreak and sand fixation. Important ecological functions such as carbon sequestration, biodiversity conservation, climate change mitigation, and microclimate regulation, which are equally crucial for the Plateau, have not been considered. Thus, the results need to be further optimized. Second, the ecosystem types and change data evolved from land use change data. Land use change datasets have differences in their classification system, data source, classification method, and accuracy, which bring significant uncertainty to the research results. Third, previous studies on ecosystem stability have produced different results due to inconsistencies in their definitions, objects, and methods. Studies have focused on the microscale stability of populations or communities as well as the macroscale stability of the structure or quality. This study specifically focuses on functional stability at a spatial-temporal scale, thus assessing and implementing functional zoning based solely on evaluations of ecosystem functions.

5 Conclusions

Based on evaluations of water conservation, soil conservation, and windbreak and sand fixation ecosystem functions from 2000 to 2020, this study aims to understand the macroscale pattern changes in the QTP ecological system. We identified the core distribution areas of the ecosystem functions and analyzed the spatiotemporal dynamics to assess how they changed over time. Furthermore, the stability of the ecosystem functions over time was quantitatively assessed, and then stability assessment-based ecosystem function zoning of the QTP was conducted. The four main conclusions are as follows:
(1) Multiple land use datasets indicate that the macroscopic ecological system patterns on the QTP exhibited dynamic changes from 2000 to 2020. Specifically, there was a significant increase in wetland areas, varying degrees of increase in urban and desert areas, and a notable decrease in grassland areas. Farmland and forest areas decreased as well.
(2) The core areas of the water conservation, soil conservation, and windbreak and sand fixation ecosystem functions account for 12.7%, 13.9%, and 14.2%, respectively, of the QTP. The water conservation core areas are the southeastern QTP, Sanjiangyuan, Gannan, and Naqu; the windbreak and sand fixation core areas are the Qiangtang Plateau of the northern QTP, Qaidam Basin, and Gonghe Basin; while the soil conservation core areas surround the entire interior of the Plateau, especially the eastern part of the plateau, the northwest corner, and the Yarlung Zangbo River and its two tributaries.
(3) The water conservation and windbreak and sand fixation ecosystem functions on the QTP have gradually improved. The functions of water conservation in forest and windbreak and sand fixation in grassland are significantly enhanced. However, the soil conservation ecosystem function on the QTP has declined, especially in the northwest region of the Plateau, with an annual decrease rate of −5 t·ha-1·a-1.
(4) The ecosystem functions of water conservation, soil conservation, and windbreak and sand fixation on the QTP are extremely stable and stable overall in the southeastern and central parts of the Plateau. The water conservation function is unstable in the western part of the Plateau. The soil conservation function is weakly stable in the northern part of the Plateau, and the windbreak and sand fixation function is extremely unstable in the northwestern and northern parts of the Qiangtang Plateau. Based on the stability, the plateau can be divided into three categories and 16 divisions to conduct differentiated ecological protection and restoration according to local conditions. Water conservation should focus on the overall protection of forest, grassland, and wetland. Soil conservation should strengthen the protection and restoration of natural forest and natural grassland, and windbreak and sand fixation should focus on desertification prevention and control to curb the trend of grassland degradation and desertification.
[1]
Bai Y F, Zhao Y J, W Y et al., 2020. Assessment of ecosystem services and ecological regionalization of grasslands upport establishment of ecological security barriers in northern China. Bulletin of Chinese Academy of Sciences, 35(6): 675-689. (in Chinese)

[2]
Chen J, Chen J, Liao A P et al., 2015. Global land cover mapping at 30 m resolution: A POK-based operational approach. ISPRS Journal of Photogrammetry & Remote Sensing, 103(5): 7-27.

[3]
Chen J J, Zhou L, Chi Y G, 2021. Review on research of spatial pattern and influencing mechanisms of terrestrial ecosystem stability. Chinese Journal of Agrometeorology, 42(7): 552-560. (in Chinese)

[4]
Cohen J, 1988. Statistical power analysis for the behavioral sciences. Technometrics, 31(4): 499-500.

[5]
Costanza R, Darge R, Groot R et al., 1997. The value of the world’s ecosystem services and natural capital. Nature, 387(6630): 253-260.

DOI

[6]
Cui N, Yu E Y, Li S et al., 2021. Protection measures of plateau lake based on ecosystem sensitivity and importance of ecosystem function: The case of Lake Dalinor Basin. Acta Ecologica Sinica, 41(3): 949-958. (in Chinese)

[7]
Di Y P, Zhang Y J, Z H et al., 2019. Effects of changed Asian water tower on Qinghai-Tibet Plateau ecosystem: A review. Bulletin of Chinese Academy of Sciences, 34(11): 1322-1331. (in Chinese)

[8]
Ding J, Liu X Y, Guo Y C et al., 2021. Study on vegetation change in the Qinghai-Tibet Plateau from 1980 to 2015. Ecology and Environmental Sciences, 30(2): 288-296. (in Chinese)

[9]
Feng Y X, Li G D, 2020. Interaction between urbanization and eco-environment in Qinghai-Tibet Plateau. Acta Geographica Sinica, 75(7): 1386-1405. (in Chinese)

[10]
Feng Z M, Li W J, Li P et al., 2020. Relief degree of land surface and its geographical meanings in the Qinghai-Tibet Plateau, China. Acta Geographica Sinica, 75(7): 1359-1372. (in Chinese)

DOI

[11]
Fryrear W D, Bilbro D J, Saleh A et al., 2000. RWEQ: Improved wind erosion technology. Journal of Soil and Water Conservation, 55(2): 183-189.

[12]
Fu B J, Ouyang Z Y, Shi P et al., 2021a. Current condition and protection strategies of Qinghai-Tibet Plateau ecological security barrier. Bulletin of Chinese Academy of Sciences, 36(11): 1298-1306. (in Chinese)

[13]
Fu M D, Tang W J, Liu W W et al., 2021b. Ecological risk assessment and spatial identification of ecoloqical restoration from the ecosystem service perspective: A case study in source region of Yangtze River. Acta Ecologica Sinica, 41(10): 3846-3855. (in Chinese)

[14]
Gong G L, Liu J Y, Shao Q Q, 2014. Wind erosion in Xilingol League, Inner Mongolia since the 1990s using the revised wind erosion equation. Progress in Geography, 33(6): 825-834. (in Chinese)

DOI

[15]
Gong S H, Xiao Y, Zheng H et al., 2017. Spatial patterns of ecosystem water conservation in China and its impact factors analysis. Acta Ecologica Sinica, 37(7): 2455-2462. (in Chinese)

[16]
Han R, Feng C C, Xu N Y et al., 2020. Spatial heterogeneous relationship between ecosystem services and human disturbances: A case study in Chuandong, China. Science of The Total Environment, 721: 137818. DOI: 10.1016/jscitotenw.2020.137818.

[17]
Hu X Y, Wang Z F, Zhang Y L et al., 2022. Spatialization method of grazing intensity and its application in Qinghai-Tibet Plateau. Acta Geographica Sinica, 77(3): 547-558. (in Chinese)

[18]
Huang J H, Han X G, 1995. Biodiversity and ecosystem stability. Biodiversity Science, 3(1): 31-37. (in Chinese)

DOI

[19]
Huang L, Zhai J, Zhu P et al., 2020. Spatiotemporal evolution characteristics of livestock-carrying pressure in China and its implications for grassland ecosystem conservation pattern. Acta Geographica Sinica, 75(11): 2396-2407. (in Chinese)

DOI

[20]
Jing H C, Liu Y H, He P et al., 2022. Spatial heterogeneity of ecosystem services and its influencing factors in typical areas of the Qinghai-Tibet Plateau: A case study of Nagqu city. Acta Ecologica Sinica, 42(7): 2657-2673. (in Chinese)

[21]
Lan X Y, Ye C C, Wang Y et al., 2021. Spatiotemporal variation characteristics and its driving forces of water conservation function on the Qinghai-Tibet Plateau from 1995 to 2014. Acta Agrestia Sinica, 29(Suppl.1): 80-92. (in Chinese)

[22]
Li S C, Wang Z F, Zhang Y L, 2017. Crop cover reconstruction and its effects on sediment retention in the Qinghai-Tibet Plateau for 1900-2000. Journal of Geographical Sciences, 27(7): 786-800.

DOI

[23]
Li Y H, Wang X F, Chu B Y et al., 2022. Spatiotemporal ecosystem evolution and driving mechanism in the Qinghai-Tibet Plateau ecological barrier area. Acta Ecologica Sinica, 42(21): 8581-8593. (in Chinese)

[24]
Liu B Y, Nearing M A, Risse L M, 1994. Slope gradient effects on soil loss for steep slopes. Transactions of the ASAE, 37(6): 1835-1840.

DOI

[25]
Liu J H, Gao J X, Nie Y H, 2009. Measurement and dynamic changes of ecosystem services value for the Qinghai-Tibet Plateau based on remote sensing techniques. Geography and Geo-information Science, 25(3): 81-84. (in Chinese)

[26]
Liu J Y, Kuang W H, Zhang Z X et al., 2014. Spatiotemporal characteristics, patterns and causes of land use changes in China since the late 1980s. Acta Geographica Sinica, 69(1): 3-14. (in Chinese)

DOI

[27]
Liu M X, Gao Y, Wei H J et al., 2022. Profoundly entwined ecosystem services, land-use change and human well-being into sustainability management in Yushu, Qinghai-Tibet Plateau. Journal of Geographical Sciences, 32(9): 1745-1765.

DOI

[28]
Liu X W, Zhou H C, Li P et al., 2004. A conceptual analysis of ecosystem stability. Acta Ecologica Sinica, 24(11): 2635-2640. (in Chinese)

[29]
Liu Z, Li L, Tim R M et al., 2008. Introduction of the Professional Interpolation Software for Meteorology Data: ANUSPLINN. Meteorological Monthly, 34(2): 92-100.

[30]
McCool D K, Brown L C, Foster G R et al., 1987. Revised slope steepness factor for the universal soil loss equation. Transactions of the ASAE, 30(5): 1387-1396.

DOI

[31]
Ministry of Environmental Protection MEP, National Development and Reform Commission,2017-07-20. Guidelines for Delineating Red Lines for Ecological Protection. in Chinese)

[32]
Mo X G, Liu S X, Hu S, 2022. Co-evolution of climate-vegetation-hydrology and its mechanisms in the source region of Yellow River. Acta Geographica Sinica, 77(7): 1730-1744. (in Chinese)

DOI

[33]
Niu L N, Shao Q Q, Ning J et al., 2022. Ecological changes and the tradeoff and synergy of ecosystem services in western China. Acta Geographica Sinica, 77(1): 182-195. (in Chinese)

DOI

[34]
Shao Q Q, Fan J W, Liu J Y et al., 2016. Assessment on the effects of the first-stage ecological conservation and restoration project in Sanjiangyuan region. Acta Geographica Sinica, 71(1): 3-34. (in Chinese)

DOI

[35]
Song W L, Zhang H, 2022. Research status and hotspots analysis of forest ecosystem stability based on CNKI. Forestry Science and Technology, (3): 48-52. (in Chinese)

[36]
Sun H L, Zheng D, Yao T D et al., 2012. Protection and construction of the national ecological security shelter zone on Qinghai-Tibet Plateau. Acta Geographica Sinica, 67(1): 3-12. (in Chinese)

[37]
Wang H, Ma X, Du Y, 2021. Constructing ecological security patterns based on ecological service importance and ecological sensitivity in Guangdong province. Acta Ecologica Sinica, 41(5): 1705-1715. (in Chinese)

[38]
Wang Y Q, Liu Y, A Y et al., 2016. Spatial and temporal variation of soil conservation capability of vegetation in Three-river Headwaters region. Research of Environmental Sciences, 29(7): 1023-1031. (in Chinese)

[39]
Wischmeier W H, Smith D D, 1978. Predicting Rainfall Erosion Losses:A Guide to Conservation Planning. Maryland: The USDA Agricultural Handbook No.537.

[40]
Wu D, 2014. Research on water conservation services of major terrestrial ecosystems in China[D]. Beijing: University of Chinese Academy of Sciences. (in Chinese)

[41]
Wu Y J, Zhao X S, X Y et al., 2019. Comprehensive evaluation and spatial-temporal changes of eco-environmental quality based on MODIS in Tibet during 2006-2016. Acta Geographica Sinica, 74(7): 1438-1449. (in Chinese)

DOI

[42]
Xiao Q, Hu D, Xiao Y, 2017. Assessing changes in soil conserved ecosystem services and causal factors in the Three Gorges Reservoir region of China. Journal of Cleaner Production, 163: 172-180.

[43]
Xu C, Jiang Y N, Su Z H, et al., 2022. Assessing the impacts of Grain-for-Green Programme on ecosystem services in Jinghe River basin, China. Ecological Indicators, 137: 108757. doi: 10.1016/j.ecolind.2022.108757.

[44]
Yang J, Huang X, 2021. The 30m annual land cover dataset and its dynamics in China from 1990 to 2019. Earth System Science Data, 13(8): 3907-3925.

DOI

[45]
Zhang C S, Xie G D, Liu C L et al., 2022. Evaluation of water conservation of China’s ecosystems based on benchmark. Acta Ecologica Sinica, 42(22): 1-11. (in Chinese)

[46]
Zhang W B, Xie Y, Liu B Y, 2002. Rainfall erosivity estimation using daily rainfall amounts. Scientia Geographica Sinica, 22(6): 705-711. (in Chinese)

DOI

[47]
Zhong C, He Z Y, Liu S Z, 2005. Evaluation of eco-environmental stability in Tibet. Scientia Geographica Sinica, 25(5): 573-578. (in Chinese)

DOI

[48]
Zhu D Z, Chu L, Ma S et al., 2021. Tradeoff and synergistic relationship among ecosystem services. Research of Soil Water Conservation, 28(4): 308-315. (in Chinese)

[49]
Zhu H S, Zhai J, Hou P et al., 2022. The protection characteristics of key ecological functional zones from the perspective of ecosystem service trade-off and synergy. Acta Geographica Sinica, 77(5): 1275-1288. (in Chinese)

DOI

Outlines

/