Research Articles

Risk posed to vegetation net primary productivity by drought on the Mongolian Plateau

  • REN Jinyuan , 1 ,
  • GUO Xiaomeng 2 ,
  • TONG Siqin , 1, 3, * ,
  • BAO Yuhai 1, 4 ,
  • BAO Gang 1, 4 ,
  • HUANG Xiaojun 1, 4
Expand
  • 1. College of Geographical Science, Inner Mongolia Normal University, Hohhot 010022, China
  • 2. Institute of Grassland Research of CAAS, Hohhot 010000, China
  • 3. Inner Mongolia Key Laboratory of Disaster and Ecological Security on the Mongolian Plateau, Inner Mongolia Normal University, Hohhot 010022, China
  • 4. Inner Mongolia Key Laboratory of Remote Sensing and Geographic Information Systems, Inner Mongolia Normal University, Hohhot 010022, China
* Tong Siqin (1991-), Associate Professor, E-mail:

Ren Jinyuan (1995-), PhD Candidate, E-mail:

Received date: 2023-03-14

  Accepted date: 2023-07-03

  Online published: 2023-11-15

Supported by

Natural Science Foundation of Inner Mongolia(2023MS04001)

National Natural Science Foundation of China(42061070)

National Natural Science Foundation of China(42261144746)

Program for Young Talents of Science and Technology in Universities of Inner Mongolia Autonomous Region(NJYT23018)

Innovative Project of Young “Grasslands Talents”

Fundamental Research Funds for the Inner Mongolia Normal University(2022JBBJ013)

Fundamental Research Funds for the Inner Mongolia Normal University(2022JBTD011)

Abstract

The increasing frequency of recent droughts has an adverse effect on the ecosystem of the Mongolian Plateau. The growth condition of NPP is considered an indicator of the ecological function. Therefore, identifying the relationship between NPP and drought can assist in the prevention of drought-associated disasters and the conservation of the ecological environment of the Mongolian Plateau. This study used the Carnegie-Ames-Stanford Approach (CASA) model to simulate the NPP capacity of the Mongolian Plateau between 1982 and 2015, as well as drought indicators (drought probability, vulnerability, and risk) to explore the drought risk of NPP. The findings pointed to an overall increase in NPP with regional variances; however, the NPP rate in Inner Mongolia was considerably higher than that in Mongolia. The standardized precipitation evapotranspiration index (SPEI) showed an overall downward trend, with Inner Mongolia experiencing a substantially lower rate of decline than Mongolia. The areas most likely to experience drought were primarily in the center and north while the areas with the highest drought vulnerability were primarily in the northeast, center, and southeast. Mongolia showed a higher probability of drought compared to Inner Mongolia. Drought-prone regions of the Mongolian Plateau increased during the 21st century while drought-vulnerable areas increased and shifted from north to south. Alpine grasslands and coniferous forests were least vulnerable to drought, while other vegetation types experienced temporal variation. In the 21st century, the primary determinants of drought risk shifted from precipitation and the normalized difference vegetation index (NDVI) to temperature and relative humidity.

Cite this article

REN Jinyuan , GUO Xiaomeng , TONG Siqin , BAO Yuhai , BAO Gang , HUANG Xiaojun . Risk posed to vegetation net primary productivity by drought on the Mongolian Plateau[J]. Journal of Geographical Sciences, 2023 , 33(11) : 2175 -2192 . DOI: 10.1007/s11442-023-2171-1

1 Introduction

According to the Sixth Assessment Report (AR6) of the Intergovernmental Panel on Climate Change (IPCC), drought is a significant threat to terrestrial ecosystems and can cause irreversible harm to ecosystems and economic environments (Stocker et al., 2013; Wang et al., 2022). The global arid zone has increased by ±2.61 × 10⁶ km2 over the last 50 years and will probably reach 5.8 × 10⁶ km2 by 2100, representing more than half of the total global land area (Chen et al., 2022). Climate change increases the frequency and severity of extreme events, including the unpredictability of drought development (AghaKouchak et al., 2014; Ebi et al., 2015; Zhang et al., 2019a). Numerous recent studies on drought conditions in various arid regions have revealed the damage caused by drought to both ecosystems and social environments (Wang et al., 2012; Shi et al., 2019; Xu et al., 2019b; Zhang et al., 2019b), thereby posing new challenges to global ecosystems (Dai et al., 2004). However, these researchers have only studied drought in various regions in terms of its trends and effects, paying little attention to its influence on the net primary productivity (NPP) of the vegetation.
The NPP represents the quantity of organic matter remaining after subtracting the amount of energy required for respiration (Payne et al., 2019). It is a crucial indicator of the functional status of an ecosystem (Crabtree et al., 2009; Jiang et al., 2021; Wei et al., 2022). Various models have been used to estimate NPP (e.g., the Biome BioGeoChemical Cycles, BGC [BIOME-BGC], Carnegie-Ames-Stanford Approach [CASA], and Global Production Efficiency [GLO-PEM] models), showing that different regions of the globe have different adaptations, as assessed by these models (Zhang et al., 2006; Gao et al., 2016; Kang et al., 2019). The CASA is a model based on the principle of light energy utilization that has been extensively used in the study of NPP on the Mongolian Plateau (Bao et al., 2016; Guo et al., 2021). Meanwhile, various studies have focused on the response of NPP to climate and then analyzed the other aspects of its multi-year change trends (Chen et al., 2016; Guo et al., 2020). However, these studies have analyzed variations in NPP and their effects separately and have only rarely investigated the NPP response based on drought.
Global interest in the connections between climate change and ecosystems has increased with increasing global temperatures (Jansson et al., 2020; Ding et al., 2022). Climate change will lead to more frequent and severe high-temperature droughts. Drought-related changes, such as degradation, mortality, and slower growth (Anderegg et al., 2015; Du et al., 2019), may endanger the survival of highland grasslands, arid plain grasslands, and rain-fed agricultural areas (Ding et al., 2020). Therefore, evaluating the drought risk of NPP is an essential step to mitigate the drought conditions linked to NPP.
Drought risk is an essential indicator for measuring the drought status in a region, and it may be described as the potential risk produced by drought in an area with respect to the natural environment and social production, amongst other factors. Drought probability and vulnerability are considered important factors in the evaluation of drought risk (Pachauri et al., 2014). A previous study indicates that the effects of climate change will increase global drought conditions (Elkouk et al., 2022). Zhao et al. (2020) studied drought risk in China using indicators, such as drought exposure and vulnerability, and revealed that locations with a history of drought are more likely to experience high drought risk in the future. Li et al. (2020) investigated the drought risks to several vegetation types in northeastern China, with their findings indicating that drought provides a risk to vegetation and puts it at a moderate to high risk of drought. Studies have also evaluated the influence of future droughts on the total primary production of vegetation on a global scale, and it can be inferred that extreme droughts may exert a serious impact on the global carbon cycle (Xu et al., 2019a). However, these studies focused solely on drought risk in various regions, rather than the impact of drought risk on vegetation.
The Mongolian Plateau, which has experienced large temperature increases in recent years, is an arid and semi-arid environment (Nandintsetseg et al., 2007; Lu et al., 2009; Sternberg et al., 2011). It is also experiencing increasingly severe drought (Li et al., 2012). Previous research found that climate change may have little influence on vegetation growth on the Mongolian Plateau (Liu et al., 2019). The Mongolian Plateau is particularly vulnerable to drought, which has become a widespread problem. Simultaneously, the region has experienced an increase in aridity during the 21st century (Cao et al., 2020; Pei et al., 2020). The prevalence and severity of drought risk across the Mongolian Plateau have been established by previous research (He et al., 2021; Nandintsetseg et al., 2021). The occurrence of drought is highly correlated with the growth state of vegetation (Breshears et al., 2005; Vicente-Serrano et al., 2013).
Therefore, there is an increasingly urgent need to identify the drivers of drought and to develop drought-mitigating measures (Dai et al., 2011). The present study captures the ecological vulnerability, and based on the characteristics of the arid and semi-arid region of the Mongolian Plateau. The main objectives were (1) the identification of multi-year trends of NPP and drought changes; (2) determination and analysis of drought risk by calculating drought probability and drought vulnerability; (3) revealing the impact of drought on the Mongolian Plateau NPP and its driving factors. This study will fill the gap in drought risk studies of NPP on the Mongolian Plateau and improve the overall understanding of vegetation and drought changes on the Mongolian Plateau, as well as enhance regional disaster risk understanding and prevention management.

2 Data and methods

2.1 Study area

The Mongolian Plateau is located on the Eurasian continent and includes Mongolia and northern China. The terrain of the Mongolian Plateau declines from west to east and topographic features such as mountains and plateaus become less prominent. The study area lies within a temperate continental climate zone, characterized by a large diurnal temperature difference, abundant sunshine, and precipitation decreases from east to west. The Mongolian Plateau has diverse vegetation, and the land cover can be categorized into 10 types (Figure 1): (1) shrub; (2) sandy land; (3) cropland; (4) coniferous forest; (5) meadow steppe; (6) broadleaf forest; (7) desert steppe; (8) alpine grassland; (9) typical steppe; (10) gobi desert.
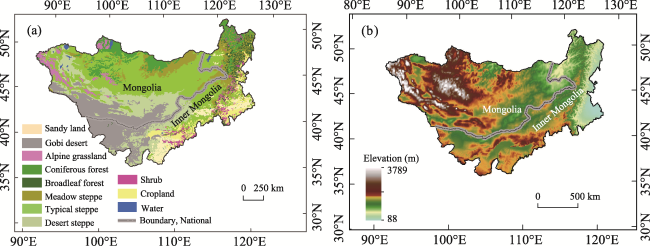
Figure 1 Map of different vegetation types, geographical location (a), and elevation (b) of the Mongolian Plateau

2.2 Data sources

The CASA model is primarily driven by the Normalized Difference Vegetation Index (NDVI), monthly mean temperature, monthly solar radiation, and monthly precipitation data. The present study obtained NDVI data from the Global Inventory Monitoring and Modeling System (GIMMS) NDVI dataset generated by several National Oceanic and Atmospheric Administration (NOAA) Advanced Very High-Resolution Radiometer (AVHRR) sensors with a temporal resolution of 15 days, for the global 1/12 degree latitude/grid (https://ecocast.arc.nasa.gov/data/pub/gimms/3g.v1/, 20 August 2023). Monthly mean temperature, precipitation, solar radiation, and other meteorological data for 1982-2015 were obtained from the China Integrated Meteorological Information Service System (http://data.cma.cn/) and the Mongolian Meteorological Service. The MODIS NPP data were derived from the MOD17A3HGF dataset provided by NASA from 2000-2015 with spatial and temporal resolutions of 1 yr and 500 m, respectively, for the validation of the simulation effects of the CASA model.
ArcGIS was utilized to spatially interpolate and drive the CASA model from spatial scales to achieve strong compatibility of individual data from both temporal and spatial points of view. Because of the low number of meteorological stations, data from 1982 to 2015 were selected for the calculation and then interpolated using the kriging method. The description of NPP is not reliable in the gobi desert and water body areas where the amount of vegetation is limited. Therefore, these areas were excluded from the NPP research. All data were pre-processed and consolidated to an annual scale, which was then used to calculate drought probability, vulnerability, and risk.

2.3 Methodology

2.3.1 Carnegie-Ames-Stanford Approach (CASA) model

The CASA model calculated NPP as:
$NPP\left( x,t \right)=APAR\left( x,t \right)\times \varepsilon \left( x,t \right)$,
where APAR(x,t), ε(x,t), and NPP(x,t) are the photosynthetically absorbed active radiation, the efficiency of actual light energy, and the net primary productivity of vegetation, respectively, where t is the month and x is the geographical location.
$APAR\left( x,t \right)=0.5SOL\left( x,t \right)\times FPAR\left( x,t \right)$,
$\varepsilon \left( x,t \right)={{T}_{\varepsilon 1}}\left( x,t \right)\times {{T}_{\varepsilon 2}}\left( x,t \right)\times {{W}_{\varepsilon }}\left( x,t \right)\times {{\varepsilon }_{\text{max}}}$,
where 0.5 denotes the ratio of photosynthetically active radiation available to vegetation, SOL(x,t) is the total solar radiation, FPAR is the fraction of photosynthetically active radiation absorbed by the vegetation canopy, Tε1(x,t) and Tε2(x,t) represent the effect of stress on the utilization of light energy by different vegetation types in the image element under low (high) temperature conditions, respectively. The water stress effect factor of light energy efficiency is expressed as Wε(x,t) with a maximum value of ε (Bao et al., 2016).

2.3.2 Standardized Precipitation Evapotranspiration Drought Index

Vicente-Serrano et al. (2010) proposed the Standardized Precipitation Evapotranspiration Index (SPEI) as an indicator for recognizing and measuring meteorological drought situations. The SPEI value is proportional to the moisture conditions. In this study, a drought situation was defined as an SPEI value of < −1. The steps used for calculating the SPEI are shown below.
(1) Calculation of the climatic water balance:
${{D}_{i}}={{P}_{i}}-PE{{T}_{i}}$,
$PET=16K{{\left( \frac{10{{T}_{i}}}{H} \right)}^{a}},$
where P represents the precipitation, Ti is the monthly mean temperature, PET denotes potential evapotranspiration, K is a revised coefficient determined by the latitude and month, H is the annual heat index, and a is a constant. When Ti≤0, Hi = 0, PETi = 0.
(2) Construction of cumulative moisture gain/loss sequences:
$X_{i,j}^{k}=\sum\nolimits_{l=13-k+j}^{12}{{{D}_{i-1,l}}~+\sum\nolimits_{l=1}^{j}{{{D}_{i,l}}}}$(j<k),
$X_{i,j}^{k}=\sum\nolimits_{l=i-k+1}^{j}{{{D}_{i,l}}~\left( j\ge k \right)}$,
where $X_{i,j}^{k}$ is the sum of the k months before the jth month of the ith year and the water deficit of the current month when the time scale is k months.
(3) A log-logistic probability density function was used to fit the $X_{i,j}^{k}$ data series:
$f\left( x \right)=\frac{\beta }{\alpha }{{\left( \frac{x-\gamma }{\alpha } \right)}^{\beta -1}}{{\left[ 1+\left( \frac{x-\gamma }{\alpha } \right) \right]}^{-2}}$,
where α, β, and γ are the scale, shape, and origin parameters, respectively, f(x) is the probability density function, while the cumulative probability at a given time scale was determined according to the following equation:
$F\left( x \right)={{\left[ 1+{{\left( \frac{\alpha }{x-\gamma } \right)}^{\beta }} \right]}^{-1}}$,
(4) The F(x) was normalized to obtain the corresponding SPEI values:
$SPEI=W-\frac{{{C}_{0}}+{{C}_{1}}W+{{C}_{2}}{{W}^{2}}}{1+{{d}_{1}}W+{{d}_{2}}{{W}^{2}}+{{d}_{3}}{{W}^{3}}}$,
$W=\sqrt{-2\ln \text{P}}$,
$\left\{ \begin{matrix} P=F\left( x \right)~~~~~~\left( p\le 0.5 \right) \\ P=1-F\left( x \right)\left( p\ge 0.5 \right) \\ \end{matrix} \right.$,
where C0 = 2.515517, C1 = 0.802853, C2 = 0.010328, d1 = 1.432788, d2 = 0.189269, and d3 = 0.001308. SPEI has time scale characteristics (1, 3, 6, 12, 24, etc.); the present study focused on the examination of SPEI on a 12-month scale (SPEI-12).

2.3.3 Assessment of the risk of drought to NPP

The drought risk assessment technique utilized in this study was based on Van Oijen et al. (2013) and He et al. (2021), with the specific procedures described below:
(1) The “ksdensity” function in MATLAB 2021a was used to calculate the annual SPEI drought probability on an image-by-image basis, using the mean SPEI value for each of the 12 months of the year. The advantage of “ksdensity” is that the probability density for a given threshold (e.g., SPEI ≤ −1) can be calculated for a range of threshold values without prior knowledge of the probability distribution function that best fits the threshold.
(2) NPPv: the drought vulnerability of NPP was calculated by subtracting the detrended NPP of all drought-free years (SPEI-12 > −1.0) was subtracted from the detrended NPP of all drought years (SPEI-12 ≤ −1.0) image-by-image.
(3) The NPP drought probability and drought vulnerability were multiplied together to determine the drought risk to the NPP.
$NP{{P}_{r}}={{P}_{d}}\times NP{{P}_{v}}$
where NPPr is the drought risk of NPP, Pd is the drought probability, and NPPv is the vulnerability of NPP to drought.

2.3.4 Sen’s slope

Sen’s trend degree was utilized in the present study to quantify the magnitude of the time series trend, which was calculated as:
β=Median$\left( \frac{SPE{{I}_{j}}-SPE{{I}_{i}}}{j-i} \right),\forall j>i,$
where β is the Sen trend degree, which was used to characterize the degree of rise and fall of {SPEIi} (when β > 0 and β < 0 {SPEIi} shows an upward and a downward trend, respectively), Median represents the median function and 1 < j < i < n.

2.3.5 Redundancy analysis

In redundancy analysis, the ranking axis is the linear combination of explanatory variables (environmental variables). The objective of the analysis is to identify the linear combination of explanatory variables which most adequately explains the variance of the response variable matrix. The primary benefit of this method is the ability to sustain the contribution of each variable to the environment independently.
Canoco 5 software was used to conduct redundancy analysis in the current study. The correlation between the variable (A, B) and the environmental variable X was estimated by the vertical projection of the variable arrow (A, B) onto a line encompassing the environmental variable arrow (X2). The distance that the projection point dropped in the direction of the arrow was proportional to the strength of the correlation, with projection points close to the origin of the coordinates (zero point) indicating a correlation close to zero and projection points lying in the opposite direction indicating a negative correlation (Figure 2a). Sample symbols can be projected vertically onto a particular environmental variable line to approximate the value of a species in a single sample. In a centering-by-variable analysis, the sample points projected onto the coordinate origin were projected as samples corresponding to the mean of that variable (Figure 2b).
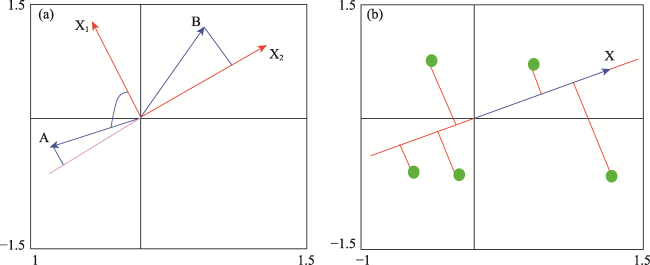
Figure 2 Example diagrams for redundancy analysis, different environmental variables (a), and the sample symbols (b)

3 Results

3.1 Evaluation of the simulated NPP

During the evaluation, the pixel-scale simulations of models were extracted at the same spatial resolution and compared using linear regression, with 800 corresponding pixel values selected for comparison. The comparison yielded a determination coefficient R2 of 0.585 (p < 0.01) for the CASA model simulating NPP, indicating that it could simulate NPP for the Mongolian Plateau with acceptable accuracy (Figure 3a). According to the value of SPEI-12, all image elements were divided into two categories, namely, zones with and without drought. This enabled additional verification of the simulation accuracy of the CASA model. The 402, 398 drought (SPEI-12≤ −1.0) and non-drought (SPEI-12 > −1.0) pixels yielded R2 values 0.736 (p < 0.01) and 0.803 (p < 0.01) for simulated NPP relative to MODIS NPP, respectively (red and dots, respectively, in Figure 3b). These results confirmed that the CASA model was more capable of simulating NPP across the entire study area or in drought-affected and non-drought-affected regions.
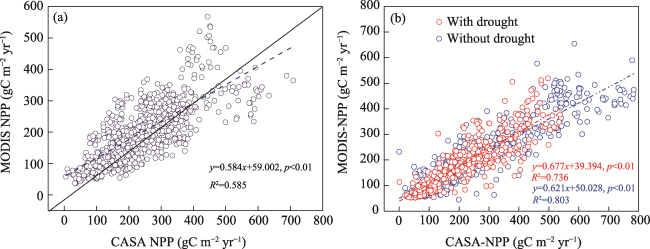
Figure 3 Comparison of the CASA model pixel-scale simulations for average annual scale (a), drought and without drought conditions (b). (Red: with drought, SPEI-12 ≤ −1.0; Blue: without drought, SPEI-12 > −1.0)

3.2 Spatiotemporal changes to NPP and SPEI on the Mongolian Plateau

The annual mean NPP increased in the Mongolian Plateau, Inner Mongolia, and Mongolia but the increases were not statistically significant (Figure 4a). The highest increase in NPP occurred in Inner Mongolia, while the increase in Mongolia was only half that observed for Inner Mongolia. The maximum and minimum NPP in both Inner Mongolia and the Mongolian Plateau occurred in 2014 and 1983, respectively, whereas the maximum and minimum NPP in Mongolia occurred in 2007 and 2013, respectively. Interannual NPP trends in Inner Mongolia and the Mongolian Plateau were similar, although the trends in Mongolia differed slightly from those for the entire Mongolian Plateau.
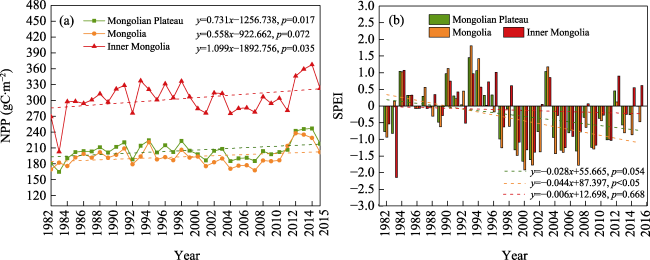
Figure 4 Temporal variations in NPP (a) and SPEI (b) for the Mongolian Plateau
There were significant differences in trend of SPEI decline from large to small, namely Mongolia (0.044 yr-1), Mongolian Plateau (0.028 yr-1), and Inner Mongolia (0.006 yr-1), with Mongolia experiencing the most significant decrease and Inner Mongolia experiencing the smallest and non-significant decrease (Figure 4b). The SPEI showed that the driest and wettest seasons on the Mongolian Plateau occurred in 2000 and 1994, respectively. Inner Mongolia and Mongolia experienced their driest periods during 1983 and 2000, respectively, while their wettest periods occurred in 1984 and 1993, respectively. The year 1997 represented a turning point in NPP for both the entire Mongolian Plateau and for the individual Mongolia and Inner Mongolia regions, with most SPEI values prior to 1997 > −0.5, suggesting wetness and those after 1997 were < −0.5, indicating drought.
The current study examined spatial patterns in NPP and SPEI over 34 years by extracting trends onto the 0.5° × 0.5° pixels. Figure 5 shows the regions with significant variations (p < 0.05) in NPP and SPEI (indicated as triangles in the figure). The findings revealed a general increase in NPP (Figure 5a), with a maximum rate of 8.7 gC m-2 yr-1 in the southeastern region of Inner Mongolia, and the greatest reduction in NPP in northern Mongolia. Across the study region, 83.72% of the regions exhibited an increase in NPP, with 23.51% showing a considerable increase, primarily in the northwestern, central, and southeastern regions. Of the regions analyzed, 16.28% indicated a decrease in NPP, with a significance threshold of 2.23%. These regions were located in the southeastern and northern parts of the Mongolian Plateau.
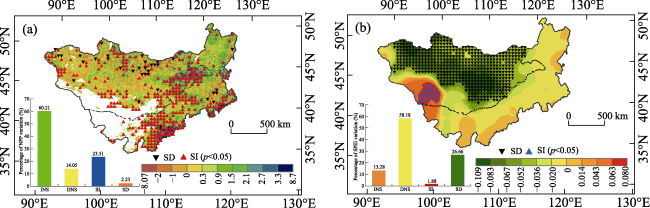
Figure 5 Spatial variations in NPP (a) and SPEI (b) (SI: significant increase; SD: significant decrease; INS: non-significant increase; DNS: non-significant decrease)
The SPEI of the Mongolian Plateau exhibited a general decreasing trend, with the highest decreasing trend of 0.109 yr-1 in the central Mongolian Plateau, with only a few areas exhibiting increasing trends (Figure 5b). The western area and a small portion of the southern Mongolian Plateau showed the highest rates of increase, reaching a maximum of 0.080 yr-1 in these regions. Areas with increasing SPEI trends on the Mongolian Plateau accounted for 15.16% of the study area, with regions with significantly increasing trends in SPEI accounting for 1.88% of the study area, most of which were located on the western Mongolian Plateau. Regions with decreasing SPEI trends accounted for 84.84% of the study area, with those with significant trends in northern and central Mongolia accounting for 26.66% of the total study area.
Overall, the NPP showed significant rates of increase in Inner Mongolia while the NPP also increased on the Mongolian Plateau. The rate of SPEI decrease in Mongolia was significantly greater than that in Inner Mongolia, with significant decreases in SPEI on the Mongolian Plateau occurring throughout Mongolia. This result indicated a trend of greater drought in Mongolia compared with Inner Mongolia.

3.3 Distribution of drought risk of NPP on the Mongolian Plateau

Figure 6a illustrates the spatial distribution of drought probability (SPEI-12 ≤ −1.0) on the Mongolian Plateau from 1982 to 2015. This distribution was determined by fitting an image-by-image SPEI to each pixel using a probability distribution function over an extensive time series. Throughout the 34-year study period, the average probability of multi-year drought on the Mongolian Plateau was 0.30 (Table 1). Figure 6a shows that the probability of drought varied considerably between regions, with a maximum of 0.52 and a minimum of 0.08. Overall, regions with a significant probability of drought were located mostly in central Mongolia and only a small part of the northern Mongolian Plateau. In contrast, the locations with the lowest drought probability were primarily located in the southwest.
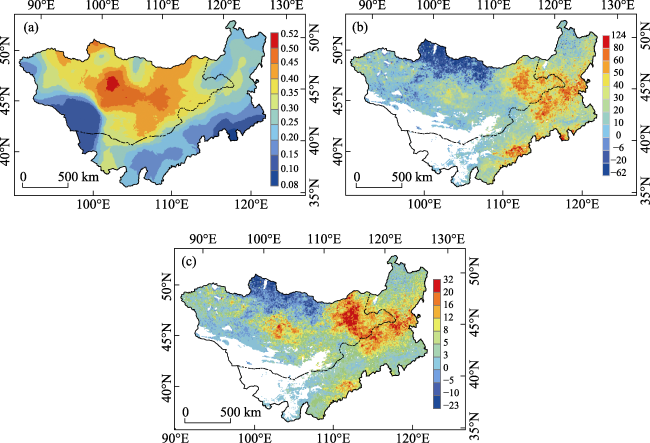
Figure 6 Drought probability (a), vulnerability (b), and risk (c) of NPP on the Mongolian Plateau during 1982- 2015
Table 1 Variations of net primary productivity (NPP) and each drought index in different vegetation zones across various periods (I: 1982-2015; II: 1982-1999; III: 2000-2015)
Vegetation type NPP Drought probability Drought vulnerability of NPP Drought risk of NPP
Coniferous forest 381.12 380.06 382.32 0.35 0.19 0.54 -0.02 8.97 -11.41 -0.41 1.62 -6.86
Broadleaf forest 638.74 642.10 634.96 0.26 0.21 0.31 38.34 72.91 11.90 9.60 16.31 2.76
Meadow steppe 374.12 376.94 370.96 0.32 0.20 0.47 26.22 27.29 9.83 8.07 5.76 3.83
Typical steppe 221.44 221.14 221.78 0.35 0.18 0.53 22.94 13.18 12.89 7.47 2.35 5.20
Desert steppe 84.55 81.19 88.32 0.31 0.18 0.46 12.44 14.32 10.94 3.84 2.56 4.58
Shrub 244.32 243.10 245.68 0.20 0.17 0.24 30.10 21.52 27.03 6.22 4.11 6.11
Sandy land 213.66 207.49 220.61 0.19 0.15 0.22 28.27 10.24 26.91 5.31 1.66 6.01
Cropland 268.67 263.07 274.97 0.19 0.16 0.21 37.63 16.85 37.05 7.15 3.28 7.57
Alpine grassland 203.94 202.14 205.96 0.29 0.20 0.40 9.31 6.46 3.59 2.02 0.84 -0.06
Mongolian Plateau 239.04 237.84 240.39 0.30 0.18 0.43 20.34 16.50 12.04 5.80 3.15 3.78
Figure 6b depicts the regional variation in the vulnerability of NPP on the Mongolian Plateau from 1982 to 2015. The drought vulnerability of NPP was more than 50% over half of the Mongolian Plateau, especially in the east and southeast. The drought resulted in a significant decrease in NPP in these regions, as demonstrated by the highest susceptibility of NPP to the drought of 124 gC m-2 yr-1. Northern Mongolian Plateau areas with low vulnerability of NPP to drought ranging from 20 gC m-2 yr-1 to 62 gC m-2 yr-1 suggested that NPP in these areas was less influenced by drought than in other areas.
From 1982 to 2015, the average risk of drought to NPP on the Mongolian Plateau was 5.8 (Figure 6c; Table 1). The drought risk of NPP on the Mongolian Plateau varied between −23 to 32. The central, northeastern, and several parts of the southeastern Mongolian Plateau experienced the highest NPP drought risk of 32, whereas the drought risk index dropped below 0 in the north and some parts of the northeast, with the lowest NPP drought risk of −23, indicating that these areas were less threatened by drought. Overall, the drought risk of NPP on the Mongolian Plateau decreased gradually from south to north and from east to west during 1982-2015.
The period 1982-2015 was then divided into two sub-periods to examine variations in drought risk of NPP, namely, (1) 1982-1999 (period II) and (2) 2000-2015 (period III). There was significant spatial heterogeneity in the probability of drought between the two periods, with the average probability of drought in period III on the Mongolian Plateau being 0.43 (Figure 7b; Table 1), which was significantly higher than the average probability of drought in period II, which was 0.18 (Figure 7a; Table 1). The probability of drought during period II exhibited a narrow range between 0.08 and 0.30, with the maximum probabilities occurring in the northern, central, and northeastern regions of the Mongolian Plateau, and the lowest probabilities in the southeast. In contrast, the northern and central regions of the Mongolian Plateau exhibited the highest probabilities of drought during period III, while the southern and southeastern regions exhibited the lowest. Overall, the probability of drought ranged from 0.82 to 0.02.
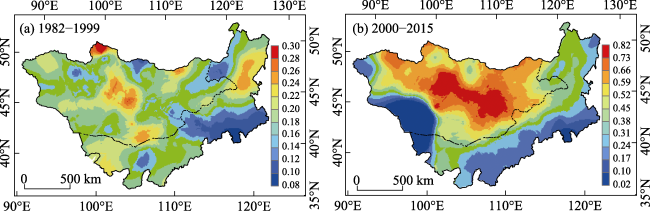
Figure 7 Drought probability on the Mongolian Plateau during 1982-1999 (a) and 2000-2015 (b)
Drought vulnerability was determined for two time periods using SPEI in the current study. The average drought vulnerability for periods II and III were, respectively, found to be 16.50 gC m-2 yr-1 (Figure 8a; Table 1) and 12.04 gC m-2 yr-1 (Figure 8b; Table 1). Periods II and III exhibited the highest drought vulnerability values of 237 gC m-2 yr-1 and 135 gC m-2 yr-1, respectively, while the lowest values were recorded as −127 gC m-2 yr-1 and −63 gC m-2 yr-1, respectively. The northeastern region had the greatest vulnerability to drought during period II, while the north and southeast had the least. The spatial distributions of drought vulnerability varied between periods III and II, with high values in the southeast of the Mongolian Plateau during period III and low values in the north.
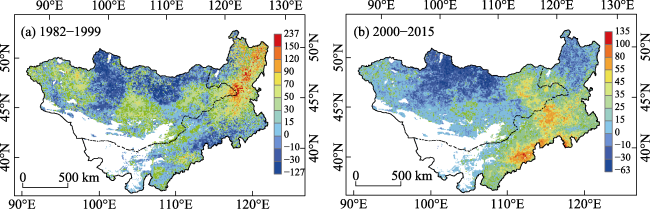
Figure 8 The drought vulnerability of NPP on the Mongolian Plateau during 1982-1999 (a) and 2000-2015 (b)
Drought probability and drought vulnerability contributed to different spatial distributions of drought risk between the two periods. The mean drought risks for periods II and III were observed to be 3.15 (Figure 9a; Table 1) and 3.78 (Figure 9b; Table 1), respectively. The maximum drought risk values for periods II and III were 55 and 48, while the lowest values were −24 and −45, respectively. The high drought risk values in period II were primarily found in the northeastern Mongolian Plateau, whereas lower values were primarily observed in the north and southeast. The high drought risk values in phase III were primarily found in the center, northeast, and southeast, whereas drought risk was the minimum in the north.
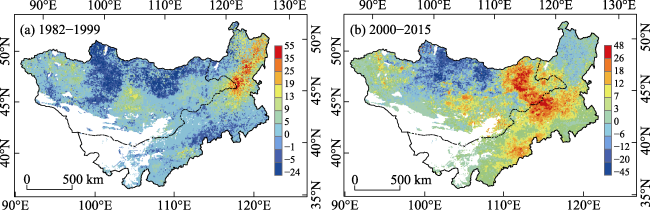
Figure 9 The drought risk of NPP on the Mongolian Plateau during 1982-1999 (a) and 2000-2015 (b)

3.4 Assessment of the drought risk for different vegetation types

Nine vegetation types (Table 1) were used to investigate the spatial distribution of each drought indicator (probability, vulnerability, and risk) for various types of vegetation. Deciduous broadleaf forest had the highest NPP values throughout all time periods, while desert steppe had the lowest. In period I, coniferous forest and sandy land had the highest and lowest drought probabilities, while broadleaf forests had the highest drought vulnerability and drought risk, and coniferous forests had the lowest.
In period II, broadleaf forest and sandy land had the highest and lowest drought probabilities, respectively, while broadleaf forest had the highest drought vulnerability and risk, and alpine grassland had the lowest. Coniferous forest and cropland showed the highest and lowest drought probabilities in period III, respectively, while cropland and coniferous forest showed the highest and lowest drought vulnerability and drought risk, respectively. In general, of the nine land cover types, seven showed high NPP during period III, all nine land cover types showed high drought probability during period III, three showed high drought vulnerability in period III, and five showed high drought risk in period III.
The results indicated that the drought risk varied by vegetation type and by the times. This result is primarily attributable to variations in drought probability and vulnerability among various varieties of vegetation. However, drought risk variations were primarily determined by drought vulnerability, and the changes were comparable between the two. The ranking of land cover categories in relation to drought risk varied across time periods. However, the drought risks of alpine grassland and coniferous forest were consistently lower, whereas higher risks of other vegetation types could be attributed to various factors, with vegetation responding differently to these factors over time.

3.5 Roles of various factors in determining drought risk of NPP

This study employed redundancy analysis to examine the relationship between various environmental factors and drought risk. The results demonstrated that the drivers of drought risk to NPP behaved differently across time periods and that different vegetation types responded differently to drought.
The NPP drought risk was consistently correlated with relative humidity, temperature, precipitation, and NDVI, i.e., showing a positive correlation during Period I. Relative humidity and solar radiation exhibited the highest positive and negative correlations to the drought risk of NPP, respectively (Figure 10a). Precipitation, NDVI, relative humidity, and solar radiation showed positive correlations with the drought risk of NPP during period II. Precipitation and temperature showed the highest positive and negative correlations to the drought risk of NPP, respectively (Figure 10b). During period III, the drought risk of NPP was positively correlated with temperature, solar radiation, and precipitation, showing the highest positive and negative correlations with solar radiation and relative humidity, respectively (Figure 10c). It has been found that the factors that determine the drought risk of NPP fluctuate over time, and the sensitivity of vegetation growth to drought is modulated by multiple drivers rather than a single factor (Pasho et al., 2012).
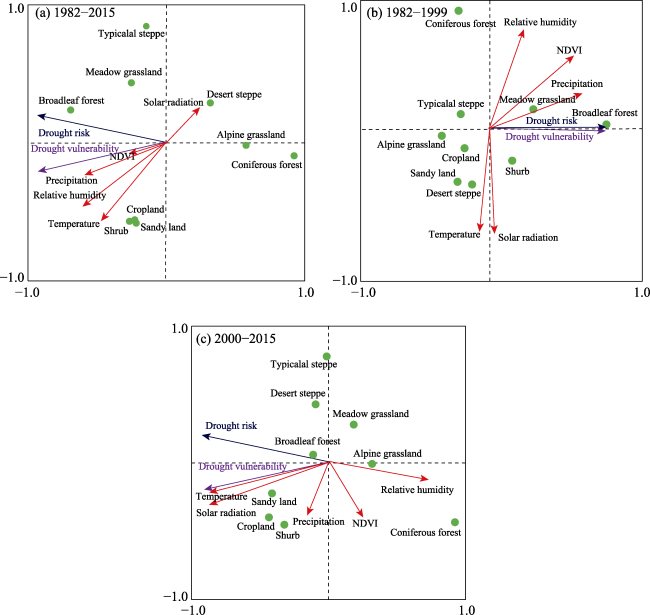
Figure 10 Redundancy analysis of the drought risk and vulnerability of net primary productivity (NPP) during 1982-2015 (a), 1982-1999 (b), and 2000-2015 (c)
Solar radiation influenced alpine grassland, coniferous forest, meadow steppe, desert steppe, and typical steppe in period I while NDVI influenced broadleaf forest, and temperature influenced shrub, sandy land, and cropland. During period II, coniferous forests and typical steppe were influenced by relative humidity, meadow steppe and broadleaf forests were influenced by precipitation while alpine grasslands, cropland, sandy land, and desert steppe were influenced by temperature, and shrubland was influenced by solar radiation. Typical steppe, desert steppe, meadow steppe, and broadleaf forests were all affected by temperature during period III, while the relative humidity influenced alpine grasslands and coniferous forests, sandy land and cropland were influenced by solar radiation, and shrubland was influenced by precipitation.
Coniferous forests were affected by relative humidity and solar radiation, broadleaf forests by NDVI, precipitation, and temperature, meadow steppe and shrubland by precipitation, temperature, and solar radiation, typical steppe and alpine grasslands by temperature, solar radiation, and relative humidity, and desert steppe, sandy land, and cropland were primarily influenced by solar radiation and temperature. The western portion of the Mongolian Plateau is a desert, while the eastern portion is abundant in vegetation types. Adaptability to precipitation and humidity varies among vegetation types. These findings are consistent with those of previous research demonstrating that different vegetation types respond differently to environmental variables such as temperature and precipitation (Zhang et al., 2022) and, therefore, show species-dependent drought responses (Orwig et al., 1997; Qi et al., 2021).

4 Discussion

Earlier research has shown that the SPEI and NPP indices each have their unique benefits when analyzing conditions on the Mongolian Plateau. Both the SPEI and NPP decreased more in the north than in the south, indicating that the drought and NPP conditions within Mongolia were more severe than those in Inner Mongolia (Tong et al., 2018; Bao et al., 2019). These findings are consistent with the results of the present study, i.e., there is consistency in the regions where the NPP and drought index (SPEI) show decreasing trends. Drought vulnerability and drought risk were found to decrease gradually from east to west, indicating that NPP was progressively less affected by drought, which may be associated with the distribution of vegetation patterns. The vegetation cover in the region gradually decreases from east to west, changing from forest grassland to desert areas which is primarily associated with the differences in the sensitivity of each vegetation type to drought (Lv et al., 2021). There may be physiological effects (leading to slow growth, early phenology, and alterations in above- and below-ground biomass, amongst others), or morphological effects (changes in height, canopy, flowering, and fruiting, as well as reduced growth resulting from alterations in photosynthetic and respiratory processes) (Xiao et al., 2002). Thus, there are variations in the drought risk distribution throughout the region.
Climate change and land use were shown to be significant factors causing changes in NPP, and NPP responds differently to the climate in different vegetation types (Piao et al., 2014). This study examined the relationship between temperature, precipitation, solar radiation, and relative humidity with the drought risk of NPP. The findings were consistent with those of prior research, which found that the effects of climate on the drought risk of NPP vary with different vegetation types. The effects of climate on vegetation occur largely through changes in moisture, temperature, and energy (Li et al., 2021; Bejagam et al., 2022; Yu et al., 2022). For instance, the capacity for carbon sequestration increases with increased levels of photosynthesis, resulting from increased rainfall, temperature, and radiation intensity, as shown by research on the causes of raised NPP in the middle and lower levels of the Yangtze River (Liu et al., 2022). Similarly, both water and temperature stress affect plant growth and development under drought conditions. In the context of global warming, the Mongolian Plateau shows a trend of increasing drought and extended seasons of vegetation growth, with climatic factors playing an essential regulatory role in the evolution of the ecosystem and the distribution of vegetation types (Chen et al., 2010; Liu et al., 2013). Differences in sensitivity to climatic factors (e.g., temperature and precipitation) in various regions have resulted in disparities in the distribution of drought risk in various regions. Moreover, the altitude of the Mongolian Plateau varies considerably, with accompanying differences in the distribution of temperature, light, and moisture, thereby enhancing the impact of climate on drought risk (Fierer et al., 2011; Xu et al., 2022).
There are several uncertainties associated with this investigation. The NDVI data and NPP model represent the first reason for uncertainty. MODIS data were used in this study to validate the accuracy of the NPP model due to the lack of actual NPP measurement data. However, these data cannot provide a comprehensive evaluation of NPP changes at monthly and seasonal time scales. In subsequent studies, the use of measured data should be independently validated at the annual and seasonal scales to achieve a comprehensive understanding of the NPP model’s applicability at various scales. Second, the qualitative analysis of the correlation between drought risk and climate factors can only ascertain the degree to which each climate factor correlates with it. Quantitative analysis should be added to determine the magnitude of each climate factor’s influence on drought risk during various seasons and vegetation types. Finally, this study only covers the period 1982-2015 due to the lack of data. With the development of remote sensing data and GIS stations, the uncertainty of drought risk on the Mongolian Plateau can be investigated using datasets with longer time scales from both historical and future viewpoints.

5 Conclusions

The drought risk of NPP is an essential indicator of the state of ecological functioning on the Mongolian Plateau. Accurate estimates of the drought risk of NPP can contribute to the prevention of drought disasters and the conservation of the ecological environment. The results showed that the CASA model was able to simulate NPP for the Mongolian Plateau during both drought and non-drought years. Meanwhile, there was an increasing trend in NPP and a decreasing trend in SPEI from 1982 to 2015. The NPP situation in Mongolia was found to be more serious than that in Inner Mongolia. SPEI decreased more rapidly in Mongolia than in Inner Mongolia. The drought risk of NPP showed higher values in the central, northeastern, and southeastern regions. Mongolia exhibited a higher drought probability than Inner Mongolia and its geographical differences associated with drought vulnerability and drought risk were greater than those of Inner Mongolia. The number of regions on the Mongolian Plateau with a high probability of drought increased gradually from period II to period III. Regions with high vulnerability to drought were found to have expanded, extending from the north to the south, whereas drought vulnerability decreased. Despite a reduction in the area with low drought risk and an increase in the area with high drought risk, the drought risk increased overall. Coniferous forest and sandy land exhibited the highest and lowest likelihood of experiencing drought, while broadleaf forest and coniferous forest exhibited the highest and lowest drought vulnerability and risk, respectively. Overall, temperature and relative humidity were observed to be the main drivers of drought risk. Across the different vegetation types, time and vegetation type were the main regulators of the drought-risk drivers. These findings enhance our understanding of changes in the drought risk of NPP and its driving mechanisms and provide an important foundation for the prevention of drought risk.
[1]
AghaKouchak A, Cheng L, Mazdiyasni O et al., 2014. Global warming and changes in risk of concurrent climate extremes: Insights from the 2014 California drought. Geophysical Research Letters, 41(24): 8847-8852.

DOI

[2]
Anderegg W R L, Schwalm C, Biondi F et al., 2015. Pervasive drought legacies in forest ecosystems and their implications for carbon cycle models. Science, 349(6247): 528-532.

DOI PMID

[3]
Bao G, Bao Y, Qin Z et al., 2016. Modeling net primary productivity of terrestrial ecosystems in the semi-arid climate of the Mongolian Plateau using LSWI-based 3’CASA ecosystem model. International Journal of Applied Earth Observation and Geoinformation, 46: 84-93.

DOI

[4]
Bao G, Chen J, Chopping M et al., 2019. Dynamics of net primary productivity on the Mongolian Plateau: Joint regulations of phenology and drought. International Journal of Applied Earth Observation and Geoinformation, 81: 85-97.

DOI

[5]
Bejagam V, Sharma A, 2022. Impact of climatic changes and anthropogenic activities on ecosystem net primary productivity in India during 2001-2019. Ecological Informatics, 70: 101732.

[6]
Breshears D D, Cobb N S, Rich P M et al., 2005. Regional vegetation die-off in response to global-change-type drought. Proceedings of the National Academy of Sciences, 102(42): 15144-15148.

DOI

[7]
Cao X, Fen g Y, Shi Z, 2020. Spatio-temporal variations in drought with remote sensing from the Mongolian Plateau during 1982-2018. Chinese Geographical Science, 30(6): 1081-1094.

DOI

[8]
Chen P Y, Welsh C, Hamann A, 2010. Geographic variation in growth response of Douglas-fir to interannual climate variability and projected climate change. Global Change Biology, 16(12): 3374-3385.

DOI

[9]
Chen X, Zeng Y, 2016. Spatial and temporal variability of the net primary production (NPP) and its relationship with climate factors in subtropical mountainous and hilly regions of China: A case study in Hunan province. Acta Geographica Sinica, 71(1): 35-48. (in Chinese)

DOI

[10]
Chen Y N, Li Y P, Li Z et al., 2022. Analysis of the impact of global climate change on dryland areas. Advances in Earth Science, 37(2): 111-119. (in Chinese)

DOI

[11]
Crabtree R, Potter C, Mullen R et al., 2009. A modeling and spatio-temporal analysis framework for monitoring environmental change using NPP as an ecosystem indicator. Remote Sensing of Environment, 113(7): 1486-1496.

DOI

[12]
Dai A, 2011. Drought under global warming: a review. Wiley Interdisciplinary Reviews: Climate Change, 2(1): 45-65.

[13]
Dai A, Lamb P J, Trenberth K E et al., 2004. The recent Sahel drought is real. International Journal of Climatology: A Journal of the Royal Meteorological Society, 24(11): 1323-1331.

DOI

[14]
Ding R, Shi W. 2022. Contributions of climate change to cereal yields in Tibet, 1993-2017. Journal of Geographical Sciences, 32(1): 101-116.

DOI

[15]
Ding Y, Xu J, Wang X et al., 2020. Spatial and temporal effects of drought on Chinese vegetation under different coverage levels. Science of the Total Environment, 716(6247): 137166.

DOI

[16]
Du P, Arndt S K, Farrell C, 2019. Is plant survival on green roofs related to their drought response, water use or climate of origin? Science of the Total Environment, 667(June 1): 25-32.

DOI

[17]
Ebi K L, Bowen K. 2015. Extreme events as sources of health vulnerability: Drought as an example. Weather and Climate Extremes, 11(C): 95-102.

[18]
Elkouk A, Pokhrel Y, Satoh Y et al., 2022. Implications of changes in climate and human development on 21st-century global drought risk. Journal of Environmental Management, 317: 115378.

DOI

[19]
Fierer N, McCain C M, Meir P et al., 2011. Microbes do not follow the elevational diversity patterns of plants and animals. Ecology, 92(4): 797-804.

PMID

[20]
Gao Q, Guo Y, Xu H et al., 2016. Climate change and its impacts on vegetation distribution and net primary productivity of the alpine ecosystem in the Qinghai-Tibetan Plateau. Science of the Total Environment, 554/555(June): 34-41.

[21]
Guo B, Zang W, Yang F et al., 2020. Spatial and temporal change patterns of net primary productivity and its response to climate change in the Qinghai-Tibet Plateau of China from 2000 to 2015. Journal of Arid Land, 12(1): 1-17.

DOI

[22]
Guo D, Song X, Hu R et al., 2021. Grassland type-dependent spatiotemporal characteristics of productivity in Inner Mongolia and its response to climate factors. Science of the Total Environment, 775: 145644.

DOI

[23]
He Q, Ju W, Dai S et al., 2021. Drought risk of global terrestrial gross primary productivity over the last 40 years detected by a remote sensing-driven process model. Journal of Geophysical Research: Biogeosciences, 126(6):e2020JG00594-4.

[24]
Jansson J K, Hofmockel K S, 2020. Soil microbiomes and climate change. Nature Reviews Microbiology, 18(1): 35-46.

DOI PMID

[25]
Jiang X, Bai J. 2021. Predicting and assessing changes in NPP based on multi-scenario land use and cover simulations on the Loess Plateau. Journal of Geographical Sciences, 31(7): 977-996.

DOI

[26]
Kang M C, Zhu L P, Xu H et al., 2019. Modelling the responses of carbon and water fluxes with climate change for a poplar plantation in northern China based on the biome-BGC model. Acta Ecologica Sinica, 39(7): 2378-2390. (in Chinese)

[27]
Li C, Zhou M, Dou T et al., 2021. Convergence of global hydrothermal pattern leads to an increase in vegetation net primary productivity. Ecological Indicators, 132: 108282.

DOI

[28]
Li K, Tong Z, Liu X et al., 2020. Quantitative assessment and driving force analysis of vegetation drought risk to climate change: Methodology and application in Northeast China. Agricultural and Forest Meteorology, 282: 107865.

[29]
Li X Z, Liu X D, 2012. A modeling study on drought trend in the Sino-Mongolian arid and semiarid regions in the 21st century. Arid Zone Research, 29(2): 262-272. (in Chinese)

[30]
Liu T T, Yang X X, Ye X C et al., 2022. Effects of human activities on terrestrial vegetation coverage change of Poyang Lake Basin during 2000-2020. Bulletin of Soil and Water Conservation, 42(4): 320-329. (in Chinese)

[31]
Liu X, Tian Z, Zhang A et al., 2019. Impacts of climate on spatiotemporal variations in vegetation NDVI from 1982-2015 in Inner Mongolia, China. Sustainability, 11(3): 768.

DOI

[32]
Liu Y Y, Evans J P, McCabe M F et al., 2013. Changing climate and overgrazing are decimating Mongolian steppes. PloS One, 8(2): e57599.

DOI

[33]
Lu N, Wilske B, Ni J et al., 2009. Climate change in Inner Mongolia from 1955 to 2005: Trends at regional, biome and local scales. Environmental Research Letters, 4(4): 045006.

DOI

[34]
Lv Z, Li S, Peng Z et al., 2021. Sensitivity of vegetation responses to drought in Mongolia. Geographical Research, 40(11): 13. (in Chinese)

[35]
Nandintsetseg B, Boldgiv B, Chang J et al., 2021. Risk and vulnerability of Mongolian grasslands under climate change. Environmental Research Letters, 16(3): 034035.

DOI

[36]
Nandintsetseg B, Greene J S, Goulden C E, 2007. Trends in extreme daily precipitation and temperature near Lake HövHövsgöl, Mongolia. International Journal of Climatology: A Journal of the Royal Meteorological Society, 27(3): 341-347.

DOI

[37]
Orwig D A, Abrams M D, 1997. Variation in radial growth responses to drought among species, site, and canopy strata. Trees, 11(8): 474-484.

DOI

[38]
Pachauri R K, Allen M R, Barros V R et al., 2014. Climate change 2014:synthesis report. Contribution of Working Groups I, II and III to the Fifth Assessment Report of the Intergovernmental Panel on Climate Change. Geneva, Switzerland and IPCC.

[39]
Pasho E, Camarero J J, de Luis M et al., 2012. Factors driving growth responses to drought in Mediterranean forests. European Journal of Forest Research, 131(6): 1797-1807.

DOI

[40]
Payne N J, Cameron D A, Leblanc J D et al., 2019. Carbon storage and net primary productivity in Canadian boreal mixed wood stands. Journal of Forestry Research, 30(5): 1667-1678.

DOI

[41]
Pei Z, Fang S, Wang L et al., 2020. Comparative analysis of drought indicated by the SPI and SPEI at various timescales in Inner Mongolia, China. Water, 12(7): 1925.

DOI

[42]
Piao S, Nan H, Huntingford C et al., 2014. Evidence for a weakening relationship between interannual temperature variability and northern vegetation activity. Nature Communications, 5(1): 5018.

DOI

[43]
Qi G, Bai H, Zhao T et al., 2021. Sensitivity and areal differentiation of vegetation responses to hydrothermal dynamics on the northern and southern slopes of the Qinling Mountains in Shaanxi province. Journal of Geographical Sciences, 31(6): 785-801.

DOI

[44]
Shi S, Wang F, Jin K et al., 2019. Temporal and spatial characteristics of drought based on SPEI in northern China from 1981 to 2017. Agricultural Research in the Arid Areas, 37(4): 215-222.

[45]
Sternberg T, Thomas D, Middleton N, 2011. Drought dynamics on the Mongolian steppe, 1970-2006. International Journal of Climatology, 31(12): 1823-1830.

DOI

[46]
Stocker T F, Qin D, Plattner G K et al., 2013. Climate change 2013. The Physical Science Basis:Working Group I Contribution to the Fifth Assessment Report of the Intergovernmental Panel on Climate Change. Cambridge, UK and New York, USA: Cambridge University Press.

[47]
Tong S, Lai Q, Zhang J et al., 2018. Spatiotemporal drought variability on the Mongolian Plateau from 1980-2014 based on the SPEI-PM, intensity analysis and Hurst exponent. Science of the Total Environment, 615: 1557-1565.

DOI

[48]
Van Oijen M, Beer C, Cramer W et al., 2013. A novel probabilistic risk analysis to determine the vulnerability of ecosystems to extreme climatic events. Environmental Research Letters, 8(1): 015032.

DOI

[49]
Vicente-Serrano S M, Beguería S, López-Moreno J I, 2010. A multiscalar drought index sensitive to global warming: The standardized precipitation evapotranspiration index. Journal of Climate, 23(7): 1696-1718.

DOI

[50]
Vicente-Serrano S M, Gouveia C, Camarero J J et al., 2013. Response of vegetation to drought time-scales across global land biomes. Proceedings of the National Academy of Sciences, 110(1): 52-57.

DOI

[51]
Wang J, Li Y, Wang R et al., 2012. Preliminary analysis on the demand and review of progress in the field of meteorological drought research. Journal of Arid Meteorology, 30(4): 497-508. (in Chinese)

[52]
Wang P, Huang M, Zhai P, 2022. New progress and enlightenment on different types of drought changes from IPCC Sixth Assessment Report. Acta Meteorologica Sinica, 80(1): 168-175. (in Chinese)

[53]
Wei X, Yang J, Luo P et al., 2022. Assessment of the variation and influencing factors of vegetation NPP and carbon sink capacity under different natural conditions. Ecological Indicators, 138: 108834.

DOI

[54]
Xiao C W, Zhou G S, Ma F Y, 2002. Effect of water supply change on morphology and growth of dominant plants in Maowusu sandland. Chinese Journal of Plant Ecology, 26(1): 69-76. (in Chinese)

[55]
Xu C, McDowell N G, Fisher R A et al., 2019a. Increasing impacts of extreme droughts on vegetation productivity under climate change. Nature Climate Change, 9(12): 948-953.

DOI

[56]
Xu H, Wang X, Zhao C et al., 2019b. Responses of ecosystem water use efficiency to meteorological drought under different biomes and drought magnitudes in northern China. Agricultural and Forest Meteorology, 278: 107660.

DOI

[57]
Xu H N, Wang J L, Peng X M et al., 2022. Responses of radial growth of Juniperus przewalskii to different droughts over the northeastern Tibetan Plateau, China. The Journal of Applied Ecology, 33(8): 2097-2104.

[58]
Yu D, Li Y, Yin B et al., 2022. Spatiotemporal variation of net primary productivity and its response to drought in Inner Mongolian desert steppe. Global Ecology and Conservation, 33: e01991.

DOI

[59]
Zhang J, Pan X L, Gao Z Q et al., 2006. Carbon uptake and change in net primary productivity of oasis-desert ecosystem in arid western China with remote sensing technique. Acta Geographica Sinica, 61(1): 15-25. (in Chinese)

[60]
Zhang J, Zhu L, Li G et al., 2022. Distribution patterns of SOC/TN content and their relationship with topography, vegetation and climatic factors in China’s north-south transitional zone. Journal of Geographical Sciences, 32(4): 645-662.

DOI

[61]
Zhang M, Chen Y, Shen Y et al., 2019a. Tracking climate change in Central Asia through temperature and precipitation extremes. Journal of Geographical Sciences, 29(1): 3-28.

DOI

[62]
Zhang Y, Zhang Y, Jin Z et al., 2019b. The temporal and spatial characteristics of summer drought in the Loess Plateau based on SPEI. Ecology and Environmental Sciences, 28(7): 1322-1331. (in Chinese)

[63]
Zhao J, Zhang Q, Zhu X et al., 2020. Drought risk assessment in China: Evaluation framework and influencing factors. Geography and Sustainability, 1(3): 220-228.

DOI

Outlines

/