Research Articles

Decoupled driving forces of variabilities of transpiration in Chinese subtropical vegetation based on remote sensing data

  • JIN Jiaxin , 1, 2, 7 ,
  • CAI Yulong 1 ,
  • GUO Xi 3 ,
  • WANG Longhao 4 ,
  • WANG Ying 5 ,
  • LIU Yuanbo 6
Expand
  • 1. College of Hydrology and Water Resources, Hohai University, Nanjing 210024, China
  • 2. Key Laboratory of Water Big Data Technology of Ministry of Water Resources, Hohai University, Nanjing 210024, China
  • 3. College of Land Resources and Environment, Jiangxi Agricultural University, Nanchang 330045, China
  • 4. Institute of Geographic Sciences and Natural Resources Research, CAS, Beijing 100101, China
  • 5. School of Tourism and Social Management, Nanjing Xiaozhuang University, Nanjing 211171, China
  • 6. Nanjing Institute of Geography and Limnology, CAS, Nanjing 210008, China
  • 7. National Earth System Science Data Center, National Science and Technology Resource Sharing Service Platform, Beijing 100101, China

Jin Jiaxin, Professor, specialized in eco-hydrological remote sensing. E-mail:

Received date: 2023-07-05

  Accepted date: 2023-08-08

  Online published: 2023-11-15

Supported by

The National Key R&D Program of China(2018YFA0605402)

National Natural Science Foundation of China(41971374)

Abstract

Transpiration (Tc) is a critical component of the global water cycle. Soil moisture (SM) and vapor pressure deficit (VPD) are key regulators of Tc, and exploring their contributions to changes in Tc can deepen our understanding of the mechanisms of water cycling in terrestrial ecosystems. However, the driving roles of VPD and SM in Tc changes remain debated because of the coupling of SM and VPD through land-atmosphere interactions which restrict the quantification of the independent effects of SM and VPD on Tc. By decoupling the correlations between SM and VPD using a novel binning approach, this study analyzed the dominant drivers of vegetation transpiration in subtropical China from 2003 to 2018 based on multi-source data, including meteorological reanalysis, remotely sensed soil moisture, transpiration, and land cover data. The results show that Tc first increased and then remained stable with an increase in SM across the study area but changed slightly with increasing VPD. Overall, the relative contribution of SM to the change in Tc was approximately five times that of VPD. The sensitivities of Tc to SM and VPD differed among vegetation types. Although the sensitivity of Tc to SM was greater than that of VPD for all four vegetation types, the thresholds of Tc in response to SM were different, with the lowest threshold (approximately 35%) for the other forests and the highest threshold (approximately 55% ) for short wood vegetation. We infer that this is associated with the differences in ecological strategies. To verify the reliability of our conclusions, we used solar- induced chlorophyll fluorescence (SIF) data as a proxy for Tc based on the tight coupling between photosynthesis and transpiration. Consistent results were obtained by repeating the analyses. The results of this study, in which the impacts of SM and VPD on Tc were decoupled, are beneficial for further understanding the critical processes involved in water cycling in terrestrial ecosystems in response to climate change.

Cite this article

JIN Jiaxin , CAI Yulong , GUO Xi , WANG Longhao , WANG Ying , LIU Yuanbo . Decoupled driving forces of variabilities of transpiration in Chinese subtropical vegetation based on remote sensing data[J]. Journal of Geographical Sciences, 2023 , 33(11) : 2159 -2174 . DOI: 10.1007/s11442-023-2170-2

1 Introduction

Transpiration (Tc) is the main source of water flux from terrestrial evapotranspiration, accounting for 80%-90% of terrestrial evapotranspiration (Jasechko et al., 2013; Good et al., 2015; Zhang et al., 2021). Transpiration recirculates 62000±8000 km3 of water annually into the atmosphere (Jasechko et al., 2013). Soil water is the primary source of water for transpiration. Deficiencies in soil moisture (SM) can affect the stomatal conductance of vegetation, limiting productivity and threatening vegetation survival (Phillips et al., 2009; Peng et al., 2011; McDowell and Allen, 2015). Another major driver of Tc is vapor pressure deficit (VPD). On the one hand, VPD is an important driver of the atmospheric water demand for plants (Rawson et al., 1977; Yuan et al., 2019). On the other hand, when VPD increases to a certain threshold, a further increase in VPD leads to a decrease in vegetation stomatal conductance until it closes which in turn reduces Tc (Oren et al., 1999; Konings and Gentine, 2017). Therefore, VPD is a key regulator that determines the role of Tc (Novick et al., 2016; Yuan et al., 2019; Grossiord et al., 2020). In the context of current climate warming, VPD is gradually increasing (Yuan et al., 2019), whereas SM is decreasing worldwide which may reduce Tc (Deng et al., 2020). Therefore, quantifying the relative contributions of SM and VPD on Tc is beneficial to understand mechanisms of terrestrial water cycle.
Owing to the complex mechanisms of interactions between SM and VPD and the high spatial and temporal heterogeneity, the relative role of Tc remains unclear (Liu et al., 2020; Yu et al., 2022). Current studies on the effects of SM and VPD on Tc have focused on the site scale (Ray et al., 2002; Song et al., 2020). For example, Song et al. (2020) investigated the independent effects of SM and VPD on Tc in subtropical coniferous plantations in Jiangxi province, and their results showed that the limitation of VPD on Tc was greater than that of SM. However, the independent effects of SM and VPD on Tc have not been well-explored at regional and global scales which restrict our understanding of the ecosystem water cycling response to climate change (Seneviratne et al., 2010; Novick et al., 2016). In recent years, numerous studies on the effects of SM and VPD on photosynthesis have been conducted at regional and global scales (Liu et al., 2020; Yu et al., 2022). Considering the coupling of photosynthesis and transpiration (Beer et al., 2007; Jasechko et al., 2013; Zhang et al., 2019), this study would be a valuable reference for Tc studies. Liu et al. (2020) demonstrated that SM, rather than VPD, dominates ecosystem production in most vegetated land areas. Lu et al. (2022) showed that VPD has a great influence on ecosystem production efficiency compared to SM across larger regions. Dang et al. (2022) concluded that temperature is more important than SM in ecosystem productivity in global vegetation cover and that the importance of SM and temperature varies among vegetation types.
As SM and VPD are coupled (Seneviratne et al., 2010; Liu et al., 2020; Dang et al., 2022), their effects on transpiration and photosynthesis remain controversial. Therefore, disentangling the strong coupling between SM and VPD and exploring their independent effects on Tc is essential for understanding the climate response mechanisms of water cycling in terrestrial ecosystems. To explore the effects of SM and VPD on ecosystems, Liu et al. (2020) proposed a binning approach to successfully decouple the correlation between SM and VPD. This method divides the data into bins according to the SM and VPD percentiles, and the SM and VPD are largely decoupled in each SM or VPD interval which performs better in multi-factor independent contribution analysis. Yu et al. (2022) successfully disentangled the relative effects of SM and VPD on ecosystems in Central Asia using a binning approach. This method provides an effective way to disentangle the relative contributions of VPD and SM to Tc.
In recent years, the southern subtropical region of China has experienced significant climate change, especially a decline in SM and an increase in VPD which has had a significant impact on the regional Tc and thus poses a potential threat to the regional ecological environment and social economy (Deng et al., 2020; Denissen et al., 2022; Wang et al., 2022). However, the independent contributions of SM and VPD to Tc remain controversial, which seriously limits our understanding of regional water cycling climate change response patterns and the formulation of response strategies. In this study, we selected the subtropical region of China as the study area and explored the respective effects of VPD and SM changes on Tc with the help of correlation analysis and binning approach. The sensitivity differences in Tc response to VPD and SM changes in different vegetation types were further investigated. We hypothesized that if SM plays a dominant role in Tc, then Tc would not be very sensitive to changes in VPD, and high SM would promote Tc. Conversely, if VPD plays a dominant role in Tc, then Tc is not very sensitive to changes in SM and VPD promotes Tc.

2 Study area and data sources

2.1 Study area

The area selected for this study (96°45′E-123°57′E, 20°23′N-30°29′N) mainly includes the subtropical provincial-level regions of Yunnan, Guizhou, Guangxi, Hunan, Jiangxi, Guangdong, Fujian, and Zhejiang (Figure 1), located south of the Yangtze River and bordering the East and South China Seas. The terrain was dominated by plains, hills, and mountains. The climate has a subtropical monsoon climate with high temperature and humidity, rain, and heat in the same period, with an annual average temperature of 16-22℃, and annual precipitation of 800-1600 mm. The vegetation type was dominated by subtropical forests. The water-use strategies of isohydric species in this region differ from the typical responses of other regions and are often affected by seasonal droughts (Jiang et al., 2020).
Figure 1 Spatial distribution of the main vegetation types over the study area in subtropical China

Note: This figure has been prepared based on the standard map provided by the Ministry of Natural Resources of the People’s Republic of China, which can be found on the service website (GS (2019)1673). The base map was not modified.

2.2 Data sources

2.2.1 Soil moisture

SM data were selected from the “1 daily soil moisture dataset over China based on situ measurement” provided by the National Tibetan Plateau Data Center (SMCI 1.0, https://doi.org/10.11888/Terre.tpdc.272415) (Li et al., 2022). The dataset was derived using a machine learning algorithm and trained by in-situ measurements from 1789 stations across China. Random forest was selected to predict soil moisture using the ERA5-Land time series, leaf area index, and land cover type as predictors. Compared with the ERA5-Land and SAMP-L4 products, the SMCI is more accurate in the Chinese region and provides 10 layers of soil moisture from 10 to 100 cm, with an interval of 10 cm (Li et al., 2022). This dataset spans 2000-2020 with a spatial resolution of 0.1° and daily temporal resolution. To ensure the accuracy of the study, three layers of soil moisture at 10-20 cm, 50-60 cm, and 90-100 cm were selected for averaging (Liu et al., 2020), and the daily data were combined into a monthly scale for statistical analysis.

2.2.2 Vapor pressure deficit

The VPD data used in this study were calculated using temperature, air-specific humidity, and air pressure data (Jin et al., 2021). The meteorological data were derived from the “Chinese regional high spatial and temporal resolution ground meteorological element forcing dataset (https://doi.org/10.3972/westdc.002.2014.db).” The dataset was produced using existing Princeton reanalysis data, GLDAS data, GEWEX-SRB radiation data, and TRMM precipitation data and incorporated conventional meteorological observations from the China Meteorological Administration (Chen et al., 2011). This study included monthly scale data, collected from 2003 to 2018, and the VPD were calculated as follows: Equations (1) to (3)
${{\text{e}}^{0}}=6.108*\exp \frac{17.27T}{T+237.3}$
${{\text{e}}^{a}}=\frac{p*q}{62.2}$
$VPD={{\text{e}}^{0}}-{{e}^{a}}$
where VPD is the vapor pressure deficit (hPa); $T$ indicates the temperature (℃); q indicates the air-specific humidity (kg kg–1); p indicates the air pressure (Pa); e0 and ea are saturation vapor pressure and actual vapor pressure (hPa), respectively. To prevent the effect of radiation, an area with a VPD of < 5 was masked.

2.2.3 Transpiration

The Tc data used in this study were derived from the Global Land Evaporation Amsterdam Model (GLEAM) v3.5a (https://www.gleam.eu/). The GLEAM results in total evapotranspiration as well as its components, such as Tc, and is widely used in quantitative studies of the global water cycle (Miralles et al., 2011, 2014). The model uses the Priestley and Taylor equations to calculate the potential Tc based on the observed net surface radiation and air temperature (Martens et al., 2017; Wang et al., 2019). A comparative analysis of various ET remote sensing products revealed that the GLEAM transpiration data had better estimation accuracy (Miralles et al., 2016; Martens et al., 2017; Talsma et al., 2018). To disentangle the respective effects of VPD and SM changes on Tc, the time range of the data in this study was 2003-2018, with a temporal resolution of one month and a spatial resolution of 0.25° × 0.25°. Downscaling of the raw GLEAM Tc data was required to match the other data. Considering the strong correlation between transpiration and photosynthesis (Mohammed et al., 2019; Maes et al., 2020), we used a linear regression method to downscale the Tc data to 0.1° with the help of solar-induced chlorophyll fluorescence (SIF) remote sensing data (Pagán et al., 2019; Maes et al., 2020; Feng et al., 2021; Shan et al., 2021).

2.2.4 Land cover data

We selected the MODIS land-cover type product (MCD12C1, International Geosphere-Biosphere Program (IGBP) classification scheme (https://lpdaac.usgs.gov/data/)) as the vegetation type data. The data comprised a dataset of land cover types obtained by combining the Terra and Aqua satellites with a spatial resolution of 0.05°. In this study, based on the land cover classification integration scheme proposed by Chen et al. (2022), evergreen needleleaf, deciduous broadleaf, and mixed forests were merged into other forests; woody savannas and savannas were merged into short woody vegetation; and croplands and cropland/natural vegetation mosaics were merged into croplands. Vegetation types in the study area with fewer than ten pixels were excluded. To reduce the influence of land cover type changes in this study, we selected three periods of land cover data 2002, 2010, and 2018 and retained pixels with no change in land cover type during the study period as the effective vegetation area for this study.

2.2.5 Solar-induced chlorophyll fluorescence

Fluorescence is long-wave radiation re-emitted by chlorophyll during photosynthesis. Considering that photosynthesis and transpiration are closely coupled through the leaf stomata, fluorescence can be an ideal proxy for transpiration (Lu et al., 2018; Maes et al., 2020). With the development of remote sensing of solar-induced chlorophyll fluorescence (SIF), analysis based on ground-based and remotely sensed SIF observations has revealed a strong correlation between SIF and Tc. Maes et al. (2020) used satellite-based SIF and the Soil Canopy Observation of Photosynthesis and Energy fluxes (SCOPE) model to investigate the empirical link between SIF and Tc. Based on flux-tower measurements, Lu et al. (2018) found that SIF in temperate forests is closely related to latent heat fluxes. The SIF data used in this study were derived from the GOSIF product which was generated from MODIS remote sensing and meteorological reanalysis data (Li and Xiao, 2019). Owing to its high spatial and temporal resolutions and continuous global coverage, GOSIF is now widely used to explore the effects of SM and VPD on photosynthesis (Dang et al., 2022; Yu et al., 2022). The GOSIF data in this study spanned the years 2013-2018 with a temporal resolution of one month and a spatial resolution of 0.05° and were upscaled to 0.1° in the study. The GOSIF data in this paper used SIF to (1) achieve downscaling of GLAME Tc data and (2) represent Tc and assist in validating our results.

3 Methods

Spearman’s correlation analysis can describe both linear and nonlinear relationships and requires no assumption of normality for the data. This method is widely used owing to its low sensitivity to outliers (Jin et al., 2020). In this study, Spearman’s correlation analysis was applied to Tc, VPD, SM, and SIF data in the study area. Because of the coarse spatial resolution of GLEAM Tc data, downscaling is required for accurate analysis of the driving forces of variabilities of transpiration in Chinese subtropical vegetation and to ensure the consistency of the spatial resolution of the data. Furthermore, the linear regression equations of SIF and GLEAM Tc data were established pixel-by-pixel using GOSIF data. The basic process was as follows: First, the GOSIF data were upscaled to 0.25°, and a statistical relationship was established with the GLEAM Tc data. Second, the regression equation was applied to the original high-resolution SIF data to predict Tc data for downscaling. To prevent the interference of other factors, data on temperatures less than 15℃ and photosynthetic photon flux density less than 500 µmol m-2 s-1 in the study area were removed (Liu et al., 2020). Considering the strong coupling between the SM and VPD, it is impossible to quantify the effects of the SM and VPD on Tc using conventional methods. Therefore, the “binning approach” proposed by Liu et al. (2020) was chosen to decouple the correlation between SM and VPD and then quantify the effects of SM and VPD on Tc. First, the SM and VPD data in the study area were sorted from small to large according to the value, and then, the sorted SM and VPD data were divided into 10 intervals (i.e., 0-10%, 10%-20%,..., 90%-100%) by percentile. The SM and VPD intervals were intersected to derive 10×10 subintervals which were called “bin” in this paper (Figure 2). SM and VPD were decoupled in each interval; therefore, it was convenient to quantify the effects of SM and VPD on Tc. A bin was deleted when the number of data points was less than 10, and the mean value of the bin was used to quantify the effects of SM and VPD on Tc. After disentangling the SM-VPD correlation, Tc (VPD|SM) was used to quantify the effect of VPD on Tc. ΔTc (VPD|SM) denotes the amount of change in Tc (mm month-1) as VPD goes from the lowest to the highest value while keeping SM constant or changing less. Similarly, Tc (SM|VPD) was used to quantify the effect of the SM on Tc. The following formulae were used for the calculations (Liu et al., 2020): Formulaes (4) and (5)
$\Delta T\text{c}(VPD|SM)=\frac{1}{I}\sum\limits_{i=1}^{I}{T{{\text{c}}_{i,{{n}_{i,\max }}}}}-T{{c}_{i,{{n}_{i,\min }}}}$
$\Delta Tc(SM|VPD)=\frac{1}{J}\sum\limits_{j=1}^{J}{T{{\text{c}}_{{{m}_{\text{j},\max,}}j}}-T{{c}_{{{m}_{j,\min,}}j}}}$
where ΔTc(VPD|SM) is the difference between the Tc at the highest VPD bin and the lowest VPD bin in each SM interval; I is the total number of SM intervals; i is the specific SM interval number (i=1, 2,..., 10); ni,max and ni,min are the numbers of the largest and smallest VPD bins at SM interval i, respectively. Equally, where ΔTc(SM|VPD) is the difference between the Tc at the highest SM bin and the lowest SM bin in each VPD interval; J is the total number of VPD intervals; j is the specific VPD interval number (j=1, 2,...., 10); mj,max and mj,min are the numbers of the largest and smallest SM bins at VPD interval j, respectively.
Figure 2 Conceptual illustration of the decoupling approach by binning

4 Results

4.1 Correlation analysis between Tc and driving factors

Figure 3 shows the spatial distribution of correlations between the study variables. VPD was positively correlated with Tc in general with a mean value of approximately 0.57; approximately 91% of the regions were positively correlated, and 9% were negatively correlated. The correlation between VPD and Tc was lower in Yunnan province, with an average value of approximately 0.1 (Figure 3a). In general, SM was positively correlated with Tc, and the mean value of the correlation was approximately 0.3, with 78% of the regions showing a positive correlation. Specifically, the positively correlated regions were mainly concentrated in Yunnan and South China whereas the negatively correlated regions were concentrated in Jiangxi and Zhejiang provinces (Figure 3b). SM was negatively correlated with VPD in general, and the mean value of correlation was approximately -0.2. A negative correlation was shown in about 79% of the regions and was significant in about 70% of them (p<0.05), mainly concentrated in the Yunnan and Zhejiang provinces (Figure 3c). Overall, there was a strong coupling between SM and VPD. In regions with high SM and VPD, the correlation between SM and Tc may be caused by the correlation between VPD and Tc, or the correlation between VPD and Tc may be resulted from the correlation between SM and Tc. Therefore, the correlation between SM and VPD is often ignored when assessing their contributions in Tc. In addition, to verify the reliability of the SIF data downscaling, we performed a correlation analysis on GOSIF and GLEAM Tc data at a 0.25° scale. Overall, SIF and Tc in the study area showed a strong positive correlation (Figure 3d), with a mean value of approximately 0.84, indicating that the choice of SIF data for downscaling was feasible.
Figure 3 Spatial distribution of correlations between the selected variables in subtropical China from 2003 to 2018
The strong coupling between SM and VPD restricts the independent effects of exploring SM and VPD on Tc (Figure 3c). In order to decouple the strong coupling between SM and VPD, we used the “binning approach” to disentangle the strong coupling between SM and VPD. As shown in Figure 4, the median value between SM and VPD in the study area before decoupling was -0.21, and the median value after binning by VPD and SM were -0.04 and -0.03, respectively. This lays the foundation for exploring the independent effects of SM and VPD on Tc.
Figure 4 Box-plots of the correlation coefficients between soil moisture (SM) and vapor pressure deficit (VPD) across the study area in subtropical China from 2003 to 2018. R(VPD, SM) denotes the VPD-SM correlation before decoupling. Monthly VPD and SM bins denote the correlations between SM and VPD under VPD and SM intervals, respectively.

4.2 Relative contribution of VPD and SM changes to Tc

Figure 5 shows the variation in Tc in the study area with increasing gradients of SM and VPD after decoupling between SM and VPD. Overall, Tc first increased and then remained stable with increasing SM content. Below the SM threshold of less than 35%, Tc gradually increased with SM; when SM exceeded the threshold, Tc did not significantly change (Figure 5a). However, Tc in the study area was less affected by the VPD overall. In the intervals where the SM was less than 10%, Tc decreased with increasing VPD, whereas in the intervals where the SM was greater than 10%, Tc relatively increased with increasing VPD (Figure 5b). This showed that without SM-VPD coupling, high SM promoted Tc, while the effect of high VPD on Tc was not significant. In other words, the correlation between Tc and VPD is mainly a byproduct of SM-VPD coupling. Figure 6 shows the relative contributions of SM and VPD to Tc and SIF in the study area after decoupling. The average monthly relative contribution of SM to Tc in the study area was 23.54 (mm). All relative contributions of SM to Tc were positive, indicating that an increase in SM contributed to Tc at different VPD gradients. The maximum value of the relative contribution was 34.21 (mm month-1) and the minimum value was 17.57 (mm month-1) (Figure 6a). The average relative contribution of VPD to Tc in the study area was 4.80 (mm month-1). When the SM was in the 0%-10% interval, the smallest relative contribution of VPD to Tc was about -3.84 (mm month-1), and when the SM was in the 90%-100% interval, the largest relative contribution of VPD to Tc was about 10.49 (mm month-1) (Figure 6a). To further verify the credibility of the results, we analyzed the relative contributions of SM and VPD to SIF in the study area, which were found to be 0.13 (W m-2 nm-2 sr-1) and -0.02 (W m-2 nm-2 sr-1), respectively. The smallest relative contribution of SM to SIF was approximately 0.09 (W m-2 nm-2 sr-1) and was found in the 20%-30% VPD interval. The contribution of VPD to SIF decreased with increasing SM gradient, and when the SM was located in the 80%-90% interval, the relative contribution of VPD to SIF was the lowest (Figure 6b). Overall, the independent effects of SM and VPD on Tc in the study area were consistent with those of SIF.
Figure 5 Changes of Tc in the gradients of (a) SM and (b) VPD without SM-VPD coupling. The dots indicate the mean Tc values in each SM-VPD bin, and the colors indicate different VPD or SM intervals.
Figure 6 Relative contributions of SM and VPD to Tc without SM-VPD coupling. (a) ΔTc (SM|VPD) and ΔTc (VPD|SM) indicate the amount of changes in Tc as increasing SM and VPD, respectively; (b) ΔSIF(SM|VPD) and ΔSIF(VPD|SM) indicate the amount of changes in SIF as increasing SM and VPD, respectively. The colors denote different VPD or SM intervals, the dots denote the SM or VPD contributions in each interval, and the squares denote the corresponding mean values.

4.3 Differences in sensitivity of Tc to SM and VPD among vegetation types

Figure 7 shows the differences in Tc responses to SM and VPD among different vegetation types. Overall, the sensitivity of Tc to SM was greater than that to VPD for all four vegetation types, and Tc increased with increasing SM. However, the threshold values (i.e. the turning point of the gradient response curve) of the Tc response to SM differed among the vegetation types, with the lowest threshold value of approximately 35% for other forests and a higher threshold value of approximately 55% for short woody vegetation (Figures 7c and 7e). The Tc of all four plantings was less affected by VPD than SM. In the interval where SM was greater than 20%, Tc increased with increasing VPD in other forests but fluctuated with increasing VPD in evergreen broadleaf forests and croplands (Figures 7b, 7d and 7h). Figure 8 shows the relative contributions of SM and VPD to Tc and SIF for different vegetation types. Overall, the contribution of SM to the four vegetation types was greater than that of VPD. The average relative contributions of SM and VPD to Tc in the evergreen broadleaf forest were 19.73 (mm month-1) and 2.90 (mm month-1), respectively. The relative contribution of VPD to Tc was less than 0 (mm month-1) in the interval where the SM was in the range of 0%-40% (Figure 8a). The Tc of the other forests gradually increased with an increase in the interval to which SM belonged, and the average relative contributions of SM and VPD to the Tc of the other forests were 22.88 (mm month-1) and 7.70 (mm month-1) (Figure 8c), respectively. The average relative contributions of SM and VPD to Tc in the cropland were 16.17 (mm month-1) and 5.07 (mm month-1) (Figure 8g), respectively. Under the same SM or VPD conditions, high VPD and SM led to a decrease in Tc in croplands. When the VPD was in the 90%-100%, interval, the relative contribution of SM to Tc was the smallest at approximately 3.91 (mm month-1). The relative contributions of SM and VPD to Tc in different vegetation types largely coincided with those of SIF (Figures 8b, 8d, 8f and 8h). The differences in the sensitivity of the Tc response to SM and VPD in different vegetation types suggest that attention should be paid to distinguishing different land cover types when considering the independent effects of SM and VPD.
Figure 7 Changes of Tc in the gradients of (a, c, e and g) SM and (b, d, f and h) VPD without SM-VPD coupling for different vegetation types. The dots denote the mean Tc values in each SM-VPD bin, and the colors denote different VPD or SM intervals.
Figure 8 Relative contributions of SM and VPD to Tc without SM-VPD coupling for different vegetation types. ΔTc (SM|VPD) and ΔTc (VPD|SM) of the top panels (a, c, e and g) indicate the amount of changes in Tc as increasing SM and VPD, respectively; ΔSIF(SM|VPD) and ΔSIF(VPD|SM) of the bottom panels (b, d, f and h) indicate the amount of changes in SIF as increasing SM and VPD, respectively. The colors denote different VPD or SM intervals, the dots denote the SM or VPD contributions in each interval, and the squares denote the corresponding mean values.

5 Discussion

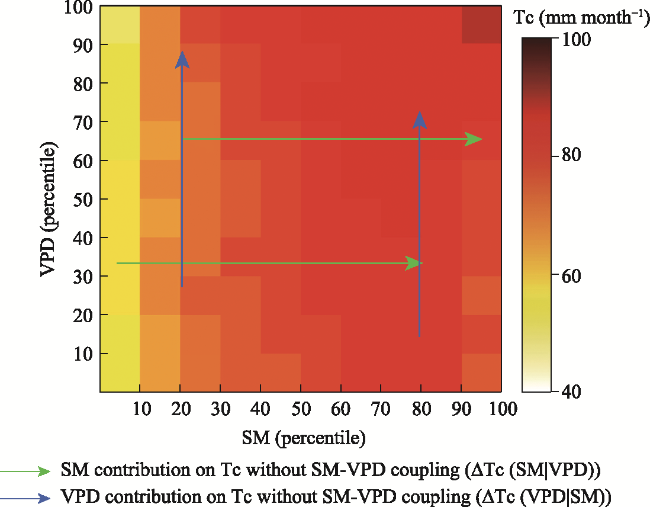
Understanding the driving role of VPD and SM on transpiration changes in the context of climate warming remains to be improved mainly because SM and VPD are coupled through land-atmosphere interactions, restricting the quantification of the independent effects of SM and VPD on Tc. The “binning method” decouples the strong coupling between SM and VPD at regional and global scales (Liu et al., 2020; Cheng et al., 2022; Yu et al., 2022). In contrast, traditional methods such as correlation analysis and multiple linear regression do not sufficiently decouple the covariance between SM and VPD (Liu et al., 2020). The response of Tc to the SM and VPD may be nonlinear (Sage and Kubien, 2007; Green et al., 2019), and this method can capture this nonlinearity (Dang et al., 2022; Fu et al., 
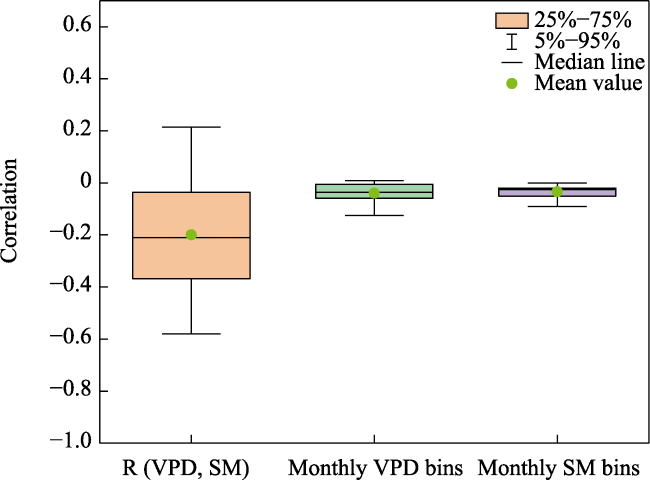
2022a). The SM-VPD correlation in this study showed a significant decrease after using this method (Figure 4), which provided a basis for exploring the independent effects of SM and VPD on Tc. In this study, we analyzed the independent effects of SM and VPD on Tc in subtropical China and found that the independent effects of SM on Tc were greater than those of VPD. This supports the results of Liu et al. (2020) and Yu et al. (2022) and emphasizes the importance of SM on Tc. Tc is more susceptible to SM in subtropical China, where droughts are frequent and SM highly fluctuates annually (Yuan et al., 2016). However, recent studies on the independent effects of SM and VPD on Tc in subtropical China have shown that VPD and SM limit Tc by 90.8% and 9.2% (Song et al., 2020), respectively; the reason for this difference might be the different study timescales. Because solar radiation, VPD, and temperature affect transpiration (Granier et al., 2000; Bai et al., 2015), we excluded pixels with temperatures less than 15℃, VPD less than 5 hPa, and photosynthetic photon flux densities less than 500 µmol m-2 s-1 from the study area to control the interference of other factors in the study (Liu et al., 
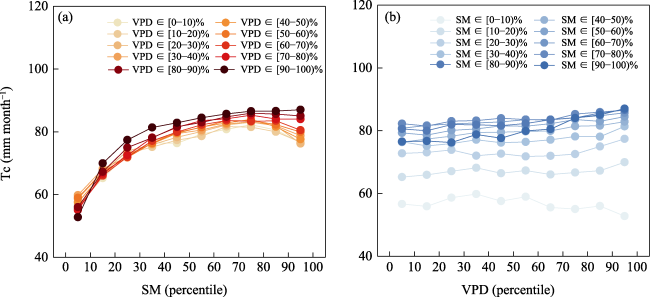
2020). Therefore, this study focused on the relative contributions of changes in VPD and SM to Tc during the growing season (mainly summer). However, Song considered the ranges of VPD and SM seasonal variations in Tc throughout the year. Considering the similarity in the seasonal patterns of VPD and Tc in the subtropical regions of China, the correlation between VPD and Tc is higher on the intra-annual scale which shows the dominant role of VPD on Tc to some extent. Recent studies have demonstrated the existence of critical thresholds for plant water stress in terrestrial ecosystems (Fu et al., 2022b, 
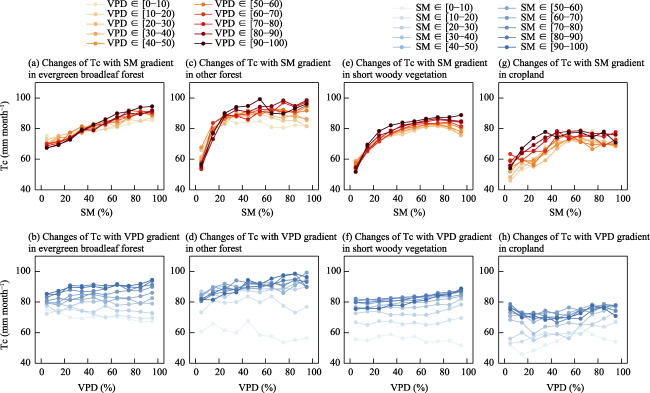
2022c). The results of this study showed that the response of Tc to SM in the study area was below the 35% threshold, where its increase contributed significantly to Tc. However, above the 35% threshold, changes in SM had a weaker effect on Tc. This indicates that there is a threshold effect on the response of vegetation to SM. Notably, although the threshold response of the VPD was not obvious, a high VPD promoted Tc when the SM was greater than the 10% threshold. Conversely, when the SM was less than the 10% threshold, a high VPD restricted the increase in Tc, indicating that the response of Tc to VPD was regulated by the SM (Liu and Biondi, 2020; Zhang et al., 2021). The high VPD in other forests was not always limited to Tc (Figure 7d), which might be due to the deep, vigorous root systems of forests that could still utilize deep soil water under atmospheric drought (McDowell et al., 2008; Zhang et al., 2020). In contrast, croplands have a greater tendency to close their stomata to reduce water consumption under water stress, because of their shallow root systems (Chen et al., 2021) (
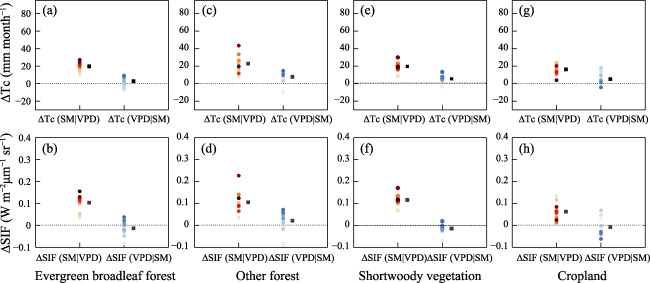
Figure 7h). High VPD and SM values contributed to Tc in forests under the same SM or VPD conditions (Figure 8a). However, croplands showed the opposite trend (Figure 8g), which may be related to environmental conditions, soil properties, and root systems across forests, short woody vegetation, and croplands (Chen et al., 
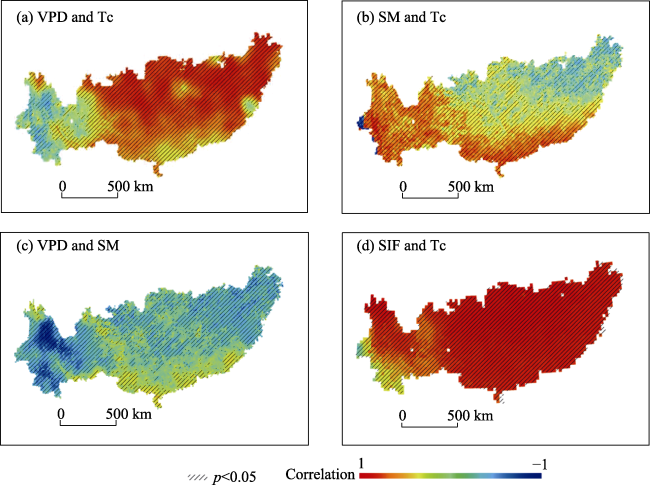
2021). In future studies, it should distinguish the sensitivity of different vegetation types to SM and VPD in ecosystem water cycle simulations. In addition, numerous recent studies have shown that SIF is closely related to Tc and can be used to represent changes in Tc (Pagán et al., 2019; Feng et al., 2021; Shan et al., 
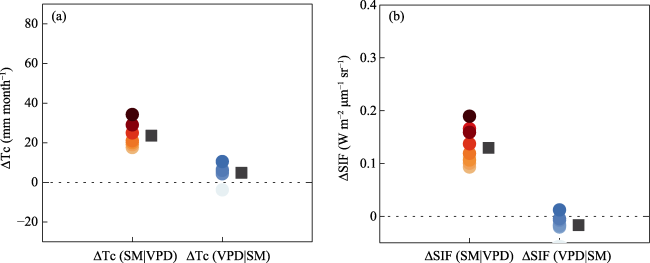
2021). Figures 3d and 8 show that using SIF is feasible, verifying the feasibility of our analysis and the reasonableness of the results, respectively.
Although this study quantified the relative effects of VPD and SM on Tc in the subtropical regions of China, there are still some limitations. First, the current study shows that SM and VPD are the most important factors affecting Tc (Liu et al., 2020; Song et al., 2020; Yu et al., 2022); however, temperature, radiation, and wind speed can also affect Tc. Therefore, in this study, we attempted to set the control conditions. For example, we excluded study areas of temperatures less than 15℃, VPD less than 5 hPa, and photosynthetic photon flux density less than 500 µmol m-2 s-1 to minimize the interference of other factors with the results. However, factors such as wind speed and vegetation growth structure were not considered because of a lack of data, and a quantitative analysis of these factors is needed in future studies. Second, despite differences in influences such as seasonal and interannual dynamics, this study focused on the average state of vegetation to represent plant response characteristics in conventional years. In the future, we will focus on the effects of interannual variability and extreme events on the driving forces of Tc. Third, the study area is mainly located in a subtropical monsoon climate zone, and the climate type is relatively single, which causes the study results to be under-representative. In the future, the sensitivity of Tc to SM and VPD under different climatic, dry, and wet conditions should be explored. This study provides insight into the relative roles of SM and VPD in Tc in humid regions. The effect of the SM on Tc in this region may increase in the future in the context of climate change.

6 Conclusions

This study explored the effects of VPD and SM, as independent driving forces, on Tc changes in subtropical China based on multi-source remote sensing data and meteorological reanalysis data using the “binning method.” The sensitivity of the Tc response to SM and VPD was further analyzed by combining different vegetation types. The results show that the effect of SM on Tc in the study area was greater than that of VPD. Overall, the relative contribution of SM to Tc was approximately five times that of VPD. The sensitivities of SM and VPD to different vegetation types were different, and the sensitivity of the four vegetation types to SM was greater than that to VPD. Different vegetation types had different thresholds for Tc response to SM with the lowest thresholds for other forests. In addition, based on the strong coupling of photosynthesis and transpiration, this study repeated the above analysis using SIF remote sensing data and derived results consistent with Tc which proved the reliability of the results of this study. These results suggest that the role of SM should be considered in future investigations on the cognition of regional water cycle climate change response patterns and the development of response strategies. Finally, attention should be paid to response differences among different land cover types.
[1]
Bai Y, Zhu G F, Su Y H et al., 2015. Hysteresis loops between canopy conductance of grapevines and meteorological variables in an oasis ecosystem. Agricultural and Forest Meteorology, 214: 319-327.

[2]
Beer C, Reichstein M, Ciais P et al., 2007. Mean annual GPP of Europe derived from its water balance. Geophysical Research Letters, 34(5): L05401.

[3]
Chen C, Riley W J, Prentice I C et al., 2022. CO2 fertilization of terrestrial photosynthesis inferred from site to global scales. Proceedings of the National Academy of Sciences, 119(10): e2115627119.

DOI

[4]
Chen N, Song C C, Xu X F et al., 2021. Divergent impacts of atmospheric water demand on gross primary productivity in three typical ecosystems in China. Agricultural and Forest Meteorology, 307: 108527.

DOI

[5]
Chen Y Y, Yang K, He J et al., 2011. Improving land surface temperature modeling for dry land of China. Journal of Geophysical Research: Atmospheres, 116: D20104.

DOI

[6]
Cheng Y M, Liu L, Cheng L et al., 2022. A shift in the dominant role of atmospheric vapor pressure deficit and soil moisture on vegetation greening in China. Journal of Hydrology, 615: 128680.

DOI

[7]
Dang C Y, Shao Z F, Huang X et al., 2022. Assessment of the importance of increasing temperature and decreasing soil moisture on global ecosystem productivity using solar-induced chlorophyll fluorescence. Global Change Biology, 28(6): 2066-2080.

DOI

[8]
Deng Y H, Wang S J, Bai X Y et al., 2020. Variation trend of global soil moisture and its cause analysis. Ecological Indicators, 110: 105939.

DOI

[9]
Denissen J M C, Teuling A J, Pitman A J et al., 2022. Widespread shift from ecosystem energy to water limitation with climate change. Nature Climate Change, 12(7): 677-684.

DOI

[10]
Feng H Z, Xu T R, Liu L Y et al., 2021. Modeling transpiration with sun-induced chlorophyll fluorescence observations via carbon-water coupling methods. Remote Sensing, 13(4): 804.

DOI

[11]
Fu Z, Ciais P, Prentice I C et al., 2022a. Atmospheric dryness reduces photosynthesis along a large range of soil water deficits. Nature Communications, 13(1): 989.

DOI

[12]
Fu Z, Ciais P, Feldman A F et al., 2022b. Critical soil moisture thresholds of plant water stress in terrestrial ecosystems. Science Advances, 8(44): eabq7827.

DOI

[13]
Fu Z, Ciais P, Makowski D et al., 2022c. Uncovering the critical soil moisture thresholds of plant water stress for European ecosystems. Global Change Biology, 28(6): 2111-2123.

DOI

[14]
Good S P, Noone D, Bowen G, 2015. Hydrologic connectivity constrains partitioning of global terrestrial water fluxes. Science, 349(6244): 175-177.

DOI

[15]
Granier A, Loustau D, Bréda N, 2000. A generic model of forest canopy conductance dependent on climate, soil water availability and leaf area index. Annals of Forest Science, 57(8): 755-765.

DOI

[16]
Green J K, Seneviratne S I, Berg A M et al., 2019. Large influence of soil moisture on long-term terrestrial carbon uptake. Nature, 565(7740): 476-479.

DOI

[17]
Grossiord C, Buckley T N, Cernusak L A et al., 2020. Plant responses to rising vapor pressure deficit. New Phytologist, 226(6): 1550-1566.

DOI PMID

[18]
Jasechko S, Sharp Z D, Gibson J J et al., 2013. Terrestrial water fluxes dominated by transpiration. Nature, 496(7445): 347-350.

DOI

[19]
Jiang P P, Meinzer F C, Wang H M et al., 2020. Below-ground determinants and ecological implications of shrub species’ degree of isohydry in subtropical pine plantations. New Phytologist, 226(6): 1656-1666.

DOI

[20]
Jin J X, Guo F S, Sippel S et al., 2020. Concurrent and lagged effects of spring greening on seasonal carbon gain and water loss across the Northern Hemisphere. International Journal of Biometeorology, 64(8): 1343-1354.

DOI PMID

[21]
Jin J X, Xiao Y Y, Jin J L et al., 2021. Spatial-temporal variabilities of the contrasting hydrometeorological extremes and the impacts on vegetation growth over the Yangtze River basin. Advances in Water Science, 32(6): 867-876. (in Chinese)

[22]
Konings A G, Gentine P, 2017. Global variations in ecosystem-scale isohydricity. Global Change Biology, 23(2): 891-905.

DOI PMID

[23]
Li Q L, Shi G S, Shangguan W et al., 2022. A 1 km daily soil moisture dataset over China using in situ measurement and machine learning. Earth System Science Data, 14(12): 5267-5286.

DOI

[24]
Li X, Xiao J F, 2019. A global, 0.05-degree product of solar-induced chlorophyll fluorescence derived from OCO-2, MODIS, and reanalysis data. Remote Sensing, 11(5): 517.

DOI

[25]
Liu L B, Gudmundsson L, Hauser M et al., 2020. Soil moisture dominates dryness stress on ecosystem production globally. Nature Communications, 11(1): 4892.

DOI PMID

[26]
Liu X S, Biondi F, 2020. Transpiration drivers of high-elevation five-needle pines (Pinus longaeva and Pinus flexilis) in sky-island ecosystems of the North American Great Basin. Science of the Total Environment, 739: 139861.

DOI

[27]
Lu H B, Qin Z C, Lin S R et al., 2022. Large influence of atmospheric vapor pressure deficit on ecosystem production efficiency. Nature Communications, 13(1): 1-4.

DOI

[28]
Lu X L, Liu Z Q, An S Q et al., 2018. Potential of solar-induced chlorophyll fluorescence to estimate transpiration in a temperate forest. Agricultural and Forest Meteorology, 252: 75-87.

DOI

[29]
Maes W H, Pagán B R, Martens B et al., 2020. Sun-induced fluorescence closely linked to ecosystem transpiration as evidenced by satellite data and radiative transfer models. Remote Sensing of Environment, 249: 112030.

DOI

[30]
McDowell N, Pockman W T, Allen C D et al., 2008. Mechanisms of plant survival and mortality during drought: Why do some plants survive while others succumb to drought? New Phytologist, 178(4): 719-739.

DOI PMID

[31]
McDowell N G, Allen C D, 2015. Darcy’s law predicts widespread forest mortality under climate warming. Nature Climate Change, 5(7): 669-672.

DOI

[32]
Martens B, Miralles D G, Lievens H et al., 2017. GLEAM v3: Satellite-based land evaporation and root-zone soil moisture. Geoscientific Model Development, 10(5): 1903-1925.

DOI

[33]
Miralles D G, De Jeu R A M, Gash J H et al., 2011. Magnitude and variability of land evaporation and its components at the global scale. Hydrology and Earth System Sciences, 15(3): 967-981.

DOI

[34]
Miralles D G, Jiménez C, Jung M et al., 2016. The WACMOS-ET project (Part 2): Evaluation of global terrestrial evaporation data sets. Hydrology and Earth System Sciences, 20(2): 823-842.

DOI

[35]
Miralles D G, Van Den Berg M J, Gash J H et al., 2014. El Niño-La Niña cycle and recent trends in continental evaporation. Nature Climate Change, 4(2): 122-126.

DOI

[36]
Mohammed G H, Colombo R, Middleton E M et al., 2019. Remote sensing of solar-induced chlorophyll fluorescence (SIF) in vegetation: 50 years of progress. Remote Sensing of Environment, 231: 111177.

DOI

[37]
Novick K A, Ficklin D L, Stoy P C et al., 2016. The increasing importance of atmospheric demand for ecosystem water and carbon fluxes. Nature Climate Change, 6(11): 1023-1027.

DOI

[38]
Oren R, Sperry J S, Katul G G et al., 1999. Survey and synthesis of intra- and interspecific variation in stomatal sensitivity to vapour pressure deficit. Plant Cell & Environment, 22(12): 1515-1526.

[39]
Pagán B R, Maes W H, Gentine P et al., 2019. Exploring the potential of satellite solar-induced fluorescence to constrain global transpiration estimates. Remote Sensing, 11(4): 413.

DOI

[40]
Peng C H, Ma Z H, Lei X D et al., 2011. A drought-induced pervasive increase in tree mortality across Canada’s boreal forests. Nature Climate Change, 1(9): 467-471.

DOI

[41]
Phillips O L, Aragao L E, Lewis S L et al., 2009. Drought sensitivity of the Amazon rainforest. Science, 323(5919): 1344-1347.

DOI PMID

[42]
Rawson H M, Begg J E, Woodward R G, 1977. The effect of atmospheric humidity on photosynthesis, transpiration and water use efficiency of leaves of several plant species. Planta, 134(1): 5-10.

DOI PMID

[43]
Ray J D, Gesch R W, Sinclair T R et al., 2022. The effect of vapor pressure deficit on maize transpiration response to a drying soil. Plant and Soil, 239(1): 113-121.

DOI

[44]
Sage R F, Kubien D S, 2007. The temperature response of C3 and C4 photosynthesis. Plant, Cell & Environment, 30(9): 1086-1106.

[45]
Seneviratne S I, Corti T, Davin E L et al., 2010. Investigating soil moisture-climate interactions in a changing climate: A review. Earth-Science Reviews, 99(3/4): 125-161.

DOI

[46]
Shan N, Zhang Y G, Chen J M et al., 2021. A model for estimating transpiration from remotely sensed solar-induced chlorophyll fluorescence. Remote Sensing of Environment, 252: 112134.

DOI

[47]
Song X W, Lyu S D, Wen X F, 2020. Limitation of soil moisture on the response of transpiration to vapor pressure deficit in a subtropical coniferous plantation subjected to seasonal drought. Journal of Hydrology, 591: 125301.

DOI

[48]
Talsma C J, Good S P, Jimenez C et al., 2018. Partitioning of evapotranspiration in remote sensing-based models. Agricultural and Forest Meteorology, 260: 131-143.

[49]
Wang P, Tong X L, Qiu J X et al., 2022. Amplification effect of urbanization on atmospheric aridity over China under past global warming. Earth’s Future, 10(5): e2021EF002335.

[50]
Wang Y P, Li R, Min Q L et al., 2019. A three-source satellite algorithm for retrieving all-sky evapotranspiration rate using combined optical and microwave vegetation index at twenty AsiaFlux sites. Remote Sensing of Environment, 235: 111463.

DOI

[51]
Yu T, Jiapaer G, Bao A M et al., 2022. Disentangling the relative effects of soil moisture and vapor pressure deficit on photosynthesis in dryland Central Asia. Ecological Indicators, 137: 108698.

DOI

[52]
Yuan W P, Cai W W, Chen Y et al., 2016. Severe summer heatwave and drought strongly reduced carbon uptake in southern China. Scientific Reports, 6(1): 1-12.

DOI

[53]
Yuan W P, Zheng Y, Piao S L et al., 2019. Increased atmospheric vapor pressure deficit reduces global vegetation growth. Science Advances, 5(8): eaax1396.

DOI

[54]
Zhang J W, Guan K Y, Peng B et al., 2021. Sustainable irrigation based on co-regulation of soil water supply and atmospheric evaporative demand. Nature Communications, 12(1): 5549.

DOI PMID

[55]
Zhang Y, Parazoo N C, Williams A P et al., 2020. Large and projected strengthening moisture limitation on end-of-season photosynthesis. Proceedings of the National Academy of Sciences, 117(17): 9216-9222.

DOI

[56]
Zhang Y Q, Kong D D, Gan R et al., 2019. Coupled estimation of 500 m and 8-day resolution global evapotranspiration and gross primary production in 2002-2017.Remote Sensing Environment, 222: 165-182.

[57]
Zhang Y Q, Kong D D, Zhang X Z et al., 2021. lmpacts of vegetation changes on global evapotranspiration in the period 2003-2017. Acta Geographica Sinica, 76(3): 584-594. (in Chinese)

Outlines

/