Research Articles

Effective soil particle size distributions and critical size of enrichment/depletion in splash erosion for loessial soil

  • QI Xiaoqian , 1 ,
  • CHENG Xike 1 ,
  • LIU June , 1, * ,
  • ZHOU Zhengchao 1 ,
  • WANG Ning 1 ,
  • SHEN Nan 2 ,
  • MA Chunyan 3 ,
  • WANG Zhanli 2
Expand
  • 1. School of Geography and Tourism, Shaanxi Normal University, Xi’an 710119, China
  • 2. State Key Laboratory of Soil Erosion and Dryland Farming on the Loess Plateau, Institute of Soil and Water Conservation, Northwest A&F University, Yangling 712100, Shaanxi, China
  • 3. Yulin University, Shaanxi Key Laboratory of Ecological Restoration in Shaanbei Mining Area, Yulin 719000, Shaanxi, China
*Liu June (1987-), Associate Professor, E-mail:

Qi Xiaoqian (1997-), Master Candidate, E-mail:

Received date: 2022-08-04

  Accepted date: 2023-07-17

  Online published: 2023-10-08

Supported by

National Natural Science Foundation of China(42077058)

National Natural Science Foundation of China(41601282)

National Natural Science Foundation of China(41867015)

Young Talent Fund of University Association for Science and Technology in Shaanxi, China(20210705)

Fundamental Research Funds for Central Universities(GK202309005)

Shaanxi Provincial Key Research and Development Program(2021ZDLSF05-02)

Abstract

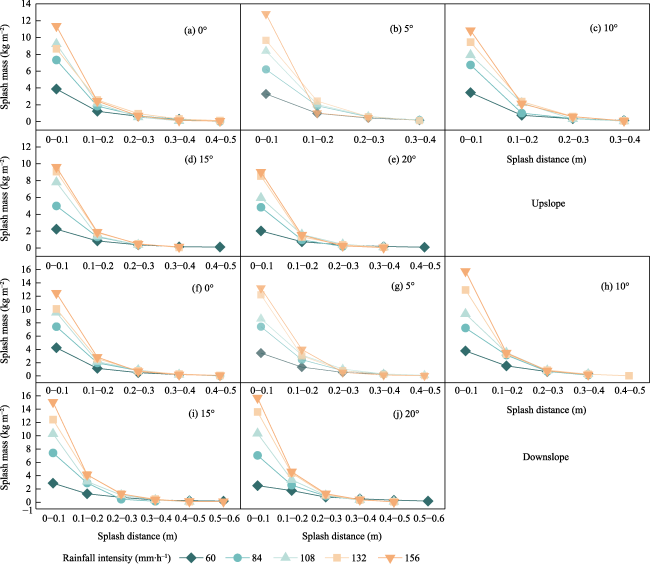
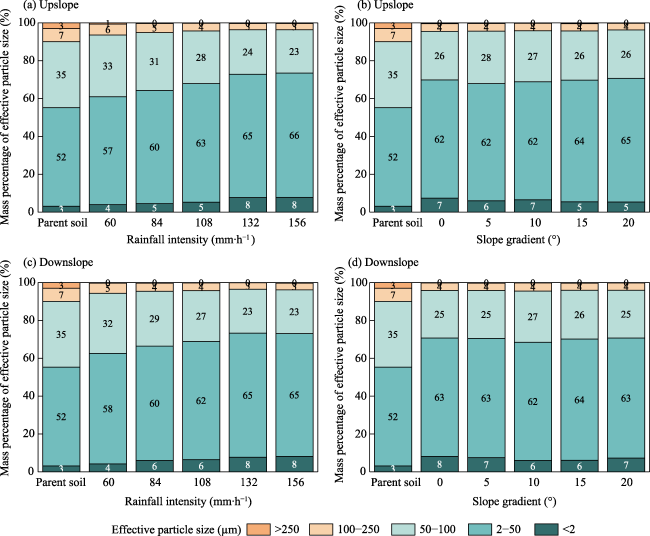
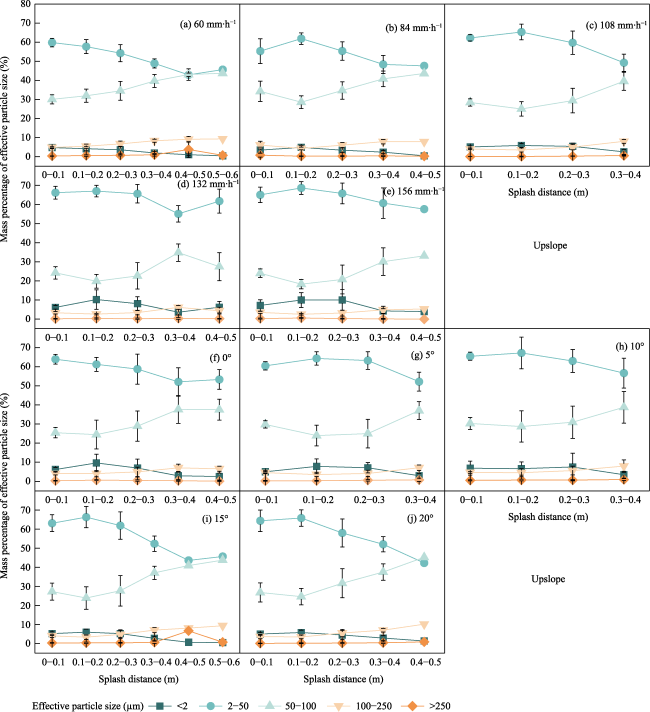
Effective soil particle size composition can more realistically reflect the particle size sorting process of erosion. To reveal the individual contributions of rainfall intensity and slope to splash erosion, and to distinguish the enrichment ratio of each size and the critical size in splash, loessial soil collected on the Loess Plateau in May 2019 was tested under different rainfall intensities (60, 84, 108, 132, 156 mm h-1) and slopes (0°, 5°, 10°, 15°, 20°). The results demonstrated that 99% of splash mass was concentrated in 0-0.4 m. Rainfall intensity was the major factor for splash according to the raindrop generation mode by rainfall simulator nozzles. The contributions of rainfall intensity to splash erosion were 82.72% and 93.24%, respectively in upslope and downslope direction. The mass percentages of effective clay and effective silt were positively correlated with rainfall intensity, while the mass percentages of effective very fine sand and effective fine sand were negatively correlated with rainfall intensity. Opposite to effective very fine sand, the mass percentages of effective clay significantly decreased with increasing distance. Rainfall intensity had significant effects on enrichment ratios, positively for effective clay and effective silt and negatively for effective very fine sand and effective fine sand. The critical effective particle size in splash for loessial soil was 50 µm.

Cite this article

QI Xiaoqian , CHENG Xike , LIU June , ZHOU Zhengchao , WANG Ning , SHEN Nan , MA Chunyan , WANG Zhanli . Effective soil particle size distributions and critical size of enrichment/depletion in splash erosion for loessial soil[J]. Journal of Geographical Sciences, 2023 , 33(10) : 2113 -2130 . DOI: 10.1007/s11442-023-2168-9

1 Introduction

Splash erosion is a process in which soil particles are detached and transported due to the impact of raindrops, and splash erosion is the initial step in the water erosion process (Quansah, 1981; Van Dijk et al., 2002; Kinnell, 2005; Angulo-Martínezet et al., 2012). Splash erosion provides loose sediments for the later erosion process (Zhang et al., 2020; Li et al., 2021). Therefore, the study of splash amount and particle size sorting characteristics can help reveal the characteristics of splash and understand the soil erosion process deeply. Soil properties, rainfall characteristics and topographic factor are the main factors affecting splash erosion (Legout et al., 2005; Ma et al., 2014a; Wang et al., 2014; Yao et al., 2018; Zhang et al., 2022; Shi and Zhang, 2023), and the influences of rainfall properties and slope gradients on splash erosion are the most widely studied, especially the influences of rainfall intensity on splash erosion (Quansah, 1981; Mermut et al., 1997; Janeau et al., 2003; Ma et al., 2014b; Wang and Shi, 2015; Hu et al., 2016; Mahmoodabadi and Sajjadi, 2016; Sadeghi et al., 2017; Wu et al., 2019). However, some scholars choose the raindrop kinetic energy to investigate the splash erosion process (Qin et al., 2014; Hu et al., 2016; Sun et al., 2021). Raindrop kinetic energy is a key factor affecting splash erosion (Hu et al., 2016), which depends on the number, size and fall velocity of raindrops (Wischmeier et al., 1971).
Many researchers have studied the influences of rainfall characteristics and slope on the particle size sorting in splash erosion. Sajjadi and Mahmoodabadi (2015) revealed that the transportability of fine particles <0.043 mm was higher than that of larger particles under high rainfall intensity. Sadeghi et al. (2017) indicated that the contents of clay, silt, and sand in the upper and lower directions were significantly different from the soil matrix when the slope was 5% and 15%, while there was no significant difference when the slope was 25% under different rainfall intensities. Kiani-Harchegani et al. (2019) suggested that the components of splashed particles were influenced by both rainfall intensity and slope gradient, but the percentages of very fine silt (2-4 µm), fine silt (4-8 µm), medium silt (8-16 µm), and sand (>63 µm) were mainly affected by slope gradient, while the contents of clay (<2 µm), coarse silt (16-32 µm), and very coarse silt (32-63 µm) were greatly controlled by rainfall intensity. Zhang et al. (2020) reported that the mean weight diameter (MWD) of splash materials was smaller than that of the soil matrix under different combinations of rainfall intensity and slope. Some researchers have suggested that soil particle size sorting in splash erosion is influenced by the kinetic energy of raindrops. Splash erosion transports an increased content of coarse particles when raindrop kinetic energy increases (Qin et al., 2014; Yao et al., 2018; Fu et al., 2020), and higher kinetic energy is capable to transport soil particles further (Cheng et al., 2015). The comprehensive influences, especially for the individual contributions of rainfall characteristics and slope gradient to splash erosion, deserve further study.
The splash amount and particle size distribution at different distances can indicate the sorting of soil particles during splash transportation. Related studies have shown that the splash amount decreases exponentially with increasing distance (Savat and Poesen, 1981; Torri et al., 1987; van Dijk et al., 2002; Legout et al., 2005; Cheng et al., 2015; Wang et al., 2018; Yao et al., 2018). Soil with different properties exhibits diverse sensitivities to distance during splash erosion (Fu et al., 2020). Soil with high aggregate stability has a longer splash distance than soil with low aggregate content (Legout et al., 2005). The splash distances of particles in various sizes were also different. Epstein and Grant (1967) and Kinnell (2005) reported that small particles had a longer splash distance than large particles under the same rainfall intensity. Legout et al. (2005) and Fu et al. (2020) also indicated that large aggregates were deposited at relatively close distances, while other studies showed that median sizes of splash particles decreased with increasing distance (Savat and Poesen, 1981; Cheng et al., 2015). Leguedois (2005) believed that the splash distance of soil particles at 100-200 μm was the largest, while the splash distance decreased for smaller and larger particles. Fu et al. (2016) suggested that the distribution of splash particles at different distances was complicated and exhibited no obvious regularity. The distributions of varied splash particle sizes at different distances need to be further clarified.
The enrichment ratio is an important index to illustrate the sorting of soil particles in splash erosion. Some studies showed that small particles were enriched and large particles were lost (Legout et al., 2005; Ma et al., 2014b; Fu et al., 2019). However, there were considerable differences among the particle sizes of enrichment and loss. The critical particle size of splash was used as an indicator to describe the size threshold at which enrichment became depletion. At present, only a few studies have determined the critical particle size of enrichment/depletion in splash erosion. The critical particle size was 1 mm, 50 µm and 250 µm for black soil (Zhou et al., 2008), lou soil (Liu et al., 2016a) and dark loessial soil (Fu et al., 2019), respectively. There is still a lack of studies about the critical particle size of enrichment/depletion in splash erosion for loessial soil on the Loess Plateau.
There are two main expressions of soil particle size. One is the ultimate particle size measured under complete chemical dispersion, the other is the effective particle size mea- sured without chemical dispersion. Effective soil particle size composition refers to the particle size distribution of single particles and aggregates (Shen et al., 2021), which can more realistically reflect the particle size sorting process of surface erosion (Shi et al., 2017). Considering the investigations on the size of splashed particles (including soil aggregates and primary particles or no particular emphasis), the current study aimed at the effective soil particle size distributions. Taking the loessial soil on the Loess Plateau as material under different rainfall intensities and slopes, the objectives were: (1) to study the distributions of splash mass with distances, and determine the individual contribution of rainfall parameters and slope gradient to splash; (2) to analyze the effective size distributions of various splashed particles at different distances; and (3) to clarify the critical effective size of enrichment/depletion in splash erosion.

2 Materials and methods

2.1 Soil properties

The soil samples for testing were collected in May 2019 from Ansai in the hinterland of the Loess Plateau (a typical hilly gullied loess region). The soil was a silt loam (USDA) collected from 0-25 cm depth of the tillage layer. All soil samples were air-dried and passed through a 10-mm sieve to remove small stones and plant residues. The soil after sieving is treated without chemical dispersion and the effective particle size of the soil is determined directly by the Malvern Mastersizer 2000 laser (Table 1).
Table 1 Effective particle size composition of loessial soil
Effective particle size composition (%) Bulk density
(g cm‒3)
Organic matter content (%)
<2 μm 2-50 μm 50-100 μm 100-250 μm >250 μm
3.16 52.06 34.81 6.95 3.02 1.2 0.9

2.2 Equipment

Experiments were conducted in the rainfall simulation laboratory of the State Key Laboratory of Soil Erosion and Dryland Farming on the Loess Plateau, Yangling, China. With a height of 16 m, the side spray simulator could cause raindrops to reach the terminal velocity,and the rainfall uniformity exceeded 80%. Tap water was used for the test (Zhang et al., 2020). The collecting device consisted of a source circle and eight concentric circles (Figure 1). The source circle, with a height of 100 mm and a diameter of 200 mm, contained holes on the bottom for penetrating rainfall. Two baffles are welded at the same position of the 8 concentric circles, and the baffles divide the concentric circles equally into two parts, indicating the upslope direction and downslope direction respectively. Eight concentric circles had the same height, and their diameters decreased by increments of 100 mm. Along the downslope of the semicircle, a 2 mm gap was set up to prevent the runoff sediments from entering the nearest ring. On the bottom of each ring, there was a 5 mm hole connecting a pipe for collecting splashed particles. The holes were blocked by rubber stoppers during rain. The device was set on a base bracket, and the gradient could be adjusted. To ensure that only the source soils could be impacted by rainfall, a plastic canopy was placed above the device, with a 200 mm hole in the center. This cover was 2 m high enough not to disturb the trajectories of splashed soils. The soil in source circle was at actual bulk density in the field of 1.2 g cm‒3 and water content of 14% before rainfall. The height of soil surface is on the horizontal plane with the circle.
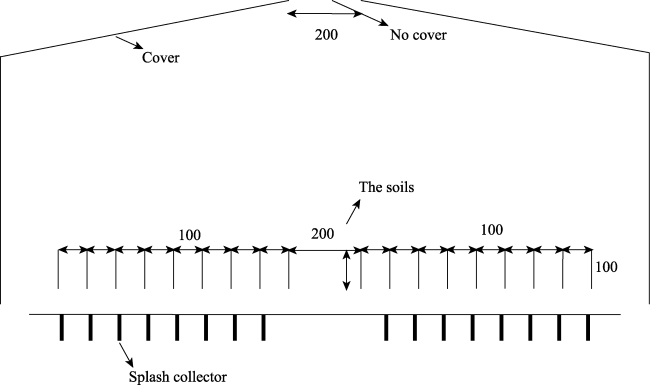
Figure 1 Schematic design of the device (mm)

2.3 Measurements

The rainfall on the Loess Plateau is characterized by short duration and high intensity. A series of 25 combinations of 5 rainfall intensities (60, 84, 108, 132, 156 mm h‒1) and 5 slope gradients (0°, 5°, 10°, 15°, 25°) were tested. The rainfall intensities (I) conformed to rainfall characteristics of the Loess Plateau (Jiao et al., 1999; Qu et al., 2022; Wang et al., 2022). The raindrop diameters (D50) were calculated by color spot method (Hall, 1970). A filter paper coated with 1:10 mixture of eosin and talcum powder was placed in the rainfall area. Color spots will appear when raindrops fall on the filter paper. The raindrop diameter was calculated from the color spot diameter, and then the raindrop velocity (Vm) and kinetic energy (KE) were derived. The specific calculation procedure is consistent with Hu et al. (2016). The rainfall intensity, raindrop diameter, raindrop velocity and kinetic energy in this experiment were shown in Table 2.
Table 2 Five rainfall conditions
I (mm h‒1) D50 (mm) Vm (m s‒1) KE (10‒7 J)
60 1.83 6.65 70.88
84 1.89 6.83 82.38
108 1.96 6.88 93.37
132 1.7 6.25 50.20
156 1.68 6.19 47.49
Each soil sample underwent rainfall periods lasting 30 min, being enough to obtain a sufficient mass of splashed particles in rings to measure the size distributions. Two replications were conducted. At the end of each test, the splashed particles in every ring were collected in both upward and downward directions. Malvern Mastersizer 2000 laser was then used to derive the distributions at five particle sizes (<2, 2-50, 50-100, 100-250, >250 µm). After that, all splashed particles were oven-dried for 24 h at 105°C to determine mass.

2.4 Calculations

2.4.1 The splash mass

The splash erosion was calculated as follows:
$M={\text{m}}/{s}\;$
where M is the splash mass (kg m‒2); m is the weight of splash particles (kg); and s is the area of the ring (m2).

2.4.2 Contribution rate

The contribution rate represents the influence of each independent variable on the dependent variable and was calculated by the following formula (Holrott, 1983):
${{P}_{i}}={{R}^{2}}\times \beta _{i}^{2}/\sum\limits_{i=1}^{n}{\beta _{i}^{2}}\times 100%$
where Pi is the contribution rate of the ith factor; R2 is complex regression squared; βi=biσxi/σy, where bi is the regression coefficient of the ith factor, σxi is the mean square error of the ith factor, and σy is the mean square error of the dependent variable.

2.4.3 Enrichment ratio

The enrichment ratio (ER) can express the sorting process of splash erosion. ER > 1 indicates enrichment of this component, and ER < 1 indicates that this component is depleted. Moreover, ER=1 shows no particle sorting effects (Legout et al., 2005), representing the critical effective particle size of enrichment/depletion appears.
$ER={{{P}_{sp}}}/{{{P}_{sa}}}\;$
where Psp is the mass percentage of splash for each effective particle size, and Psa is the mass percentage of soil matrix for each effective particle size.

3 Results

3.1 The distributions of total splash mass with distance

Under different slopes and rainfall intensities, the distributions of splash mass on the upslope and downslope with distance are shown in Figure 2. The results indicated that the amount of splash gradually decreased with increasing distance, and increased with increasing rainfall intensity. The downward splash mass was greater than upward mass. The further splash distance was in downslope direction. In upslope and downslope, a total of 99% particles were concentrated at 0-0.4 m.
Figure 2 The upslope and downslope distributions of splash mass with distances
Based on the amount of splash particles collected in each ring within 30 minutes, the splash mass decreased exponentially with increasing distance, and R2 was above 0.97 (Table 3). The formula was as follows:
mr = aebr
where r is the splash distance (m), mr is the unit splash mass (kg m‒2), and a and b are constants.
Table 3 Values of a and b in formula mr = aebr under different rainfall intensities and slope gradients
Directions Slopes Rainfall intensities (mm h‒1) a b R2
Upward 60 7.874 -0.834 0.98
84 29.559 -1.308 0.99
108 41.714 -1.478 0.99
132 22.659 -1.048 0.99
156 35.231 -1.296 0.99
60 7.774 -0.960 0.99
84 19.296 -1.158 0.99
108 19.296 -1.159 0.99
132 19.296 -1.160 0.99
156 19.296 -1.161 0.98
10° 60 7.559 -1.003 0.98
10° 84 20.886 -1.348 0.99
10° 108 44.387 -1.609 0.99
10° 132 44.816 -1.482 0.99
10° 156 48.545 -1.516 0.99
15° 60 3.816 -0.741 0.99
15° 84 18.280 -1.309 0.99
15° 108 33.972 -1.533 0.99
15° 132 53.080 -1.671 0.99
15° 156 37.421 -1.447 0.99
20° 60 3.873 -0.771 0.99
20° 84 25.041 -1.639 0.99
20° 108 23.024 -1.338 0.99
20° 132 36.707 -1.566 0.99
20° 156 59.308 -1.843 0.99
Downward 60 9.868 -0.982 0.99
84 31.853 -1.317 0.99
108 30.513 -1.231 0.99
132 29.400 -1.173 0.99
156 36.443 -1.253 0.99
60 7.746 -0.859 0.99
84 21.871 -1.093 0.99
108 26.610 -1.091 0.99
132 50.244 -1.385 0.99
156 60.245 -1.491 0.99
10° 60 8.757 -0.861 0.99
10° 84 36.422 -1.373 0.96
10° 108 32.863 -1.192 0.99
10° 132 55.590 -1.399 0.99
10° 156 63.743 -1.442 0.99
15° 60 4.222 -0.571 0.98
15° 84 33.625 -1.373 0.98
15° 108 34.098 -1.173 0.99
15° 132 48.969 -1.245 0.99
15° 156 33.658 -1.051 0.99
20° 60 4.474 -0.540 0.98
20° 84 22.409 -1.078 0.99
20° 108 35.129 -1.177 0.99
20° 132 50.936 -1.262 0.99
20° 156 70.169 -1.367 0.99
In the upslope, Pearson Correlation Analysis showed that there was a positive correlation between a and rainfall intensity (R2 = 0.737, p < 0.01), and a negative correlation between b and rainfall intensity (R2 = -0.598, p < 0.01), while a, b was insignificantly correlated with other rainfall characteristics (raindrop diameter, raindrop velocity and kinetic energy) and slope. In the downslope, a had a positive correlation with rainfall intensity (R2 = 0.856, p < 0.01), while b had a negative correlation with rainfall intensity (R2 = -0.681, p < 0.01). Raindrop diameter, raindrop velocity and kinetic energy had negative effects on a (R2 = -0.525, -0.591 and -0.507 (p < 0.01), respectively), and had insignificant effects on b. Slope had insignificant effects on both a and b. The contribution rates of slope and rainfall intensity to splash erosion were 7.38% and 82.72%, respectively, in upslope, while 1.66% and 93.24%, respectively, in downslope. The results indicated that rainfall intensity was the main factor in splash erosion, rather than slope, raindrop diameter, raindrop velocity or kinetic energy.

3.2 Effective size distributions of splashed particles

3.2.1 Effective size distributions with rainfall intensities and slopes

The effective size distributions upward and downward of splashed particles under different rainfall intensities and slopes are shown in Figure 3. On upslope and downslope, the mass percentage of effective silt content (2-50 µm) was the maximum and that of effective medium sand content (>250 µm) was the minimum under all rainfall intensities and slopes. Fine particles were splashed more easily by raindrops. The effective sizes of splashed particles were mainly concentrated within <250 µm.
Figure 3 Mass percentages of various splashed particle sizes on upward and downward with different rainfall intensities and slopes
In upslope and downslope directions, the mass percentages of effective clay (<2 µm) and effective silt (2-50 µm) were positively correlated with rainfall intensity, while those of effective very fine sand (50-100 µm) and effective fine sand (100-250 µm) were negatively correlated with rainfall intensity. As the slope increases, the mass percentage of effective clay (<2 µm) generally decreased in the upslope and downslope directions. The mass percentage of effective clay (<2 μm) on downslope was higher than that on upslope. However, there as no significant difference in the size distributions of other effective particles under different slopes and directions.

3.2.2 Effective size distributions with distances

Figures 4 and 5 show the mass percentages of various sizes upward and downward at different splash distances (0-0.1, 0.1-0.2, 0.2-0.3, 0.3-0.4, 0.4-0.5 and 0.5-0.6 m) under five rainfall intensities and five slopes. In all conditions, the mass percentages of effective silt (2-50 µm) were the largest, followed by the mass percentage of effective very fine sand (50-100 µm), and the mass percentage of the effective medium sand (>250 µm) was the smallest at different distances. In addition, the mass percentages of effective clay (<2 µm) were small. In the upslope and downslope, the contents of effective clay (<2 µm) significantly decreased with increasing distance, while the contents of effective very fine sand (50-100 µm) significantly increased with increasing distance.
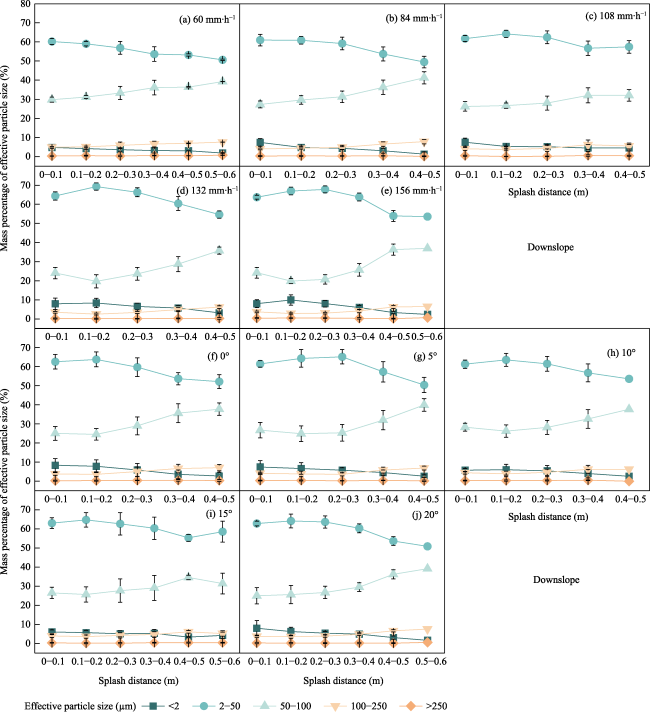
Figure 4 Upslope mass percentages of various sizes with different distances, rainfall intensities and slopes
Figure 5 Downslope mass percentages of various sizes with different distances, rainfall intensities and slope gradients

3.3 Critical effective particle size of enrichment/depletion in splash erosion

3.3.1 Enrichment ratio of various effective size particles

The enrichment ratio is an important index reflecting the effect of splashing on soil particle sorting. Under different rainfall intensities and slopes, the enrichment ratios of various effective particles on upward and downward are shown in Figure 6. Effective clay (<2 µm) and effective silt (2-50 µm) showed enrichment (ER > 1) at all rainfall intensities and slopes, while depletion (ER < 1) occurred for effective very fine sand (50-100 µm), effective fine sand (100-250 µm) and effective medium sand (>250 µm). The enrichment ratio of effective clay (<2 µm) and effective silt (2-50 µm) increased with increasing rainfall intensity. With effective particle size 50 µm as the cut-off point, the enrichment ratio of effective very fine sand (50-100 µm) and effective fine sand (100-250 µm) decreased with the increase of rainfall intensity. The effective medium sand (>250 µm) showed no significant difference in enrichment ratio among all rainfall intensities. There were no differences among the enrichment ratios of each effective size at all slopes, except for the effective clay (<2 µm).
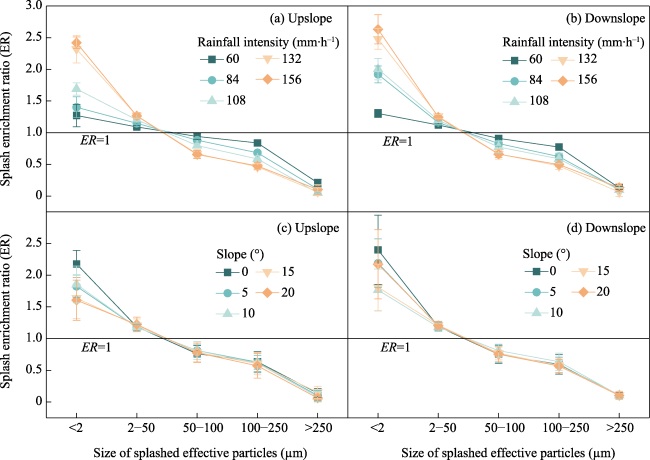
Figure 6 Enrichment ratios of various particles on upward and downward with different rainfall intensities and slopes
In the upward and downward, Pearson correlation tests showed that the enrichment ratios of effective clay (<2 µm) and effective silt (2-50 µm) had positive linear correlations with rainfall intensity (p < 0.01), while the enrichment ratios of effective very fine sand (50-100 µm) and effective fine sand (100-250 µm) had negative linear correlations with rainfall intensity (p < 0.01) (Table 4). The correlation coefficients between slope and various effective particle enrichment ratios were all less than 0.1, which were not listed.
Table 4 Relationships between enrichment ratios and rainfall intensities
Effective particle sizes (µm) Regression equations R2
Upward 0.01-2 ER = 0.3215 I + 0.8562 0.94
2-50 ER = 0.047 I + 1.0544 0.94
50-100 ER = -0.0784 I + 1.024 0.96
100-250 ER = -0.0945 I + 0.8927 0.91
Downward 0.01-2 ER = 0.3214 I + 1.1035 0.94
2-50 ER = 0.0346 I + 1.0929 0.91
50-100 ER = -0.0667 I + 0.9682 0.95
100-250 ER = -0.0699 I + 0.8008 0.87

3.3.2 Critical effective particle size of enrichment/depletion in splash

Currently, there is a lack of research about the critical effective particle size of enrichment/depletion in splash for loessial soil on the Loess Plateau. As shown in Figure 6, the critical effective size was 50 µm, which meant that it was difficult for loessial soil to be transported by raindrops when the effective particle size was greater than 50 µm.

4 Discussion

4.1 The distributions of total splash mass with distance

The splash mass decreased exponentially with increasing distance (Savat and Poesen, 1981; Torri et al., 1987; Van Dijk et al., 2002; Legout et al., 2005; Fu et al., 2017, 2020; Yao et al., 2018). The majority of splashed particles were concentrated at 0-0.4 m (Ploey and Savat, 1968). With increasing distance, it was more difficult for splashed particles to reach because the resistance of soil particles being detached and transported by raindrops made them be concentrated in a short distance. The downward splash mass (Afshin et al., 2011; Fu et al., 2011; Grismer, 2012; Liu et al., 2015; Saedi et al., 2016; Sadeghi et al., 2017) was greater than upward, and splash distance was further. The reason was that splashed particles tended to move downward due to gravity and inertial forces (Wang et al., 2014). The splash distance was the farthest at rainfall intensities of 132 and 156 mm h‒1 (Figure 2). The splash distance depended on the transport process, which could be controlled by the availability of raindrops kinetic energy comparable to the weight and size of the detachment particles (Sadeghi et al., 2017). Although the raindrop kinetic energy and diameter decreased at rainfall intensities of 132 and 156 mm h‒1, the number of raindrops increased, and particles splashed by raindrops became more and smaller. Since small particles were less affected by gravity and air resistance, the transported distances were longer (Legouta et al., 2005; Yao et al., 2018; Fu et al., 2020). Therefore, the rainfall intensities of 132 and 156 mm h‒1 could transport soil to further distances. It is worth noting that splash distance of 0.6 m was the farthest at slope of 15° and 20°. This result indicated that slope had a greater influence on the splash distance when the rainfall intensity was low and the slope was steep (Liu et al., 2015). Studied showed that slope had a definite effect on splash (Quansah, 1981; Zhang et al., 2002; Fu et al., 2011; Liu et al., 2015; Mahmoodabadi and Sajjadi, 2016). In contrast, some studies indicated that the effect of slope gradients on splash erosion was insignificant (Morgan, 1978; Mermut et al., 1997; Iserloh et al., 2012; Kiani-Harchegani et al., 2019). In this study, the sensitivity of splash erosion to rainfall intensity was higher than that to slope, only when the rainfall intensity was low and the slope was steep, the effect of slope on splash erosion started to appear apparently.
Splash erosion increased with increasing rainfall intensity (Savat and Poesen, 1981; Torri et al., 1987; van Dijk et al., 2002; L egout et al., 2005; Yao et al., 2018; Fu et al., 2020). Rainfall intensity was the main factor in this study, rather than slope, raindrop diameter, raindrop velocity or kinetic energy. However, rainfall kinetic energy was demonstrated to be a key factor to describe splash erosion (Wischmeier et al., 1971; Stocking and Elwell, 1976; Ghadiri and Payne, 1977; Hu et al., 2016). In this experiment, kinetic energy was not an ideal indicator as rainfall intensity. The reason could be concluded to the raindrop generation mode by rainfall simulator nozzles. As the rainfall intensity increased, the water pressure was enhanced, the diameter of raindrops sprayed out by rainfall simulator nozzles became smaller, and the velocity of raindrops decreased, but the number of raindrops increased, carrying more soil particles and resulting in increased splash. Although the energy of a single raindrop was very small and the effect was minimal, the splash was actually the total effect of many raindrops (Zhao and Wu, 2001; Ma et al., 2008).

4.2 Effective size distributions of splashed particles

The splashed material contained less effective coarse particles (>100 µm) and more effective fine particles (2-50 µm) (except for effective clay: <2 µm). There were two reasons for the small splashed amounts of large particle sizes. Firstly, more energy was required to detach and transport larger particles, so the transportability of large particles was small (Terry, 1998). Secondly, during rainfall, aggregates were destroyed, and large aggregates were decomposed into microaggregates (Plante et al., 2002). The reason for the lower content of ef- fective clay (<2 μm) was that finer particles expanded after absorbing water, and the adhesion between soil particles increased, forming crust on the soil surface, so the splash of effective clay (<2 µm) was less likely to occur (Cheng et al., 2015).
The mass percentages of finer effective soil particles (<50 µm) increased gradually with increasing rainfall intensity, and the percentages of coarser effective particles (>50 µm) decreased gradually with increasing rainfall intensity. The same conclusion was obtained by Wang et al. (2014), who noted that high rainfall intensity could break up soil aggregates and lead to an increased abundance of fine particles. However, Yao et al. (2018) found that the mass percentages of finer particles (<50 µm, including <2 µm, 2-20 µm and 20-50 µm) were negatively correlated with rainfall intensity, while those of coarser particles (>50 µm, including 50-200 µm and 200-2000 µm) increased with increasing rainfall intensity. It has been interpreted that higher kinetic energy is provided at higher rainfall intensities to detach and transport larger particles. In this study, the kinetic energy of raindrops showed an increase with increasing rainfall intensity firstly and then decreased at a rainfall intensity of 132 mm h‒1 (Table 2). As the rainfall intensity increased from 60 mm h‒1 to 108 mm h‒1, the kinetic energy of raindrops increased, and the mass percentage of effective large particles gradually decreased. This result indicated that the fragmentation degree of aggregates increased as raindrops kinetic energy increased (Fu et al., 2016), and there was a process of increasing the content of fine particles due to the breakup of aggregates (Le Bissonnais, 1996; Ghahramani et al., 2011; Ma et al., 2014b). Under rainfall intensities of 132 and 156 mm h‒1, the raindrops diameter decreased, leading to the reduced raindrops kinetic energy and few opportunities to transport large particles (Qin et al., 2014).
On the upslope and downslope, the mass percentages of effective clay (<2 µm) significantly decreased with increasing distance, while the mass percentages of effective very fine sand (50-100 µm) significantly increased with increasing distance. This result was different from that obtained by Yao et al. (2018). The reason may be due to the effect of secondary raindrop splash erosion on the splashed soil particles (Fu et al., 2020). The raindrop hit the soil and dispersed into small raindrops. Then, the small dispersed raindrops and the mixture of raindrops and splashed soil particles were all affected by the initial kinetic energy, gravity and air resistance, and fell at a close distance thereafter, causing secondary damage to the splashed aggregates in rings. As a result, the large aggregates at close range were broken up into smaller ones again (Fu et al., 2019).

4.3 Critical effective particle size of enrichment/depletion in splash erosion

Large aggregates were composed of microaggregates (Plante et al., 2002; Ma et al., 2014b). As the rainfall intensity increased (60, 84 and 108 mm h‒1), the kinetic energy of raindrops gradually increased (60 < 84 < 108 mm h‒1), and the degree of aggregates fragmentation enhanced, being broken up into smaller particle sizes (Fu et al., 2016). When the rainfall intensity was up to 132 and 156 mm h‒1, raindrops kinetic energy decreased, part of which was consumed to break up the aggregates, so there was no enough energy to transport large particles, and numerous clay (<2 µm) and silt (2-50 µm) were transported. High rainfall intensities (132, 156 mm h‒1) had lower transportability for particles >50 µm than the rainfall intensity of 60, 84 and 108 mm h‒1. A critical effective particle size for enrichment and depletion was found at 50 µm. The enrichment ratio of effective clay (<2 µm) decreased with increasing slope, which was consistent with the results of Ekwue et al. (2009), who indicated that the clay had greater cohesiveness and lower splash on a higher slope.
The critical effective particle sizes in splash for black soil, lou soil and dark loessial soil were 1 mm (Zhou et al., 2008), 50 µm (Liu et al., 2016a) and 250 µm (Fu et al., 2019), respectively. Comprehensive analysis showed that there was a correlation between the critical effective particle size and the content of soil aggregates (>250 µm). The order of percentages of >250 µm aggregates was black soil (71.55%) > dark loessial soil (61.6%) > lou soil (32.19%) > loessial soil (4.68%, this study) (Table 5); Likewise, the order of critical effective sizes of enrichment/depletion was black soil (1 mm) > dark loessial soil (250 µm) > lou soil (50 µm) > loessial soil (50 µm, this study). In the process of raindrop splash, the critical effective size of enrichment/depletion increased with the increasing percentage of >250 µm aggregates of soil. Wang et al. (2018) indicated that soil aggregate stability parameters MWD (mean weight diameter) and GMD (geometric mean diameter) were significantly negatively correlated with the content of <250 µm particles and significantly positively correlated with contents of >250 µm particles, in contrast to D (fractal dimension). This indicated that the more the content of >250 µm particles, the larger the MWD, GMD and the smaller the D, the more stable the aggregates. Poorer stability made soil aggregates more sensitive to the mechanical fragmentation by raindrops. The heavier the fragmentation of aggregates, the more small size particles were released (Liu et al., 2020). Besides, strong adhesion between fine particles resulted in more kinetic energy consumption for detachment and less kinetic energy consumption for transport, which was insufficient to move large particles, resulting in a small critical effective particle size. Therefore, the critical effective particle size is ultimately related to the stability of soil aggregates.
Table 5 Distributions of aggregate fragments
Mass percentage (%)
Black soil Dark loessial soil Lou soil Loessial soil
>250 µm 71.55 61.6 32.19 4.68
50-250 µm 28.45 14.6 32.53 46.34
<50 µm 23.9 35.29 48.98

Notes: The data of dark loessial soil from Fu et al. (2020), lou soil from Liu et al. (2016b), and black soil from Zhou et al. (2008).

5 Conclusions

The effective size distributions of splashed particles of loessial soil on the Loess Plateau (collected in May 2019) were studied through indoor artificial rainfall simulation experiments. The following conclusions were obtained:
(1) The splash mass decreased exponentially with increasing distance, and increased gradually with increasing rainfall intensity. The splash in the downslope direction was greater than that in the upslope direction.
(2) Rainfall intensity was the major factor in splash erosion. The contributions of slope and rainfall intensity to splash were 7.38% and 82.72%, respectively in upslope direction, and were 1.66% and 93.24%, respectively in downslope direction.
(3) Both in the upslope and downslope direction, rainfall intensity had positive effects on the mass percentages of effective clay (<2 µm) and effective silt (2-50 µm), and negative effects on those of effective very fine sand (50-100 µm) and effective fine sand (100-250 µm).
(4) The mass percentages of effective clay (<2 µm) significantly decreased with increasing distance, while the mass percentages of effective very fine sand (50-100 µm) significantly increased with increasing distance, which was mainly due to the splash particles breaking being affected by secondary splash.
(5) Rainfall intensity had significant effects on enrichment ratios, positively for effective clay (<2 µm) and effective silt (2-50 µm) and negatively for effective very fine sand (50-100 µm) and effective fine sand (100-250 µm). The critical effective particle size of enrichment/depletion in splash for loessial soil was 50 µm. These results could facilitate further understanding of the characteristics of splash erosion and provide a theoretical foundation for erosion control practices in loess region in China.
[1]
Afshin G, Yoshiharu I, Takashi G et al., 2011. Downslope soil detachment-transport on steep slopes via rain splash. Hydrological Processes, 25(15): 2471-2480.

DOI

[2]
Angulo-Martinez M, Begueria S, Navas A et al., 2012. Splash erosion under natural rainfall on three soil types in NE Spain. Geomorphology, 175: 38-44.

[3]
Cheng J H, Qin Y, Zhang H J et al., 2015. Splash erosion under artificial rainfall in rocky mountain area of northern China. Transactions of the Chinese Society for Agricultural Machinery, 46(2): 153-161. (in Chinese)

[4]
Ekwue E I, Bharat C, Samaroo K, 2009. Effect of soil type, peat and farmyard manure addition, slope and their interactions on wash erosion by overland flow of some trinidadian soils. Biosystems Engineering, 102(2): 236-243.

DOI

[5]
Epstein E, Grant W J, 1967. Soil losses and crust formation as related to some soil physical properties. Soil Science Society of America Journal, 31(4): 19-88.

[6]
Fu S, Liu B, Liu H et al., 2011. The effect of slope on interrill erosion at short slopes. Catena, 84: 29-34.

DOI

[7]
Fu Y, Li G L, Wang D et al., 2019. Raindrop energy impact on the distribution characteristics of splash aggregates of cultivated dark loessial cores. Water, 11(7): 1514.

DOI

[8]
Fu Y, Li G L, Zheng T H et al., 2016. Impact of raindrop characteristics on the selective detachment and transport of aggregate fragments in the Loess Plateau of China. Soil Science Society of America Journal, 80(4): 1071-1077.

DOI

[9]
Fu Y, Li G L, Zheng T H et al., 2017. Splash detachment and transport of loess aggregate fragments by raindrop action. Catena, 150: 154-160.

DOI

[10]
Fu Y, Yang M X, Li G L et al., 2020. Selectivity of aggregate fractions for loess soils under different raindrop diameters. Journal of Soils and Sediments, 21: 189-202.

DOI

[11]
Ghadiri H, Payne D, 1977. Raindrop impact stress and the breakdown of soil crumbs. Journal of Soil Science, 28(2): 247-258.

DOI

[12]
Ghahramani A, Ishikawa Y, Gomi Tet al., 2011. Effect of ground cover on splash and sheetwash erosion over a steep forested hillslope: A plot-scale study. Catena, 85: 34-47.

DOI

[13]
Hall M J, 1970. Use of the stain method in determining the drop-size distributions of coarse liquid sprays. Transactions of the ASAE, 13: 33-37.

DOI

[14]
Holrott H N, 1983. Agricultural Production Effect Forecast. Tan J W, Liu T F, trans trans. Beijing: Agriculture Press, 122.

[15]
Hu W, Zheng F, Bian F, 2016. The directional components of splash erosion at different raindrop kinetic energy in the Chinese mollisol region. Soil Science Society of America Journal, 80(5): 1329-1340.

DOI

[16]
Iserloh T, Ries J B, Cerdà A et al., 2012. Comparative measurements with seven rainfall simulators on uniform bare fallow land. Zeitschrift für Rheumatologie, 57(1): 11-26.

DOI

[17]
Janeau J L, Valentin C, Planchon O et al., 2003. Soil crusting and infiltration on steep slopes in northern Thailand. European Journal of Soil Science, 54(3): 543-553.

DOI

[18]
Jiao J Y, Wang W Z, He X P, 1999. Precipitation and erosion characteristics of rainstorm in different pattern on loess plateau. Journal of Arid Environments, (1): 35-43. (in Chinese)

[19]
Kiani-Harchegani M, Sadeghi S H, Singh V P et al., 2019. Effect of rainfall intensity and slope on sediment particle size distribution during erosion using partial eta squared. Catena, 176: 65-72.

DOI

[20]
Kinnell P I A, 2005. Raindrop-impact-induced erosion processes and prediction: A review. Hydrological Processes, 19: 2815-2844.

DOI

[21]
Le Bissonnais Y, 1996. Aggregate stability and assessment of soil crustability and erodibility: I. Theory and methodology. European Journal of Soil Science, 67(1): 11-21.

DOI

[22]
Legout C, Leguedois S, Le Bissonnais Y, et al., 2005. Splash distance and size distributions for various soils. Geoderma, 124(3): 279-292.

DOI

[23]
Leguédois S, Planchon O, Legout C et al., 2005. Splash projection distance for aggregated soils. Soil Science Society of America Journal, 69(1): 30-37.

DOI

[24]
Li G D, Zhang J H, Zhu L Q et al., 2021. Spatial variation and driving mechanism of soil organic carbon components in the alluvial/sedimentary zone of the Yellow River. Journal of Geographical Sciences, 31(4): 535-550.

DOI

[25]
Liu B L, Cai Q G, Shi Z H et al., 2016a. Rain-simulated experiment study on the splash erosion characteristics of lou soil. Journal of Soil and Water Conservation, 30(5): 29-33. (in Chinese)

[26]
Liu B L, Cai Q G, Shi Z H et al., 2016b. Effects of loess soil texture on raindrop splash. Research of Soil and Water Conservation, 23(5): 1-6. (in Chinese)

[27]
Liu D D, She D L, Yu S E et al., 2015. Rainfall intensity and slope gradient effects on sediment losses and splash from a saline-sodic soil under coastal reclamation. Catena, 128: 54-62.

DOI

[28]
Liu J F, Hu F N, Yang Z H et al., 2020. Effects of soil surface electric field on the breakdown and splash erosion of soil aggregate. Transactions of the CSAE, 36(7): 149-156.

[29]
Ma B, Yu X, Ma F et al., 2014a. Effects of crop canopies on rain splash detachment. PLos One, 9(7): e99717.

DOI

[30]
Ma R M, Li Z X, Cai C F et al., 2014b. The dynamic response of splash erosion to aggregate mechanical breakdown through rainfall simulation events in ultisols (subtropical China). Catena, 121: 279-287.

DOI

[31]
Ma T, Zhou C H, Zhu T X et al., 2008. Modelling raindrop impact and splash erosion processes within a spatial cell: A stochastic approach. Earth Surface Processes and Landforms, 33(5): 712-723.

DOI

[32]
Mahmoodabadi M, Sajjadi S A, 2016. Effects of rain intensity, slope gradient and particle size distribution on the relative contributions of splash and wash loads to rain-induced erosion. Geomorphology, 253: 159-167.

DOI

[33]
Mermut A R, Luk S H, RiSmkens M J M et al., 1997. Soil loss by splash and wash during rainfall from two loess soils. Geoderma, 75: 203-214.

DOI

[34]
Morgan R, 1978. Field studies of rainsplash erosion. Earth Surface Processes and Landforms, 3(3): 295-299.

[35]
Plante A F, Feng Y, McGill W B, 2002. A modeling approach to quantifying soil macroaggregate dynamics. Canadian Journal of Soil Science, 82: 181-190.

DOI

[36]
Ploey J D, Savat J, 1968. Contribution à l'étude de l'érosion par le splash. Zeitschrift für Rheumatologie, 12: 174-193.

[37]
Qin Y, Cheng J H, Zhang H J et al., 2014. A study of the raindrop impact to splash erosion. Journal of Soil and Water Conservation, 28(2): 74-78. (in Chinese)

[38]
Qu L L, Li Y R, Wang Y S et al., 2022. Dynamic evolution and the mechanism of modern gully agriculture regional function in the Loess Plateau. Journal of Geographical Sciences, 32(11): 2229-2250.

DOI

[39]
Quansah C, 1981. The effect of soil type, slope, rain intensity and their interactions on splash detachment and transport. European Journal of Soil Science, 32(2): 215-224.

[40]
Sadeghi S H, Kiani Harchegani M, Asadi H, 2017. Variability of particle size distributions of upward/downward splashed materials in different rainfall intensities and slopes. Geoderma, 290: 100-106.

DOI

[41]
Saedi T, Shorafa M, Gorji M et al., 2016. Indirect and direct effects of soil properties on soil splash erosion rate in calcareous soils of the central Zagross, Iran: A laboratory study. Geoderma, 271: 1-9.

DOI

[42]
Sajjadi A S, Mahmoodabadi M, 2015. Aggregate breakdown and surface seal development influenced by rain intensity, slope gradient and soil particle size. Solid Earth, 6: 311-321.

DOI

[43]
Savat J, Poesen J, 1981. Detachment and transportation of loose sediments by raindrop splash (Part I): The calculation of absolute data on detachability and transportability. Catena, 8: 1-17.

DOI

[44]
Shen N, Wang Z L, Guo Q et al., 2021. Soil detachment capacity by rill flow for five typical loess soils on the Loess Plateau of China. Soil and Tillage Research, 213(4): 105159.

DOI

[45]
Shi W J, Zhang M, 2023. Progress on spatial prediction methods for soil particle-size fractions. Journal of Geographical Sciences, 33(7): 1553-1566.

DOI

[46]
Shi Z L, Wen A B, Walling D E et al., 2017. Exploring particle size selectivity effects during erosion of purple soils in Chongqing municipality, China. Journal of Soils and Sediments, 17(4): 1191-1196.

DOI

[47]
Stocking M A, Elwell H A, 1976. Rainfall erosivity over Rhodesia. Transactions of the Institute of British Geographers, 1(2): 231-245.

DOI

[48]
Sun S, Zhang Y, Lei P, 2021. Mass exchange of water and soil on the soil surface in the rainfall splash erosion. Frontiers in Earth Science, 9: 739804.

DOI

[49]
Terry J P, 1998. A rainsplash component analysis to define mechanisms of soil detachment and transportation. Australian Journal of Soil Research, 36(3): 525-542.

[50]
Torri D, Sfalanga M, Sette M D, 1987. Splash detachment: Runoff depth and soil cohesion. Catena, 14: 149-155.

DOI

[51]
Van Dijk. A, Meesters A, Bruijnzeel L A, 2002. Exponential distribution theory and the interpretation of splash detachment and transport experiments. Soil Science Society of America Journal, 66(5): 1466-1474.

DOI

[52]
Wang C X, Liang W, Yan J W et al., 2022. Effects of vegetation restoration on local microclimate on the Loess Plateau. Journal of Geographical Sciences, 32(2): 291-316.

DOI

[53]
Wang L, Shi Z H, 2015. Size selectivity of eroded sediment associated with soil texture on steep slopes. Soil Science Society of America Journal, 79(3): 917-929.

DOI

[54]
Wang L, Shi Z H, Wang J et al., 2014. Rainfall kinetic energy controlling erosion processes and sediment sorting on steep hillslopes: A case study of clay loam soil from the Loess Plateau, China. Journal of Hydrology, 512: 168-176.

DOI

[55]
Wang Z Q, Liu Y, Yang W T et al., 2018. Effects of rotation and fallow in paddy field on distribution and stability of soil aggregates. Acta Petrologica Sinica, 55(5): 1143-1155. (in Chinese)

[56]
Wischmeier W H, 1971. A soil erodibility nomograph for farmland and construction sites. Journal of Soil and Water Conservation, 26: 189-193.

[57]
Wu B, Wang Z L, Zhang Q W et al., 2019. Evaluating and modelling splash detachment capacity based on laboratory experiments. Catena, 176: 189-196.

DOI

[58]
Yao J J, Cheng J H, Zhou Z D et al., 2018. Effects of herbaceous vegetation coverage and rainfall intensity on splash characteristics in northern China. Catena, 167: 411-421.

DOI

[59]
Zhang G H, Liu B Y, Nearing M A et al., 2002. Soil detachment by shallow flow. Transactions of the ASABE, 45(2): 351-357.

[60]
Zhang Q W, Wang Z L, Guo Q et al., 2020. Size-selective characteristics of splash-detached sediments and their responses to related parameters on steep slopes in Chinese loessial region. Soil and Tillage Research, 198: 104539.

DOI

[61]
Zhang X L, Xu S, Cui L F et al., 2022. Erosions on the southern Tibetan Plateau: Evidence from in-situ cosmogenic nuclides 10Be and 26Al in fluvial sediments. Journal of Geographical Sciences, 32(2): 333-357.

DOI

[62]
Zhao X G, Wu F Q, 2001. Single raindrop splash law and its selection role on soil particles splashed. Journal of Soil and Water Conservation, (1): 43-45, 49. (in Chinese)

[63]
Zhou Y Y, Wang E H, Chen X W, 2008. Splash erosion and selective characteristics of aggregate for typical black soil under artificial rainfall condition. Journal of Soil and Water Conservation, 22(6): 176-179. (in Chinese)

[64]
Zumr D, Mutzenberg D V, Neumann M et al., 2020. Experimental setup for splash erosion monitoring-study of silty loam splash characteristics. Sustainability, 12(1): 157.

DOI

Outlines

/