Research Articles

The optimal explanatory power of soil erosion and water yield in karst mountainous areas

  • GAO Jiangbo , 1 ,
  • ZHANG Yibo 1, 2 ,
  • ZUO Liyuan 1, 2
Expand
  • 1. Key Laboratory of Land Surface Pattern and Simulation, Institute of Geographic Sciences and Natural Resources Research, CAS, Beijing 100101, China
  • 2. University of Chinese Academy of Sciences, Beijing 100049, China

Gao Jiangbo (1984-), PhD and Professor, specialized in integrated researches of physical geography, mountain ecosystem services, climate change impact and adaptation research. E-mail:

Received date: 2023-06-08

  Accepted date: 2023-07-10

  Online published: 2023-10-08

Supported by

National Natural Science Foundation of China(42071288)

National Natural Science Foundation of China(41671098)

The Programme of Kezhen-Bingwei Excellent Young Scientists of the Institute of Geographic Sciences and Natural Resources Research, Chinese Academy of Sciences(2020RC002)

Abstract

Accurately identifying the dominant factor of karst ecosystem services (ESs) is a prerequisite for the rocky desertification control. However, the explanatory power of environmental factors on the spatial distribution of ESs is affected by scaling, and the quantitative research on the scale effect still needs to be further strengthened. This study used the geographical detector to access the explanatory power of environmental factors on soil erosion and water yield at different spatial resolutions, and then explored its differences in three geomorphological-type areas. Results showed that slope and vegetation coverage were the dominant factors of soil erosion, and the interactive explanatory power between the two factors was stronger. Affected by the universality of topographic relief and landscape fragmentation in the study area, the explanatory power of slope and land use type on soil erosion was optimal at low resolution. Precipitation, elevation, and land use type were the dominant factors for the spatial heterogeneity of water yield, and the interaction between precipitation and land use type explained more than 95% of water yield. The spatial variability of elevation in different geomorphological-type areas affected its optimal explanatory power, specifically, in the terrace and hill-type areas, the spatial variability of elevation was weak, its explanatory power was optimal at high resolution. While in the mountain-type areas, the spatial variability of elevation was strong, and its explanatory power was optimal at low resolution. This study quantitatively identified the optimal explanatory power of ES variables through multi-scale analysis, which aims to provide a way and basis for accurate identification of the dominant factors of karst mountain ESs and zoning optimization.

Cite this article

GAO Jiangbo , ZHANG Yibo , ZUO Liyuan . The optimal explanatory power of soil erosion and water yield in karst mountainous areas[J]. Journal of Geographical Sciences, 2023 , 33(10) : 2077 -2093 . DOI: 10.1007/s11442-023-2166-y

1 Introduction

The unique geological background, typical binary hydrological structure, and unreasonable human activities have led to severe rocky desertification in karst areas (Li et al., 2021a). The ecosystem degradation caused by rocky desertification not only reduces the supply of regional ESs, but also limits the effective functioning of ecological barriers in karst mountainous areas, seriously constraining the sustainable development of regional society and economy, and threatening the stability of regional ecological security patterns (Xu, 2017). In this context, how to optimize and enhance ESs has become a key issue in the field of karst research in China (Wang et al., 2019). Accurately analyzing the environmental impact factors of ESs in karst areas can provide a theoretical reference for the scientific management of rocky desertification and is an effective way to optimize and enhance ESs (Zuo and Gao, 2020). Previous studies have shown that the identification results of environmental impact factors are influenced by scale transformations (Zhu et al., 2021). Therefore, determining the applicable scale and optimal explanatory power of environmental variables related to karst ESs have become a key scientific issue in the identification process of environmental impact factors.
At present, research on the identification of influencing factors of ESs in karst areas mostly adopts correlation or regression statistical methods. For example, Li et al. (2018) used the method of quadratic polynomial regression to reveal the relationship between precipitation factors and soil erosion in typical karst small watersheds in Guizhou. Zhao et al. (2018) identified the dominant terrain factors that affected soil erosion by comparing the correlation coefficients of linear regression equations between different terrain factors and soil erosion. The above research lacks consideration of the spatial attributes of ESs and environmental factors, and there is insufficient quantitative research on multiple factors and their interactions (Wang et al., 2018). Meanwhile, Martinez et al. (2017) showed that the identification of influencing factors for ESs had spatial scale effects. There are differences in the relationship between environmental factors and ESs under different amplitude and granularity (Steur et al., 2020). However, currently, research on the identification of influencing factors on karst ESs mostly adopts a single spatial granularity as the scale. Deng et al. (2020) researched the relationship between precipitation, temperature, NDVI, and soil moisture when the basic data was unified at a resolution of 0.125° in karst areas of China; Wei et al. (2020) used a uniform grid (1 km×1 km) to study the relationship between different land use patterns, terrain characteristics, and soil erosion. Compared with such work, conducting precise attribution of karst ESs from a multi-scale perspective can effectively avoid the scale problem of masking macroscopic controlling factor information when using high-precision data, and the loss of local limiting factor information when using low-resolution data at a single scale.
In addition to being influenced by spatial granularity, the relationship between environmental factors and ESs also varies with spatial amplitude (Gao et al., 2021). For example, Wu et al. (2013) pointed out that the dominant environmental factors affecting grassland productivity were temperature and precipitation at the national scale, while temperature dominated in karst areas. Li et al. (2020) pointed out that the dominant environmental factors affecting soil erosion at the entire watershed scale were temperature and NDVI, while at the Hongshui sub-watershed scale, they were runoff and precipitation. At present, research on the attribution of ESs is mostly focused on the regional scale, with less attention paid to the inherent heterogeneity within the region (Wang et al., 2021a). The karst areas in southwestern China include various types of landforms such as karst valleys, peak cluster depressions, fault basins, karst plateaus, and mid to high mountains, with significant landscape heterogeneity within the region. The regional differentiation of landforms directly affects surface water and light intensity, thereby controlling the driving factors of ESs to a certain extent (Jiang et al., 2021). The highly discontinuous and fragmented landscape characteristics make significant differences in the spatial distribution of ESs and environmental impact factors among different geomorphological-type areas in the region. Therefore, analyzing the difference in influencing factors of ESs in karst areas from the regional scale of different geomorphological-type areas can provide scientific reference for targeted control of rocky desertification.
Rock desertification refers to the phenomenon of surface soil loss, exposed bedrock, loss of agricultural use value, and ecological environment degradation caused by soil erosion after the destruction of surface vegetation (Dai and Yan, 2018). Therefore, soil conservation and runoff services are the keys to curbing the development of rock desertification in karst areas (Gao et al., 2019). Although there have been studies revealing the relationship between factors such as precipitation, terrain, and land use type with soil erosion and water yield (Wang et al., 2021b), there is relatively little research on the comprehensive analysis of multiple factors and the interaction between two factors, and there is even less research on the impact of scale effects on attribution results. The geographical detector has the characteristic of quantitatively displaying the explanatory power of influencing factors on research objects (Zhu et al., 2020). By comparing the explanatory power of different environmental factors, a comprehensive analysis of multiple factors can be achieved. At the same time, the geographical detector can also obtain the interaction relationship between two factors by comparing the differences in the magnitude of single-factor and double-factor interactions. Based on this, this paper took a multi-scale perspective and selects various environmental factors such as slope, elevation, precipitation, lithology, vegetation coverage, and land use types. The geographical detector was used to quantitatively analyze the explanatory power of different environmental factors on the spatial distribution of soil erosion and water yield, as well as their multi-scale variation, to identify the optimal explanatory power of environmental factors. Furthermore, the dominant influencing factors and their interactions of soil erosion and water yield were identified within different geomorphological-type areas.

2 Data and methods

2.1 Study area

The Wujiang River originates from Xianglu Mountain in Weining County, located on the eastern foot of Wumeng Mountain in western Guizhou province. After flowing through eight prefecture-level cities (autonomous prefectures) such as Tongren and Zunyi in Guizhou, it flows out of the northeast and joins the Yangtze River (Figure 1). The total area of the Wujiang River Basin in Guizhou (26°12′-28°42′N, 104°48′-108°48′E) is 4.98×10⁴ km2, with the main geomorphological type of the watershed being mountainous and hilly areas. The terrain is highly undulating and fragmented. The climate is subtropical monsoon climate, with an average annual precipitation of about 1200 mm. The bedrock of the basin is mainly carbonate rock. The soil-forming rate of carbonate rock is low. The shallow soil layer formed by weathering is prone to rocky desertification of exposed bedrock under the action of hydraulic erosion. The densely population and the scarcity of arable land (Jia et al., 2019) have made the problem of rocky desertification more prominent due to human irrational behaviors such as deforestation and slope land cultivation.
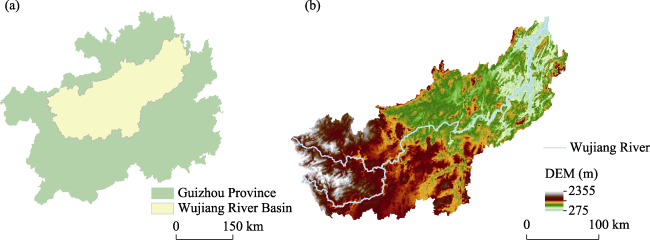
Figure 1 The location (a) and elevation (b) of the Wujiang River Basin

2.2 Framework

This paper identified the optimal explanatory power of different environmental factors on the spatial distribution of soil erosion and water yield from the perspective of multi-scale effects. The research framework is as follows. First, the research data include meteorological data, soil data, land use data, lithology data, geomorphological-type data, digital elevation model (DEM), and normalized vegetation index (NDVI) (data sources are shown in Table 1), among which meteorological data, land use data, and NDVI were collected in 2015, resampling the above research data into six spatial resolutions of 30 m, 100 m, 300 m, 500 m, 1 km, and 2 km using ArcGIS10.2. Based on RUSLE and InVEST models to optimize and simulate soil erosion modulus and water yield at different resolutions; Then, according to the characteristics of terrain undulation, 11 types of landforms, including low altitude plains, low altitude hills, medium altitude platforms, and small undulating mountains (Zhou et al., 2009), were merged into three geomorphological-type areas, namely terraces, hills, and mountains. The application of the geographical detector in different geomorphological-type areas to identify the explanatory power of single factors and interactions between factors on soil erosion and water yield at different resolutions; Third, based on the trend of the explanatory power of environmental factors changing with resolution and the optimal resolution (corresponding to the maximum explanatory power), it was determined that environmental factors were macroscopic, local, or stable factors. If the explanatory power increases with the decrease of resolution, and the optimal resolution is greater than or equal to 1 km, it is the macroscopic factor; If the explanatory power decreases as the resolution decreases, and the optimal resolution is less than or equal to 300 m, it is a local factor; If the explanatory power does not significantly change with the decrease of resolution, it is the stable factor. We used the explanatory power corresponding to the optimal resolution as the optimal explanatory power of environmental factors on soil erosion and water yield, compared the optimal explanatory power of environmental factors in different geomorphological-type areas, and identifed the dominant factors affecting the spatial distribution of soil erosion and water yield.
Table 1 Data sources
Data type Data source
Meteorology The National Meteorological Information Center (http://data.cma.cn)
Soil The Harmonized World Soil Database (HWSD), China's Second Soil Survey Database
Land use, lithology, geomorphology The Data Center for Resources and Environmental Sciences (http://www.resdc.cn)
DEM Google Earth
NDVI The United States Geological Survey (https://glovis.usgs.gov)

2.3 Methods

2.3.1 RUSLE Model

The RUSLE model is currently one of the most widely used models in soil erosion research. Based on lithology, this paper divided the research area into two categories: non-karst and karst areas. Areas with non-carbonate rock distribution were classified as non-karst areas and used traditional RUSLE models to simulate soil erosion (Benavidez et al., 2018). The areas with carbonate rocks distribution were classified as karst areas and used the RUSLE model modified by Gao and Wang (2019) to simulate soil erosion. The basic form of the equation is:
$A=\left( 1-{{0.076}^{2}}\times a \right)\times R\times K\times LS\times C\times P$
where A is the average annual soil erosion modulus (t ha-1 a-1); α is the coefficient of rocky desertification, obtained based on the exposure rate of bedrock with different degrees of rocky desertification (Table 2); R is the rainfall erosivity factor (MJ mm ha-1 h-1 a-1), using the rainfall erosivity estimation method based on daily rainfall data proposed by Zhang and Fu (2003), and making corrections for karst areas. In karst areas, ≥ 30 mm was used as the standard for erosive rainfall, while in non-karst areas, ≥ 12 mm was used as the standard (Qian et al., 2018); K is the soil erodibility factor (t hm h MJ-1 mm-1 ha-1), calculated using the Erosion Productivity Impact Calculator (EPIC) proposed by Williams et al. (1989); LS is the terrain factor, which was calculated using the LS calculation method proposed by McCool et al. (1989) and modified by Zhang et al. (2013); C is the vegetation coverage and management factor, obtained using the research algorithm of Cai et al. (2000); P is the factor of soil and water conservation measures, assigned based on the assignment criteria of Gao and Wang (2019) for karst areas. LS, C, and P are dimensionless.
Table 2 Correctional coefficient for different degrees of rocky desertification
Rocky desertification None Potential Light Moderate High Severe
Bedrock bareness rate (%) <20 20-30 31-50 51-70 71-90 >90
α 10 25 40 60 80 95

2.3.2 InVEST Model

The InVEST model (Sharp et al., 2018) was selected to simulate the water yield of the watershed. The water yield module of the model is based on the assumption of Budyko water heat coupling equilibrium, and the formula is as follows:
$Y(x)=\left( 1-\frac{AET(x)}{P(x)} \right)\times P(x)$
where Y(x) is the annual water yield of each grid unit in the study area; AET(x) is the annual actual evapotranspiration of each grid cell; P(x) is the annual precipitation of each grid unit, in millimeters. Wherein, the calculation of the ratio of actual evapotranspiration to precipitation AET(x)/P(x) is also based on the Budyko water heat coupling balance assumption formula.
$\frac{AET(x)}{P(x)}=1+\frac{PET(x)}{P(x)}-{{\left[ 1+{{\left( \frac{PET(x)}{P(x)} \right)}^{\omega }} \right]}^{1/\omega }}$
where PET(x) is the potential evapotranspiration of the study area, which can be calculated according to the plant evapotranspiration coefficient and the reference crop evapotranspiration. The formula is as follows:
$PET(x)={{K}_{c}}({{l}_{x}})\times E{{T}_{0}}(x)$
where Kc(lx) is the plant evapotranspiration coefficient, which reflects the impact of different vegetation types on water yield. ET0(x) is the reference crop evapotranspiration, which can be calculated by the Penman formula:
$\omega (x)=Z\times \frac{AWC(x)}{P(x)}+1.25$
where ω(x) is the non-physical parameter that characterizes the soil properties of natural climate. AWC(x) is the effective soil moisture content, and Z is an empirical constant, representing the influence of seasonal factors.

2.3.3 Geographical detector

The geographical detector is a statistical method to detect, utilize spatial heterogeneity, and reveal its driving factors (Wang and Xu, 2017), which mainly includes four detection parts: factor, ecology, risk, and interaction. The geographical detectors provide q values that characterize the degree of influence of influencing factors on soil erosion and water yield by detecting the spatial heterogeneity of each factor. The calculation formula for the factor detector is as follows:
$q=1-\frac{\sum\limits_{h=1}^{L}{{{N}_{h}}\sigma _{h}^{2}}}{N{{\sigma }^{2}}}$
where q represents the explanatory power of the independent variable on the dependent variable, with a range of [0,1]. The larger the q value, the greater the explanatory power of the independent variable on the dependent variable, indicating that the explanatory power of various environmental impact factors on soil erosion and water yield spatial distribution is greater; L is the number of categories for the independent variable X, N is the total number of grid units in the study area, and Nh is the total number of grid units of type h for the independent variable X, σ2 is the total variance of all samples in the study area, σ2h is the total variance of type h of the independent variable X.
The interaction detector is used to identify the interactions of different influencing factors and obtain their interaction relationships by comparing the differences in the magnitude of single-factor and double-factor interactions (Table 3).
Table 3 Types of interaction between two factors (Wang and Xu, 2017)
Description Interaction
q (X1 ∩ X2) < Min (q (X1), q (X2)) Weakened, nonlinear
Min (q (X1), q (X2)) < q (X1 ∩ X2) < Max (q (X1), q (X2)) Weakened, single factor nonlinear
q (X1 ∩ X2) > Max (q (X1), q (X2)) Enhanced, double factors
q (X1 ∩ X2) = q (X1) + q (X2) Independent
q (X1 ∩ X2) > q (X1) + q (X2) Enhanced, nonlinear

3 Results

3.1 Simulation of soil erosion and water yield at different resolutions

The simulation results of the RUSLE model showed that the average range of soil erosion modulus in the Wujiang River Basin in 2015 was 17.64-17.95 t ha-1 a-1 under different resolutions, with micro erosion and mild erosion being the main types. The result is relatively close to the soil erosion modulus (18.84 t ha-1 a-1) simulated by Zeng et al. (2017) in Yinjiang County, Guizhou. As the resolution decreased, the average soil erosion modulus in the Wujiang River Basin decreased slightly. The average erosion modulus at each resolution was around 18 t ha-1 a-1. Meanwhile, as the resolution decreased, the maximum value of soil erosion modulus in the watershed significantly decreased. The maximum value of soil erosion modulus at 30 m resolution was 1419.61 t ha-1 a-1, and the maximum value at 2 km resolution decreased to 357.20 t ha-1 a-1. The minimum values were all 0 values and did not change with resolution.
The simulation results of the InVEST model showed that the average water yield under different resolutions ranged from 967.59 to 968.18 mm, and its spatial distribution showed a pattern of low in the north and high in the south (Figure 2). This result agrees with previous research on water yield in karst areas (Lang et al., 2018; Peng et al., 2020). As the resolution decreased, the mean and maximum values of water yield slightly decreased, and the mean and maximum values of each resolution remained around 968 mm and 1442 mm, respectively. The minimum value of water yield significantly increased with a decrease in resolution, with a minimum value of 403.38 mm for 30 m resolution and 487.17 mm for 2 km resolution. The mean value of soil erosion modulus and water yield decreased with decreasing resolution. This is consistent with the results of Martinez et al. (2017), who applied field experimental data from both large (3.05 m×9.1 m) and small (0.61 m×1.22 m) plots to analyze the impact of scale differences on pasture water yield and soil erosion.
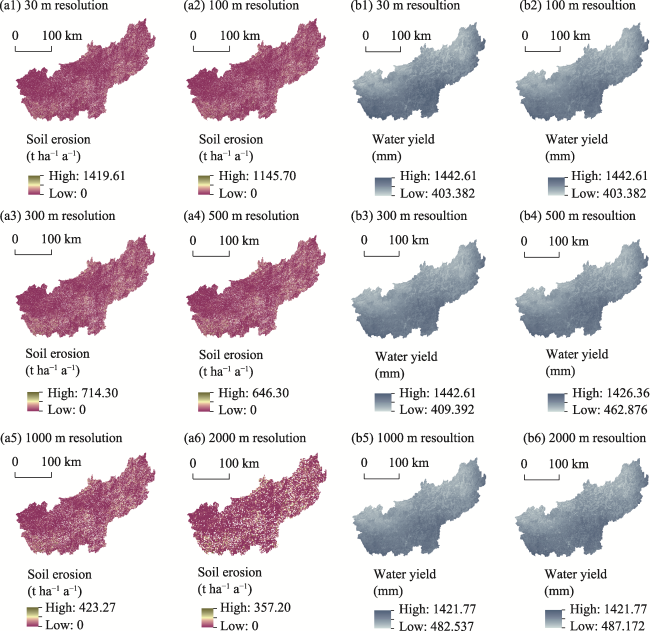
Figure 2 Spatial distribution of soil erosion (a) and water yield (b) at different resolutions in Wujiang River Basin

3.2 Multi-scale quantitative attribution of soil erosion and water yield

The transformation of spatial scale significantly affected the explanatory power of environmental factors on the spatial distribution of soil erosion (Figure 3). The explanatory power of the slope in the terrace-type area was 18% at 1 km resolution, while it rose to 27% at 2 km. As the resolution decreased, the trend of the explanatory power of different environmental factors varied. The explanatory power of slope and land use type increased with the decrease of resolution, reaching the optimal level at 1 km or 2 km resolution, which were a macroscopic factor. The explanatory power of other environmental factors varied with resolution in different geomorphological-type areas. The explanatory power of vegetation coverage in terrace and hill-type areas increased with the decrease of resolution, while in mountain-type areas, the explanatory power decreased with the decrease of resolution. This may be related to the differences in vegetation distribution within different geomorphological-type areas. Table 4 showed the relative order of the optimal explanatory power of environmental factors. Slope, vegetation coverage, and land use type were the dominant impact factors of soil erosion, while other factors had limited explanatory power (<3%). There were differences in the dominant influencing factors of soil erosion within different geomorphological-type areas. The slope had the strongest explanatory power on soil erosion in terrace and hill-type areas with relatively small terrain undulations. In mountain-type areas with high terrain fluctuations, vegetation coverage became the dominant factor controlling the spatial pattern of soil erosion.
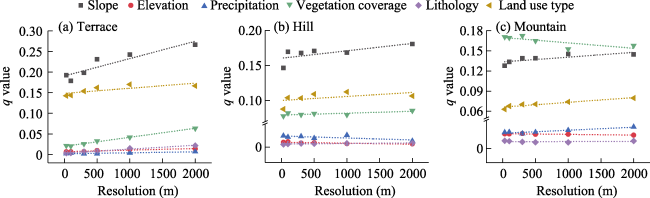
Figure 3 Variation of explanatory power of environmental factors on soil erosion with resolutions in different geomorphological areas
Table 4 The rank of optimal explanatory power of environmental factors on soil erosion in different geomorphological areas
Geomorphological-
type areas
Rank Environmental factor Factor type Optimal
resolution (m)
Optimal explanatory power (q value)
Terrace 1 Slope Macroscopic 2000 0.27
2 Land use type Macroscopic 1000 0.17
3 Vegetation coverage Macroscopic 2000 0.06
4 Lithology Macroscopic 2000 0.02
5 Elevation Macroscopic 2000 0.01
6 Precipitation Macroscopic 2000 0.01
Hill 1 Slope Macroscopic 2000 0.18
2 Land use type Macroscopic 1000 0.11
3 Vegetation coverage Macroscopic 2000 0.09
4 Precipitation Local 1000 0.02
5 Elevation Local 100 0.01
6 Lithology Macroscopic 2000 0.01
Mountain 1 Vegetation coverage Local 300 0.17
2 Slope Macroscopic 1000 0.15
3 Land use type Macroscopic 2000 0.08
4 Precipitation Macroscopic 2000 0.02
5 Elevation Local 300 0.01
6 Lithology Stable 30 0.01
The explanatory power of elevation on water yield varied significantly at different resolutions in terrace-type areas, with an explanatory power of 45% at 300 m resolution and decreased to 34% at 2 km resolution. Although the explanatory power of other environmental factors had a relatively small response to the resolution, they also exhibited a certain pattern (Figure 4): precipitation and elevation showed a decrease in explanatory power with a decrease in resolution in terrace and hill-type areas, while an increase in explanatory power with a decrease in resolution in mountain-type areas. From Table 5, it can be seen that precipitation, elevation, and land use type were the dominant impact factors affecting the spatial distribution of water yield in the study area, while the explanatory power of lithology, vegetation coverage, and the slope was relatively low (<10%). Precipitation was the dominant influencing factor for water yield in all geomorphological-type areas, with an explanatory power of over 75%, significantly higher than other environmental factors. The second factor that affected the spatial distribution of water yield varied among different geomorphological-type areas. In terrace-type areas, it was the elevation, while in mountain and hill-type areas, it was the land use type.
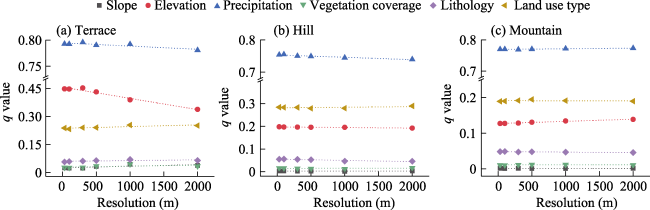
Figure 4 Variation of explanatory power of environmental factors on water yield with resolutions in different geomorphological areas
Table 5 The rank of optimal explanatory power of environmental factors on water yield in different geomorphological areas
Geomorphological-
type areas
Rank Environmental factor Factor type Optimal
resolution (m)
Optimal explanatory power (q value)
Terrace 1 Precipitation Local 300 0.80
2 Elevation Local 300 0.45
3 Land use type Macroscopic 1000 0.25
4 Lithology Macroscopic 1000 0.07
5 Vegetation coverage Macroscopic 1000 0.05
6 Slope Macroscopic 1000 0.04
Hill 1 Precipitation Local 100 0.76
2 Land use type Macroscopic 2000 0.29
3 Elevation Local 30 0.20
4 Lithology Local 100 0.06
5 Vegetation coverage Stable 2000 0.02
6 Slope Stable 2000 0.00
Mountain 1 Precipitation Macroscopic 2000 0.77
2 Land use type Stable 500 0.19
3 Elevation Macroscopic 2000 0.14
4 Lithology Local 100 0.05
5 Vegetation coverage Stable 500 0.01
6 Slope Stable 2000 0.00

3.3 Response of soil erosion and water yield to the interaction of two factors at different scales

The results of the interaction detector showed that the superposition of environmental factors in pairs enhanced their explanatory power for soil erosion, manifested as double-factor enhancement or nonlinear enhancement. The explanatory power of vegetation coverage and slope on soil erosion in mountain-type areas were 0.17 and 0.08 for single-factor effects, respectively. The explanatory power increased to 0.32 for double-factor superposition effects. The transformation of spatial scale also had a significant impact on the interaction between the two factors. In the terrace-type area, the explanatory power of the interaction between slope and vegetation coverage on soil erosion was 31% at 300 m resolution and increased to 53% at 2 km resolution (Figure 5). As the resolution decreases, there were differences in the trend of changes in the explanatory power of different interactions. The explanatory power of the superposition of slope and other environmental factors increased with the decrease of resolution, reaching its optimal level at 2 km resolution, indicating a macroscopic interaction. The explanatory power of the interaction between other factors varied with resolution in different geomorphological-type areas. The explanatory power of the superposition of vegetation coverage and land use types increased with the decrease of resolution in terrace and hill-type areas, while the difference was small among different resolutions in mountain-type areas. From Table 6, it can be seen that the interaction between slope and vegetation cover age had the strongest explanatory power on the spatial distribution of soil erosion. The second interaction varied among different geomorphological-type areas. In terrace-type areas, it was the interaction between slope and land use type, while in mountain and hill-type areas, it was the interaction between vegetation coverage and land use type.
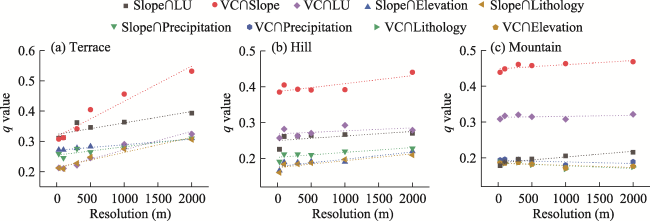
Figure 5 Variation of explanatory power of interactions between two factors on soil erosion with resolutions in different geomorphological areas (LU = Land use type, VC = vegetation coverage)
Table 6 The rank of optimal explanatory power of interactions between two factors on soil erosion in different geomorphological areas
Geomorphological-
type areas
Rank Interaction factor Factor type Optimal
resolution (m)
Optimal explanatory power (q value)
Terrace 1 Slope ∩ Vegetation coverage Macroscopic 2000 0.53
2 Slope ∩ Land use type Macroscopic 2000 0.39
3 Vegetation coverage ∩ Land use type Macroscopic 2000 0.32
4 Slope ∩ Elevation Macroscopic 2000 0.31
5 Slope ∩ Precipitation Macroscopic 2000 0.31
6 Slope ∩ Lithology Macroscopic 2000 0.31
Hill 1 Slope ∩ Vegetation coverage Macroscopic 2000 0.44
2 Vegetation coverage ∩ Land use type Macroscopic 1000 0.29
3 Slope ∩ Land use type Macroscopic 2000 0.27
4 Slope ∩ Precipitation Macroscopic 2000 0.23
5 Slope ∩ Elevation Macroscopic 2000 0.22
6 Slope ∩ Lithology Macroscopic 2000 0.21
Mountain 1 Vegetation coverage ∩ Slope Macroscopic 2000 0.47
2 Vegetation coverage ∩ Land use type Stable 2000 0.32
3 Slope ∩ Land use type Macroscopic 2000 0.22
4 Vegetation coverage ∩ Precipitation Local 100 0.20
5 Vegetation coverage ∩ Lithology Local 30 0.19
6 Vegetation coverage ∩ Elevation Local 300 0.19
Similar to the single-factor effect, the explanatory power of the interaction between environmental factors on water yield had a relatively small response to resolution but still exhibited a certain pattern (Figure 6). The explanatory power of the interaction between elevation and land use types decreased with a decrease in resolution in terrace-type areas and increased with a decrease in resolution in mountain and hill-type areas. The explanatory power of the interaction between precipitation and other environmental factors (excluding land use) decreased with a decrease in resolution in terrace and hill-type areas, increased with a decrease in resolution in mountain-type areas, and was optimal at a resolution of 2 km. The pairwise interaction between environmental factors enhanced their explanatory power on water yield. In the terrace-type area, the explanatory power of precipitation and land use type under single-factor action were 0.80 and 0.45, respectively, and increased to 0.98 during the interaction. From Table 7, it can be seen that the interaction between precipitation and land use types was the dominant interaction that affected the spatial distribution of water yield, with an explanatory power of over 95%, significantly higher than the interaction between other environmental factors. The interaction between 75% and 80% of explanatory power was the superposition of precipitation and other environmental factors.
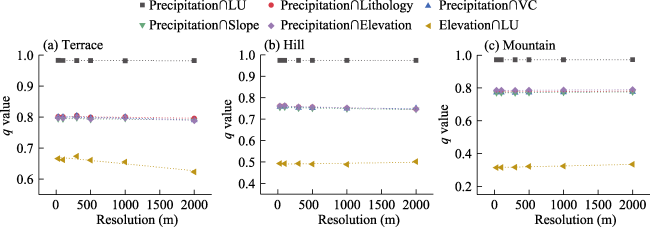
Figure 6 Variation of explanatory power of interactions between two factors on water yield with resolutions in different geomorphological areas (LU = Land use type, VC = vegetation coverage)
Table 7 The rank of optimal explanatory power of interactions between two factors on water yield in different geomorphological areas
Geomorphological- type areas Rank Interaction factor Factor type Optimal
resolution (m)
Optimal explanatory power (q value)
Terrace 1 Precipitation∩Land use type Local 30 0.98
2 Precipitation∩Lithology Local 300 0.80
3 Precipitation∩Vegetation coverage Local 300 0.80
4 Precipitation∩Elevation Local 300 0.80
5 Precipitation∩Slope Local 300 0.80
6 Elevation∩Land use type Local 300 0.67
Hill 1 Precipitation∩Land use type Macroscopic 1000 0.97
2 Precipitation∩Elevation Local 100 0.76
3 Precipitation∩Lithology Local 100 0.76
4 Precipitation∩Vegetation coverage Local 100 0.76
5 Precipitation∩Slope Local 100 0.76
6 Elevation∩Land use type Macroscopic 2000 0.50
Mountain 1 Precipitation∩Land use type Macroscopic 2000 0.97
2 Precipitation∩Elevation Macroscopic 2000 0.79
3 Precipitation∩Lithology Macroscopic 2000 0.78
4 Precipitation∩Vegetation coverage Macroscopic 2000 0.78
5 Precipitation∩Slope Macroscopic 2000 0.78
6 Elevation∩Land use type Macroscopic 2000 0.33

4 Discussion and conclusions

4.1 Discussion

Six environmental factors are important influencing factors for soil erosion and water yield, but there are differences in the degree of control of soil erosion and water yield among different environmental factors (Xu and Zhang, 2020). Accurately identifying the dominant influencing factors of ES variables in the research area can provide targeted references for scientific management of local rocky desertification. The results indicated that slope and vegetation coverage were the dominant impact factors of soil erosion, and the interaction between the two factors had the strongest explanatory power on soil erosion. This is consistent with the conclusion drawn by Wang et al. (2013) that high-intensity soil erosion in the Wujiang River Basin mostly occurred in slope and low vegetation coverage areas. The dominant impact factor of water yield was precipitation, which is consistent with the conclusion of Hu et al. (2012) that precipitation was the dominant factor affecting water yield in karst areas in southwestern China. The interaction between precipitation and land use types had an explanatory power of over 95% on the spatial distribution of water yield. There were significant differences in water yield under different land use types. The vegetation coverage in forest and grassland areas is high, which has a significant interception effect on precipitation. As a result, the water yield is low, surface runoff is effectively reduced, and soil erosion is weakened (Xiong et al., 2012). However, areas with bare rock texture and residential and mining land, under the influence of natural or human factors, form impermeable layers on the surface, resulting in higher water yield (Li et al., 2021b). A large amount of surface runoff flows from exposed areas to soil-covered areas, exacerbating soil erosion and forming a vicious cycle. Therefore, in the future prevention and control of rocky desertification, it is necessary to strengthen the ecological restoration and management of bare rock and mining wasteland, and increase their surface vegetation coverage. At the same time, promote the construction of “sponge cities” in urban areas to reduce the distribution of impermeable ground and effectively alleviate soil erosion.
The explanatory power of environmental factors on ES variables and their scale changes were influenced by the macroscopic control of landforms (Wang et al., 2021a). There were differences in the dominant influencing factors of ES variables among different geomorphological-type areas, specifically manifested as: the dominant influencing factor of soil erosion was slope in terrace and hill-type areas, and vegetation coverage in mountain-type areas. This is consistent with Wang et al.'s conclusion (2018) that the explanatory power of slope on soil erosion decreased with the increase of topographic relief. The spatial variability of environmental factors in different geomorphological-type areas affected their optimal explanatory power (Zhu et al., 2021). In terrace and hill-type areas, the terrain is relatively flat and the spatial variability of elevation is relatively small. Improving resolution can retain more subtle change information, so the explanatory power is optimal at high-precision resolution. In mountain-type areas, the terrain fluctuates violently and the spatial variability of elevation is significant. Reducing resolution can better reflect the overall characteristics of its changes, thus exhibiting stronger explanatory power at low precision resolutions (Li and Cai, 2005). Therefore, the impact mechanism and spatial heterogeneity of karst ESs in different geomorphological-type areas should be comprehensively considered in future work and research on rocky desertification control.
Scale effect refers to the changes in object expression and analysis results caused by scale (Liu et al., 2007). Geographic processes have obvious scale characteristics, and the relationship between environmental factors and ESs varies at different scales (Steur et al., 2020). If only a single high-precision resolution is used for attribution of ESs, it may mask the control effect of macroscopic factors; If only a single low-precision resolution is used, it will result in a large amount of detailed information on local factors being ignored, thereby reducing their explanatory power for ESs (Yang et al., 2021). Taking soil erosion in mountain-type areas as an example, vegetation coverage was a local factor in mountain-type areas, while the slope was a macroscopic factor. When the 30m resolution was used as the research scale, vegetation coverage was the dominant influencing factor of soil erosion; When 1 km resolution was used as the research scale, soil erosion was jointly dominated by slope and vegetation coverage (Figure 4). The differences in attribution results caused by different selection scales confirmed the existence of scale effects (Guo et al., 2021). In the prevention and control of rocky desertification, if the influence of scale effects is ignored, it is likely to lead to incorrect identification of core driving factors for soil erosion and water yield, resulting in a deviation in the focus of rocky desertification prevention and control. To avoid the possible impact of scale effects on the correctness of management decisions, it is recommended to explore the relationship between environmental factors and ESs from a multi-scale perspective in the future (Cui et al., 2019).
There are complex interactions between ESs, and the increase of one ES may lead to the increase or decrease of another ES (Gao et al., 2019). In order to maximize the comprehensive benefits of ESs, research on trade-off and synergy between ESs has become one of the current hotspots (Xu et al., 2017). Similarly, trade-off and synergy relationships are also influenced by scale effects (Xu et al., 2021), so the research framework of this paper can be applied in the future to explore multi-scale features of ES relationships and their influencing factors.

4.2 Conclusions

The quantitative and precise identification of dominant factors of ESs, especially for mountainous ecosystems with severe heterogeneity, requires comprehensive consideration of the variation patterns at different scales. Taking Wujiang River Basin, a typical karst basin with significant spatial heterogeneity, as the study area, based on the change rule of the explanatory power of environmental factors on soil erosion and water yield spatial distribution under different resolutions, the applicable scale and optimal explanatory power of different environmental factors were determined, and then the regional rule of dominant factors of ES variables was compared and analyzed. The main conclusions are as follows:
(1) Slope was a macroscopic factor when explaining the spatial distribution of soil erosion. Whether it was the single-factor effect of slope or the interaction between slope and other environmental factors, its explanatory power increased with the decrease of resolution, reaching its optimal state at low resolution (≥ 1 km). Comparing the optimal explanatory power of different environmental factors, the slope was the dominant factor affecting the spatial distribution of soil erosion in terrace and hill-type areas. In mountain-type areas, influenced by the universality of landscape fragmentation and terrain cutting, the dominant influencing factor was vegetation coverage. The interaction between factors enhanced the explanatory power of the corresponding single factor, and the interaction between slope and vegetation coverage had the strongest explanatory power on the spatial distribution of soil erosion.
(2) The spatial variability of precipitation in different geomorphological-type areas affected its optimal explanatory power level for the spatial distribution of water yield. The single-factor effect of precipitation and the interaction between precipitation and other environmental factors (excluding land use types) had the best explanatory power at high resolution (≤ 300 m) in terrace and hill-type areas, while in mountain-type areas, the explanatory power was stronger at low resolution (2 km). Precipitation was the dominant factor determining the spatial heterogeneity of water yield. The second dominant factor was the elevation in terrace-type areas, and land use in mountain and hill-type areas. The interaction between precipitation and land use types had an explanatory power of over 95% on the spatial distribution of water yield.
(3) This paper implemented the study of multiple factors and their interactions, as well as multiple regions and their integrations, within a multi-scale framework using geographic detector methods. It has made academic contributions to the quantitative identification of optimal explanatory power and the precise analysis of dominant factors. In addition, applying the research technology framework to typical karst basins can help promote the development of karst ES science.
[1]
Benavidez R, Jackson B, Maxwell D et al., 2018. A review of the (Revised) Universal Soil Loss Equation ((R)USLE): With a view to increasing its global applicability and improving soil loss estimates. Hydrology and Earth System Sciences, 22(11): 6059-6086.

DOI

[2]
Cai C F, Ding S W, Shi Z H et al., 2000. Study of applying USLE and geographical information system IDRISI to predict soil erosion in small watershed. Journal of Soil and Water Conservation, (2): 19-24. (in Chinese)

[3]
Cui F Q, Tang H P, Zhang Q et al., 2019. Integrating ecosystem services supply and demand into optimized management at different scales: A case study in Hulunbuir, China. Ecosystem Services, 39: 100984.

DOI

[4]
Dai Q H, Yan Y J, 2018. Research progress of karst rocky desertification and soil erosion in southwest China. Journal of Soil and Water Conservation, 32(2): 1-10. (in Chinese)

[5]
Deng Y H, Wang S J, Bai X Y et al., 2020. Spatiotemporal dynamics of soil moisture in the karst areas of China based on reanalysis and observations data. Journal of Hydrology, 585: 124744.

DOI

[6]
Gao J B, Wang H, 2019. Temporal analysis on quantitative attribution of karst soil erosion: A case study of a peak-cluster depression basin in Southwest China. Catena, 172: 369-377.

DOI

[7]
Gao J B, Zuo L Y, Liu W L, 2021. Environmental determinants impacting the spatial heterogeneity of karst ecosystem services in Southwest China. Land Degradation & Development, 32(4): 1718-1731.

DOI

[8]
Gao J B, Zuo L Y, Wang H, 2019. The spatial trade-offs and differentiation characteristics of ecosystem services in karst peak-cluster depression. Acta Ecologica Sinica, 39(21): 7829-7839. (in Chinese)

[9]
Guo L J, Liu R M, Men C et al., 2021. Multiscale spatiotemporal characteristics of landscape patterns, hotspots, and influencing factors for soil erosion. Science of the Total Environment, 779: 146474.

DOI

[10]
Hu Y, Dai Q H, Wang P, 2012. Runoff features and the influencing factors on karst sloping farmland. Journal of Soil and Water Conservation, 26(6): 46-51. (in Chinese)

[11]
Jia Y W, Hao C F, Niu C W et al., 2019. Spatio-temporal variations of precipitation and runoff and analyses of water-heat-human-land matching characteristics in typical mountainous areas of China. Acta Geographica Sinica, 74(11): 2288-2302. (in Chinese)

DOI

[12]
Jiang C, Yang Z Y, Li M T et al., 2021. Exploring soil erosion trajectories and their divergent responses to driving factors: A model-based contrasting study in highly eroded mountain areas. Environmental Science and Pollution Research, 28(12): 14720-14738.

DOI

[13]
Lang Y Q, Song W, Deng X Z, 2018. Projected land use changes impacts on water yields in the karst mountain areas of China. Physics and Chemistry of the Earth, 104: 66-75.

[14]
Li R, Zhang C, Gu Z K et al., 2018. Response of soil erosion to main influencing factors on hillslope of typical watersheds in Guizhou karst area. Research of Soil and Water Conservation, 25(3): 1-5. (in Chinese)

[15]
Li S C, Cai Y L, 2005. Some scaling issues of geography. Geographical Research, 24(1): 11-18. (in Chinese)

DOI

[16]
Li S L, Liu C Q, Chen J N et al., 2021a. Karst ecosystem and environment: Characteristics, evolution processes, and sustainable development. Agriculture, Ecosystems & Environment, 306: 107173.

DOI

[17]
Li X, Yu X, Wu K N et al., 2021b. Land-use zoning management to protecting the regional key ecosystem services: A case study in the city belt along the Chaobai River, China. Science of The Total Environment, 762: 143167.

DOI

[18]
Li Z W, Xu X L, Zhu J X et al., 2020. Scale-specific controls of sediment yield in karst watersheds. Journal of Hydrology, 583: 124301.

DOI

[19]
Liu X J, Lu H X, Ren Z et al., 2007. Scale issues in digital terrain analysis and terrain modeling. Geographical Research, (3): 433-442. (in Chinese)

DOI

[20]
Martinez G, Weltz M, Pierson F B et al., 2017. Scale effects on runoff and soil erosion in rangelands: Observations and estimations with predictors of different availability. Catena, 151: 161-173.

DOI

[21]
McCool D K, Foster G R, Mutchler C K et al., 1989. Revised slope length factor for the Universal Soil Loss Equation. Transactions of the American Society of Agricultural Engineers, 32(5): 1571-1576.

DOI

[22]
Peng J, Tian L, Zhang Z M et al., 2020. Distinguishing the impacts of land use and climate change on ecosystem services in a karst landscape in China. Ecosystem Services, 46: 101199.

DOI

[23]
Qian Q H, Wang S J, Bai X Y et al., 2018. Assessment of soil erosion in karst critical zone based on soil loss tolerance and source-sink theory of positive and negative terrains. Acta Geographica Sinica, 73(11): 2135-2149. (in Chinese)

DOI

[24]
Sharp R, Tallis H T, Ricketts T et al., 2018. InVEST 3.7.0 User's Guide. The Natural Capital Project, Stanford University, University of Minnesota, The Nature Conservancy, and World Wildlife Fund. Stanford (CA): Stanford University.

[25]
Steur G, Verburg R W, Wassen M J et al., 2020. Shedding light on relationships between plant diversity and tropical forest ecosystem services across spatial scales and plot sizes. Ecosystem Services, 43: 101107.

DOI

[26]
Wang H, Gao J B, Hou W J, 2018. Quantitative attribution analysis of soil erosion in different morphological types of geomorphology in karst areas: Based on the geographical detector method. Acta Geographica Sinica 73(9): 1674-1686. (in Chinese)

DOI

[27]
Wang H, Liu L B, Yin L et al., 2021a. Exploring the complex relationships and drivers of ecosystem services across different geomorphological types in the Beijing-Tianjin-Hebei region, China (2000-2018). Ecological Indicators, 121: 107116.

DOI

[28]
Wang J F, Xu C D, 2017. Geodetector: Principle and prospective. Acta Geographica Sinica, 72(1): 116-134. (in Chinese)

DOI

[29]
Wang K L, Yue Y M, Chen H S et al., 2019. The comprehensive treatment of karst rocky desertification and its regional restoration effects. Acta Ecologica Sinica, 39(20): 7432-7440. (in Chinese)

[30]
Wang Y, Cai Y L, Pan M, 2013. Analysis on the relationship between soil erosion and land use in Wujiang river basin in Guizhou province. Research of Soil and Water Conservation, 20(3): 11-18. (in Chinese)

[31]
Wang Y P, Zhou Z K, Teng H W et al., 2021b. Characteristics of soil erosion and nutrient losses in three land use patterns in the small watershed of southern Dianchi. Research of Soil and Water Conservation, 28(1): 11-18. (in Chinese)

[32]
Wei M Y, Zhang Z D, Liu Y N et al., 2020. Characteristics of soil erosion in Guangxi based on CSLE. Research of Soil and Water Conservation, 27(1): 15-20. (in Chinese)

[33]
Williams J R, Jones C A, Kiniry J R et al., 1989. The EPIC crop growth model. Transactions of the American Society of Agricultural Engineers, 32(2): 497-511.

DOI

[34]
Wu F, Deng X Z, Yin F et al., 2013. Projected changes of grassland productivity along the representative concentration pathways during 2010-2050 in China. Advances in Meteorology, 812723.

[35]
Xiong K N, Li J, Long M Z, 2012. Features of soil and water loss and key issues in demonstration areas for combating karst rocky desertification. Acta Geographica Sinica, 67(7): 878-888. (in Chinese)

DOI

[36]
Xu E Q, 2017. Spatial variation in drivers of karst rocky desertification based on geographically weighted regression model. Resources Science, 39(10): 1975-1988. (in Chinese)

DOI

[37]
Xu E Q, Zhang H Q, 2020. Change pathway and intersection of rainfall, soil, and land use influencing water-related soil erosion. Ecological Indicators, 113: 106281.

DOI

[38]
Xu J, Wang S, Xiao Y et al., 2021. Mapping the spatiotemporal heterogeneity of ecosystem service relationships and bundles in Ningxia, China. Journal of Cleaner Production, 294: 126216.

DOI

[39]
Xu S N, Liu Y F, Wang X et al., 2017. Scale effect on spatial patterns of ecosystem services and associations among them in semi-arid area: A case study in Ningxia Hui Autonomous Region, China. Science of the Total Environment, 598: 297-306.

DOI

[40]
Yang M H, Gao X D, Zhao X N et al., 2021. Scale effect and spatially explicit drivers of interactions between ecosystem services: A case study from the Loess Plateau. Science of the Total Environment, 785: 147389.

DOI

[41]
Zeng C, Wang S J, Bai X Y et al., 2017. Soil erosion evolution and spatial correlation analysis in a typical karst geomorphology using RUSLE with GIS. Solid Earth, 8(4): 721-736.

DOI

[42]
Zhang H M, Yang Q K, Li R et al., 2013. Extension of a GIS procedure for calculating the RUSLE equation LS factor. Computers & Geosciences, 52: 177-188.

DOI

[43]
Zhang W B, Fu J S, 2003. Rainfall erosivity estimation under different rainfall amount. Resources Science, 25(1): 35-41. (in Chinese)

[44]
Zhao S Q, Wang X H, Shu T Z et al., 2018. Research on topographic factors in relation to regional soil erosion in karst region. Journal of Arid Land Resources and Environment, 32(5): 97-103. (in Chinese)

[45]
Zhou C H, Cheng W M, Qian J K et al., 2009. Research on the classificaton system of digital land geomorphology of 1:1000000 in China. Journal of Geo-Information Science, 11(6): 707-724. (in Chinese)

DOI

[46]
Zhu L J, Meng J J, Zhu L K, 2020. Applying Geodetector to disentangle the contributions of natural and anthropogenic factors to NDVI variations in the middle reaches of the Heihe River Basin. Ecological Indicators, 117: 106545.

DOI

[47]
Zhu Q, Liao K H, Lai X M et al., 2021. Scale-dependent effects of environmental factors on soil organic carbon, soil nutrients and stoichiometry under two contrasting land-use types. Soil Use and Management, 37(2): 243-256.

DOI

[48]
Zuo L Y, Gao J B, 2020. Quantitative attribution analysis of NPP in karst peak cluster depression based on geographical detector. Ecology and Environmental Sciences, 29(4): 686-694. (in Chinese)

Outlines

/