Research Articles

Spatial patterns and controlling factors of the evolution process of karst depressions in Guizhou province, China

  • ZHANG Tao , 1 ,
  • ZUO Shuangying , 1, 2, * ,
  • YU Bo 3 ,
  • ZHENG Kexun 3 ,
  • CHEN Shiwan 1, 2 ,
  • HUANG Lin 1
Expand
  • 1. Key Laboratory of Karst Georesources and Environment, Ministry of Education, Guizhou University, Guiyang 550025, China
  • 2. College of Resources and Environment Engineering, Guizhou University, Guiyang 550025, China
  • 3. Power China Guiyang Engineering Corporation Limited, Guiyang 550081, China
*Zuo Shuangying (1977-), PhD and Professor, specialized in karst engineering geology. E-mail:

Zhang Tao (1998-), Master Candidate, specialized in karst depression resource evaluation and engineering development. E-mail:

Received date: 2022-12-15

  Accepted date: 2023-07-20

  Online published: 2023-10-08

Supported by

The Science and Technology Foundation of Guizhou Province(2022-212)([2020]1Z052)

National Natural Science Foundation of China(42167025)

Abstract

Karst depressions are common negative topographic landforms formed by the intense dissolution of soluble rocks and are widely developed in Guizhou province. In this work, an inventory of karst depressions in Guizhou was established, and a total of approximately 256,400 karst depressions were extracted and found to be spatially clustered based on multidistance spatial cluster analysis with Ripley's K function. The kernel density (KD) can transform the position data of the depressions into a smooth trend surface, and five different depression concentration areas were established based on the KD values. The results indicated that the karst depressions are clustered and developed in the south and west of Guizhou, while some areas in the southeast, east and north have poorly developed or no clustering. Additionally, the random forest (RF) model was used to rank the importance of factors affecting the distribution of karst depressions, and the results showed that the influence of lithology on the spatial distribution of karst depressions is absolutely dominant, followed by that of fault tectonics and hydrological conditions. The research results will contribute to the resource investigation of karst depressions and provide theoretical support for resource evaluation and sustainable utilization.

Cite this article

ZHANG Tao , ZUO Shuangying , YU Bo , ZHENG Kexun , CHEN Shiwan , HUANG Lin . Spatial patterns and controlling factors of the evolution process of karst depressions in Guizhou province, China[J]. Journal of Geographical Sciences, 2023 , 33(10) : 2052 -2076 . DOI: 10.1007/s11442-023-2165-z

1 Introduction

Southwest China, centred on Guizhou province, is one of the most extensive and continuous areas of concentrated karst landforms in the world, and karst depressions are widely distributed in this region (Pardo-Igúzquiza et al., 2020). Karst depressions are usually topographically closed terrain features with negative relief (also known internationally as sinkholes or dolines) formed by dissolution and precipitation, erosion and deposition, gravitational collapse, and accumulation of soluble rocks under the influence of groundwater and surface water (Kranjc, 2013; Pardo-Igúzquiza and Dowd, 2021). Research on karst depressions can play an important role in the scientific fields of geology, geohazards, conservation of geological sites, geomorphology, tourism development, geographic information science, botany, and zoological ecology (Zumpano et al., 2019; Čonč et al., 2022). In particular, karst depressions, as negative terrain features, has the geometric and engineering characteristics of requiring less excavation, better surrounding closure, and large natural capacity, which provide good site conditions for engineering fields such as ash stacking (Wu et al., 2023), new reservoir construction (Rogeau et al., 2017), and astronomical science and technology infrastructure construction (Song et al., 2005). However, due to the extensive development of karst depressions in Guizhou province, the distribution of karst depressions in different regions may be different, and the main controlling factors may also be different.
Although karst depressions in different regions share similar geomorphological features geologically and geographically, such as closed shapes without surface drainage outlets, they differ significantly in their morphology and spatial distribution patterns among different regions due to differences in the degree of development (Gutiérrez et al., 2014). Research on characterizing karst depression morphology has made great progress in recent decades (Williams, 1972; Yang, 2019), and many scholars have used indicators such as area, diameter, elevation, aspect ratio, perimeter, roundness index, depth, elongation, and compactness of karst depressions to reveal the evolutionary process of geomorphic development in a region (Basso et al., 2013; ÖZtÜRk, 2018; Šegina et al., 2018; Theilen-Willige, 2018), which makes the study of the morphological characteristics of karst depressions an ongoing research hotspot. Furthermore, the recognition methods and extraction techniques for various factors affecting morphological features provide good approaches for the establishment of karst depression databases (Yan et al., 2018). However, most of the morphological characteristics of depressions only provide information on the formation and evolution patterns from an individual perspective (Meng, 2019), and the causes of the macroscopic spatial patterns of depressions are still poorly constrained; in particular, regional assessments lack exploration, which makes research on the spatial patterns and controlling factors of karst depressions on a regional scale particularly important.
The distribution of karst depressions is not random, and their formation is subject to the synergistic effects of multiple factors (Yuan, 2016). Some studies have shown that the depression evolution process is always closely coupled with the stratigraphy, lithology, tectonic conditions, and epigenetic geological effects (erosion, weathering, etc.) in the region (Song, 1986; Öztürk et al., 2018; Luo et al., 2021), which leads to complex formation mechanisms and developmental processes (Cahalan and Milewski, 2018) and ultimately a wide variety of spatial distribution patterns for karst depressions (Song, 1986; Cahalan and Milewski 2018; Öztürk et al., 2018; Luo et al., 2021). Conversely, the differential distribution of karst depressions may represent key evidence of the diversity of geoenvironmental conditions, and similar geomorphic evidence also includes gullies (Zhao et al., 2022), wastelands (Avcıoğlu et al., 2022), caves (Zhou et al., 2017), and Danxia landforms (Yan et al., 2019; Tan et al., 2021). This makes geomorphic differences and controlling geoenvironmental conditions of depressions on a large scale worthy of more attention.
Moreover, karst landscapes, as one of the most important tourism resources in western China, have made significant contributions to local economic development (Xu et al., 2017). In addition, with the increasing scarcity of land resources, the value of karst depressions as engineering construction sites is becoming increasingly obvious (Rogeau et al., 2017). Therefore, to better develop and utilize karst depressions, it has become necessary to study their spatial distribution pattern and controlling factors in key regions. Stratigraphy, lithology, tectonic conditions and epigenetic geological processes all have an influence on carbonate erosion, but the extent of influence of these factors controlling the spatial distribution of karst depressions is not fully clear, and there is a lack of quantitative relationships describing them. The purpose of this work is to establish a database of karst depression resources (150,900 km2) in the karst areas of Guizhou province, explore their spatial distribution pattern, and determine the coupling between the spatial distribution and geoenvironmental factors. The research results will provide a scientific basis for the genesis exploration and resource utilization of karst depressions in Guizhou province.

2 Data and methods

2.1 Data source

2.1.1 Basic characteristics of the research area

Guizhou province is adjacent to the southern edge of the Qinghai-Tibet Plateau and is located in the hinterland of southwest China (between 103°36'-109°35'E and 24°37'-29°13'N), which is the slope zone of the transition from the mountains of the Yunnan-Guizhou Plateau to the hilly plains of Guangxi and has experienced intermittent strong uplift of the Earth's crust during the neotectonic period (Yan et al., 2011). This region was inundated by the sea before the Late Triassic and then began to evolve into an inland environment, and it experienced uplift during the Yanshan and Xishan events at the end of the Mesozoic and Cenozoic, forming the present tectonic and topographic framework (Li, 2011; Chen and Wang, 2017). Overall, western Guizhou has significant plateau topography (elevation >1600 m, Jiucaiping Plateau the highest at approximately 2900 m), the central part is an undulating karst mountain plain (elevation 1000-1600 m), while the northern and eastern parts are low hills (elevation <1000 m), forming a three-step landscape with elevations gradually decreasing from the west to the north, east and south (Figure 1) (Xie et al., 1987; 2022). The well-developed, high-quality and thick marine carbonate rocks from the late Aurignacian to the middle of the Late Triassic are concentrated and distributed in different parts of Guizhou, providing the material basis for colourful and varied karst landforms, mainly peak forest, peak clusters, troughs, depressions, caves and canyons, forming world famous landscapes such as the Huangguoshu Waterfall, Xingyi Wanfeng Forest, Zhijin Cave and Shuanghe Cave (Figure 1). On the other hand, the topography of Guizhou was mainly formed during long-term complex plate tectonic processes, and these plates and orogenic belts determined the complex folding and fracture system that controls the outcrop state of carbonate rocks and nonsoluble rocks of different ages (Li, 2001).
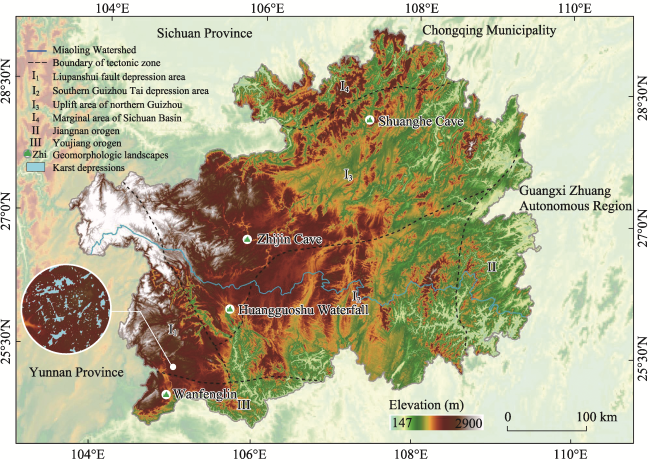
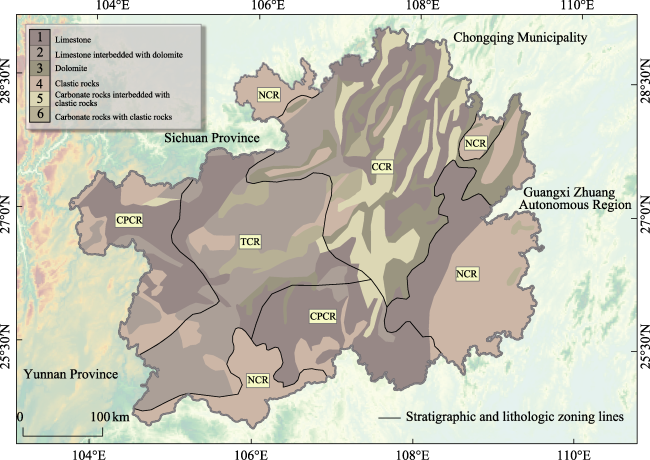
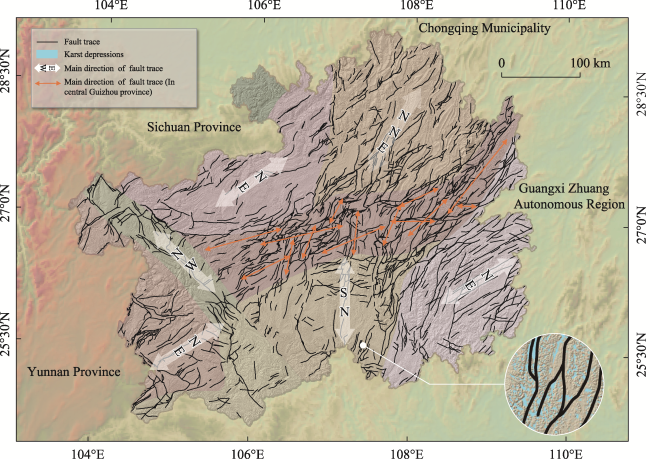
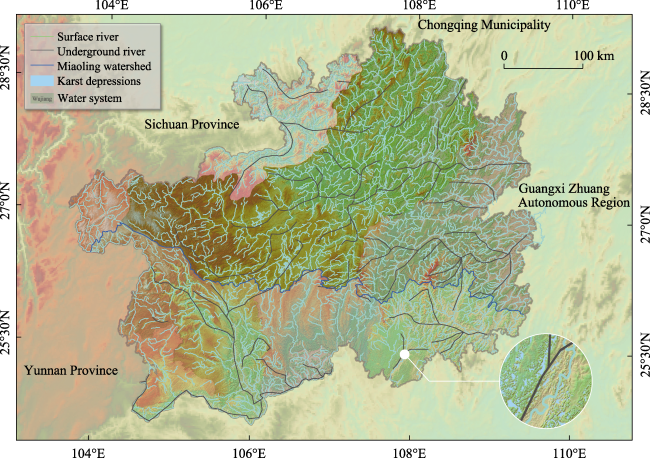
Figure 1 Basic characteristics of Guizhou province, southwest China

Note: The lower right map indicates the geographical location of Guizhou province; the blue overlay area indicates the location of karst depressions; the dark blue line indicates the Miaoling watershed, which divides the Yangtze River basin and the Pearl River basin, with the Yangtze River basin to the north and the Pearl River basin to the south; the black dashed line is the tectonic unit demarcation line, and I1-III indicate the tectonic unit codes; the circular icons and notes indicate the geographical location and names of typical geomorphic wonders in Guizhou.

Guizhou features a subtropical humid monsoon climate, influenced by the towering mountains, with no extreme hot summer and no severe cold winter, with an average annual temperature between 18°C and 26°C and an average annual precipitation of 1300 mm (Wang, 2015; Zhang et al., 2019). The rivers in southern Guizhou belong to the Pearl River basin, and the northern rivers belong to the Yangtze River basin, with central Miaoling as the watershed (Figure 1). Due to dense river networks and deep valleys, the rich surface runoff and topography with large differences in elevation provide excellent conditions for cascade hydropower development.

2.1.2 Materials

The research data include three types: graph data, text data and raster data, mainly including digital elevation model (DEM) data of the study area, a geological map, a hydrogeological map, annual average rainfall data, vegetation cover, etc. (Table 1). With ArcGIS data processing, vectorization processing, such as scanning, preprocessing, geographic registration, unified coordinate system, splicing and attribute entry of the collected data, was carried out to establish data stratification and attribute extraction and realize digitalization of maps.
Table 1 Data used and corresponding sources
Data Time Spatial resolution Format Source
Digital elevation model (DEM) 2011 12.5 m×12.5 m TIF National Aeronautics and Space Administration
(https://urs.earthdata.nasa.gov)
Geological map of Guizhou province 2009 1:500,000 JPG Geological Cloud
(https://geocloud.cgs.gov.cn/)
Hydrogeological map of Guizhou province 1985 1:500,000 JPG Geological Cloud
(https://geocloud.cgs.gov.cn/)
Average annual rainfall 1960-2018 - TXT China Meteorological Data Network
(https://data.cma.cn/)
Vegetation cover 2021 30 m×30 m TIF Geospatial Data Cloud
(https://www.gscloud.cn/)

2.2 Methods

2.2.1 Creating an inventory of karst depressions

The rich resources of karst depressions in Guizhou have been widely acknowledged (Song et al., 2006; Gao et al., 2012). Although they play an important role in plant conservation, tourism development, and land use, they have not been fully identified, quantified, or classified for various reasons. In fact, the existing geological maps have been traditionally used to identify and distinguish karstic regions from nonkarstic regions, but there are some problems, such as small scope, low efficiency and lack of accuracy (Doctor et al., 2013; Chen, 2016). In recent decades, the identification accuracy, fine-scale depiction, and classification standard of karst landforms (including small-scale landscapes) have reached higher levels by GIS mapping techniques and high-resolution LiDAR-derived DEM data (Wu et al., 2016; Xu, 2016; Kim et al., 2022). Therefore, DEM data with a 12.5 m spatial resolution provided by the NASA website (https://urs.earthdata.nasa.gov) were used in this work to identify and extract karst depressions (including negative terrain features such as sinkholes, waterfall holes, BAZIs, artificial negative terrain, etc.) in Guizhou (Figure 2a) with the contour tree method, which was proven to be a very effective method in practice (Miao et al., 2013; Wu et al., 2016; Wang et al., 2017; Yang et al., 2020).
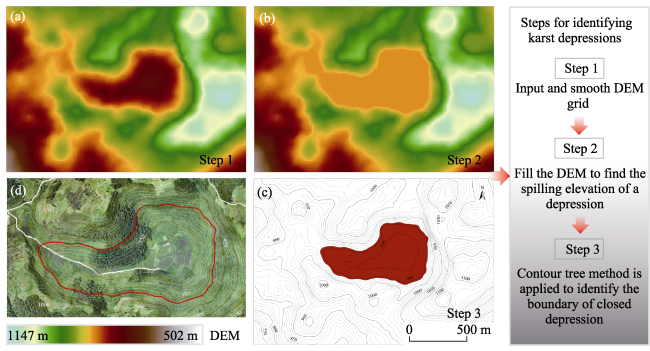
Figure 2 Brief description of depression identification steps

Note: (a) Import of a 12.5 m DEM and preliminary processing; (b) Filling of the DEM to obtain overflow elevation; (c) Identification and extraction of closed depressions by the contour tree method; (d) Aerial view of a sample depression by a UAV.

Negative terrain is terrain where the surface of the terrain is low relative to the surrounding ground or reference plane. Such features mainly include karst depressions, sinkholes (tiankeng), waterfall holes, dolines, karst valleys and karst basins (BAZI) (Table 2) (Cui, 2021). Among them, a karst depression is a common type of closed negative landform formed under the action of karst processes in karst areas. Its shape is closed, and the lowest saddle pass around the depression is taken as the horizontal datum (Meng, 2019).
Table 2 Typical negative landforms and their characteristics
Negative terrain type Definition/Characteristics
Karst depression It refers to the common type of closed negative landform formed by karst processes acting on rock in karst areas, the lack of surface drainage outlets, forms a closed shape, mostly circular, surrounded by low mountains or peak forests, the bottom is “pot shaped”, the radius is tens of metres to thousands of metres, the area is generally from a few square kilometres to more than ten square kilometres (Gao et al., 2012).
Sinkholes (tiankeng) A karst negative terrain with steep walls, depth and diameter up to hundreds of metres developed in karstic carbonate areas (Shui et al., 2015).
Water fall hole An inlet of surface water into the ground, similar in surface shape to a funnel, which opens in the ground and leads to a deep fissure (underground river or cave) in the ground (Peng, 2020).
Doline After karst ground is dissolved and karst collapses, a small inverted cone-shaped closed depression landscape with small bottom is formed. Its depth is not large, its slopes are gentle, its edges are not obvious, and its shape is mostly saucer-shaped (He, 2018).
Karst valley A landform formed by the chemical dissolution and erosion of soluble rocks by running water in the form of a long depression or valley with a U-shaped surface (Qin et al., 2020).
Karst basin (BAZI) It refers to some broad and flat basins or valleys in karst areas, ranging from hundreds to thousands of metres in width and up to tens of kilometres in length. The basins have steep slopes and uniform bottoms, which are flat and open. In southwest China, it is often called BAZI (Zhou et al., 2012).
Artificial negative terrain Large-scale negative terrain formed by excavation by humans, such as dry reservoirs, abandoned mines and so on.
Therefore, based on the morphological characteristics of karst depressions, the DEM was initially imported and analysed statistically in ArcGIS (10.8) using the neighbourhood analysis tool, and then the DEM was smoothed to eliminate pseudo-depressions caused by data errors (Figure 2a). The concept of depression overflow elevation was introduced to fill the negative topography (Figure 2b) (Lindsay, 2014), and the topological structure relationship was used to achieve accurate boundaries of the karst depression based on the spatial location of closure contours (Wu et al., 2016) (Figure 2c). Because karst depressions with small sizes do not have much practical significance, depressions with overflow elevation planes less than 100 m2 and depths less than 0.5 m were excluded from the identification of karst depressions, as were continuous flat areas and river valley trunks due to identification errors. According to these conditions, the screening was sufficient to identify almost all karst depressions in the research area (Shaw-Faulkner et al., 2013; Wu et al., 2016). The above method was developed into an ArcGIS toolbox through the Python programming language, effectively improving the extraction process.

2.2.2 Analysis method of spatial pattern

(1) Multidistance spatial cluster analysis
Multidistance spatial clustering analysis based on Ripley's K function is widely used to determine whether the data at a point are clustered or discrete within a certain distance (Chen et al., 2021; Zhao et al., 2021) and is a mature method for analysing the spatial distribution patterns of geographic objects. This method has been applied to the distribution of mineral deposits (Maepa et al., 2020) and the spatial distribution of karst peak forests (Yang, 2019). With the use of Ripley's K function in ArcGIS to analyse the spatially clustered distribution pattern of karst depressions (Ding et al., 2019b), the output is actually a graph of the relationship between the observed and predicted curves of the spatial distribution of depressions. When the observed value is greater than the predicted value, the depressions exhibit a clustered distribution at a certain distance, and when the observed value is less than the predicted value, the depressions exhibit a discrete distribution. When the difference between the observed and predicted values (DiffK field value) is the largest in the range of clustering distribution distances, the corresponding spatial clustering distance is the most significant. At the same time, to avoid depressions with different areas that can only be one point after being converted to point data in practical applications, which cannot fully represent the actual range of depressions, this work creates a depression DEM raster layer and converts the raster grid into a large amount of point data. Each depression is represented by a different number of point data points, and finally, these point data are fed into Ripley's K function to obtain the degree of spatial distribution clustering of karst depressions. Ripley's K function is calculated as (Zhao et al., 2021):
$K(d)=S\underset{i}{\mathop \sum }\,\underset{i\ne j}{\mathop \sum }\,\frac{I({{d}_{ij}})}{{{N}^{2}}}$
where S is the total area of the research area, d is the spatial distance, I(dij) is the number of karst depressions in a circle with the radius dj at level j centred on i, and N is the point data.
(2) Smoothing images with kernel density
Kernel density (KD) can transform point data into smooth trend surfaces and divide them into a point density map with shape surfaces of different densities, which is a model for nonparametric estimation of probability density (Dong et al., 2020). A point density map is particularly useful in analysis of the spatial distribution of karst depressions because it can reflect the spatial density variability of depressions, especially by visualizing the concentration of depressions within a region, with larger KD values indicating a higher depression density within the region. In practice, it is often necessary to set a default search radius, and the algorithm will finally generate a spatial trend surface by searching all depression point data within that radius distance and calculating the density contribution value of each data point based on the kernel density (Wu et al., 2022; Zhao et al., 2022). The kernel density function is expressed as:
$f(x)=\frac{1}{n{{R}^{a}}}\underset{i=1}{\overset{n}{\mathop \sum }}\,k\left( \frac{x-{{x}_{i}}}{R} \right)$
where a is the spatial dimension, R is the search radius (bandwidth), and n is the number of points whose distance from position xi is less than or equal to R. $k\left( \frac{x-{{x}_{i}}}{R} \right)$ is the spatial weight function, calculated as:
$k\ \left( \frac{x-{{x}_{i}}}{R} \right)=\left\{ \begin{matrix} \frac{3}{\pi }{{\left[ 1-\ {{\left( \frac{x-{{x}_{i}}}{R} \right)}^{2}} \right]}^{2}},\ \ \ \ {{\left( \frac{x-{{x}_{i}}}{R} \right)}^{2}}\le 1 \\ 0,\ \ \ \ \ \ \text{ }otherwise \\ \end{matrix} \right.$
The default search radius:
${{R}_{i}}=0.9*\min SD\sqrt{\frac{1}{\ln \left( 2 \right)}}*{{D}_{m}}*{{N}^{-0.2}}$
where Ri denotes the default search radius, SD is the standard distance between depression data points, Dm is the median distance of depression data points, and N is the total number of depression points.

2.2.3 Methodology for main controlling factors

In this work, the random forest (RF) model can be used to assess the main factors controlling the aggregation of the spatial distribution of karst depressions. The final results are produced by automatically generating multiple decision trees and predicting the votes through the combination of these decision trees, which can be used to perform some analyses, such as discriminant, clustering and regression, while assessing the importance of independent variables (Wang et al., 2019; Xu et al., 2023). The RF model has the following characteristics: (1) no variable selection is needed; (2) no multivariate covariance problem needs to be considered; (3) overfitting of results is avoided; (4) the importance of independent variables can be evaluated; and (5) the learning process is fast. Therefore, it is suitable for influence factor exploration (Liu et al., 2020). There are many studies on the factors affecting the development of karst depressions, and the following factors have been identified as the basic variables and can be categorized as internal and external factors. The internal factors include lithology, fault structure, surface water system, groundwater movement characteristics, etc. The external factors include multiyear average rainfall (precipitation data from 17 meteorological stations in Guizhou province during 1960-2018 were used (Mo et al., 2021)), slope, vegetation cover, etc. The corresponding classification criteria were chosen according to the relevant studies (Table 3). However, to reduce the data dispersion, the reclassified data need to be normalized to [0,1], and the normalization formula is:
$y=\frac{x-{{x}_{min}}}{{{x}_{max}}-{{x}_{min}}}$
where y is the normalized result of reclassification of each classification criterion, x is the reclassification value, and xmax and xmin are the maximum and minimum values of reclassification in the same category of impact factors, respectively. In this study, based on the kernel density (KD) of the karst depression, the influence factors in Table 3 are used as explanatory variables, and the KD values are used as dependent variables to construct the RF model for each depression cluster area. The main control factors for the spatial differences of different depression clusters are obtained by feature importance ranking.
Table 3 Classification of factors influencing the aggregation of the spatial distribution of karst depressions
Factors Classification Reclassification Normalization Reference
Internal factors Rock (Ro) Dolomite 1 0 (Ding et al., 2019b)
Limestone 2 0.2
Dolomite interbedded with limestone 3 0.4
Carbonatite intercalated clastic rocks 4 0.6
Carbonates interbedded with clastic rocks 5 0.8
Clastic rocks 6 1.0
Fault (Fa) 0-1 km buffer zone 1 0 (ÖZtÜRk, 2018)
1-2 km buffer zone 2 0.25
2-3 km buffer zone 3 0.50
3-4 km buffer zone 4 0.75
>4 km buffer zone 5 1.0
Surface water system (Sr) 0-0.5 km buffer zone 1 0 (Cahalan et al., 2018)
0.5-1.5 km buffer zone 2 0.33
1.5-3.0 km buffer zone 3 0.67
>3.5 km buffer zone 4 1.0
Underground River (Ur) 0-0.5 km buffer zone 1 0 (Panno et al., 2013)
0.5-1.5 km buffer zone 2 0.33
1.5-3.0 km buffer zone 3 0.67
>3.5 km buffer zone 4 1.0
External factors Annual rainfall (Mar) ≥1300 mm 1 0 (Xu et al., 2017)
1200-1300 mm 2 0.33
1100-1200 mm 3 0.67
1000-1100 mm 4 1.0
Slope (Sl) <5° flat slope 1 0 (Al-Kouri et al., 2013)
6°-15° gentle slope 2 0.25
16°-25° slope 3 0.50
26°-35° steep slope 4 0.75
>35° sharp slope 5 1.0
Vegetation cover (Vc) >80% 2 0.25 (Ding et al., 2019a)
80%-60% 3 0.50
60%-40% 4 0.75
40%-20% 5 1.0
<20% 2 0.25

3 Results and analysis

3.1 Distribution characteristics of karst depressions

In this work, 256,370 karst depressions were extracted, distributed in the 150,900 km2 karst area of Guizhou province, with nonuniform spatial distribution characteristics, and the total planar area of all karst depressions is 6640.75 km2, accounting for 4.4% of Guizhou's national land area. The maximum area of a single depression is 43.09 km2, and the average area is 0.26 km2. The results of the multidistance spatial clustering analysis based on Ripley's K function showed that the highest degree of karst depression clustering was at the 30 km scale (Figure 3a). The kernel density values (KD) and depression area density maps were obtained by kernel density estimation (performed using ArcGIS 10.8 software), and the results demonstrated that the depressions have a very significant spatial aggregation distribution pattern (Figure 4). According to the KD values using the Jenks natural breaks algorithm (Avcıoğlu et al., 2022), the depressions were classified into categories with relatively large differences in KD values. In total, the depressions were divided into 5 categories: Class A superconcentrated area (KD: 15.92-22.94), Class B concentrated area (KD: 11.13-15.92), Class C somewhat concentrated area (KD: 7.66-11.13), Class D weakly concentrated area (KD: 4.46-7.66), and Class E nonconcentrated area (KD: 0-4.46) (Figure 3b), and the percentages of the areas of these five types with respect to the total karst area are 4.46%, 11.34%, 19.49%, 41.72%, and 22.90%, respectively.
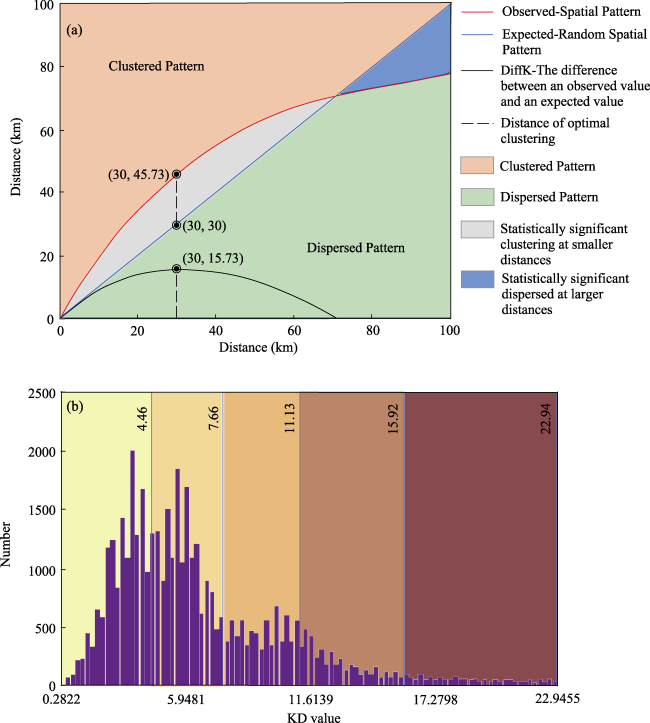
Figure 3 Multidistance spatial cluster analysis (a) and Jenks natural breaks (b)

Note: KD stands for kernel density.

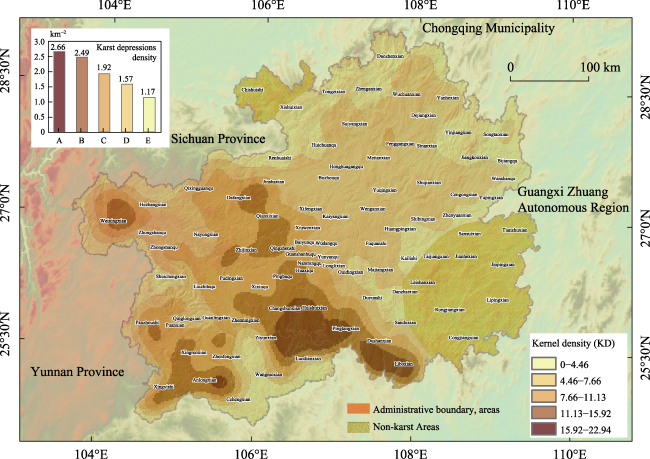
Figure 4 Kernel density distribution of karst depressions in Guizhou province, southwest China

Note: A stands for Class A superconcentrated; B stands for Class B concentrated; C stands for Class C somewhat concentrated; D stands for Class D weakly concentrated; E stands for Class E nonconcentrated.

The Class A superconcentration area is mainly distributed in the area of Libo-Dushan- Pingtang-Huishui-Ziyun in southern Guizhou, which is the most densely developed depression area in the whole study area, and a few instances are present in Anlong county. Although the area of this high concentration area accounts for only 3.80% of the total area of the province, 17,827 depressions are distributed in the area, with a depression density of 2.66 km-2 and a total depression area of 1096.45 km2. Class B concentrated areas are all distributed in western and southern Guizhou, are mainly areas surrounding the Class A areas and are distributed in the area of Xingren-Xingyi-Anlong in southwestern Guizhou and the area of Weining-Dafang-Qianxi-Qingzhen-Zhijin in western Guizhou, with a total of 42,973 depressions and a depression density of 2.49 km-2. Class C somewhat concentrated areas are mainly distributed around Class A and Class B, and they exhibit a scattered distribution in Fenggang-Meitan in northern Guizhou, with a total of 56,439 depressions in the region and a depression density of 1.92 km-2. Class D weakly concentrated areas are mainly distributed in northeastern Guizhou, dominantly in the lower Wujiang River basin, with 98,719 depressions distributed in an area of 62,900 km2 and a depression density of 1.57 km-2. The Class E nonconcentrated areas are mainly nonkarst marginal areas in southeastern Guizhou and nonkarst marginal areas in northern Guizhou, and 40,412 depressions without aggregation are scattered in this area, with a depression density of only 1.17 km-2. Overall, karst depressions are spatially unevenly distributed in Guizhou, and they are well developed in the south and west of Guizhou and poorly developed in large areas in the southeast, east and north.

3.2 The main factors controlling the spatial distribution of karst depressions

This work mainly analyses the influence degree of individual factors on the spatial distribution of karst depressions according to the RF model. Random forest is fitted and validated for the influence factors of the Class A superconcentrated areas, Class B concentrated areas, Class C somewhat concentrated areas, Class D weakly concentrated areas, Class E nonconconcentrated areas and karst depressions in the karst areas of Guizhou (Figure 5). The true value and predicted value of KD indicate that the constructed RF model has a correlation coefficient (R2) between 0.45 and 0.76, indicating a moderate correlation. This demonstrates that the model has a moderate degree of accuracy. The results of feature importance ranking show that the influence degree of rock (Ro) on the spatial distribution of karst depressions is absolutely dominant (35.6%), and Ro can explain 15.4%-33.3% of the spatial distribution of karst depressions in the different subdivisions, making it the key internal factor influencing the spatial distribution of karst depressions. It can also be seen that in superconcentrated areas (Class A), concentrated areas (Class B) and nonconcentrated areas (Class E), Ro is the main controlling factor. Multiyear average rainfall (Mar) and faults (Fa) are secondary influences on the spatial distribution of karst depressions, and their explanatory strengths range from 16.9% to 19.9% and 11.3% to 17.9%, respectively. The influence degree of Mar increases and then decreases with the changes in the distribution of depressions from concentrated to unconcentrated areas, while Fa has a large influence mainly in the concentrated areas of depressions. The surface water system (Sr) and vegetation cover degree (Vc) are relatively weak in explaining the spatial distribution of karst depressions, and the explanatory powers of underground rivers (Ur) and slope (Sl) are the weakest.
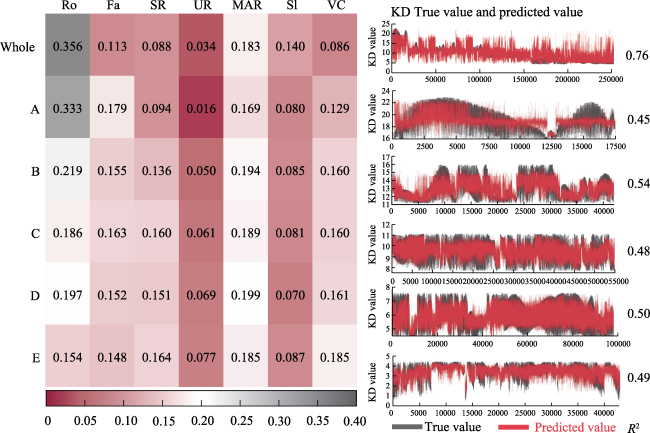
Figure 5 The results of the explanatory strength and precision analysis of the influencing factors of the spatial distribution of karst depressions based on the RF model

Note: Ro stands for rocki; Fa stands for fault. Sr stands for surface water system; Ur stands for underground river; Mar stands for annual rainfall. Sl stands for slope. Vc stands for vegetation cover degree. Whole stands for the karst area of Guizhou province. A stands for Class A superconcentrated. B stands for Class B concentrated. C stands for Class C somewhat concentrated. D stands for Class D weakly concentrated. E stands for Class E nonconcentrated.

The results for different karst depression aggregation zones show that the characteristic importances of the influencing factors in the Class A superconcentrated area exhibit the order of Ro>Fa>Mar>Vc>Sr>Sl>Ur, and Ro is the main controlling factor. Ro remains the dominant factor in the Class B concentrated area, followed by Mar. The explanatory strengths of Ro, Fa, Mar, Sr, and Sl in the Class C somewhat concentrated area and Class D weakly concentrated area do not differ significantly, suggesting that the depressions in these two zones are the result of multiple factors acting simultaneously. In the Class E nonconcentrated area, the explanatory strengths of MAR, VC and SR are 18.5%, 18.5% and 16.4%, respectively, which are the main factors controlling whether a depression forms in this area, followed by Ro and Fa.

4 Discussion

4.1 The material basis affecting the spatial pattern of karst depressions

The carbonates in the research area formed over a long geological period and in variable depositional environments. Therefore, there are certain differences in the properties among the rocks with different geological ages. Based on the 1:500,000 geological map of Guizhou province and previous research results, we reclassified the lithologies of the main outcrops in Guizhou into two major categories: carbonate rock units (CR) and noncarbonate rock (NCR) units. The carbonate unit is further divided into three sublithologic units, including the Middle and Lower Triassic carbonate unit (TCR), the Carboniferous to lower Permian carbonate unit (CPCR), and the middle and upper Cambrian carbonate unit (CCR) (Xie et al., 1987; Li, 2001). These rocks reflect four main geological eras, including the Triassic, Permian, Carboniferous and Cambrian, and the lithologies involved in the above classification are divided into a dolomite rock group, limestone rock group, dolomite and limestone interbedded rock group, carbonate rock interbedded clastic rock group, carbonate rock with clastic rock group, and clastic rock group (Figure 6) (Li, 2001).
Figure 6 Lithologic reclassification and lithologic distribution of Guizhou province, southwest China

Note: CPCR stands for the Carboniferous to lower Permian carbonate unit; TCR stands for Middle and Lower Triassic carbonate unit; CCR stands for middle and upper Cambrian carbonate unit; NCR stands for the noncarbonate rock unit (after Xie et al., 1987; Li, 2001).

The research shows that most of the extracted karst depressions are concentrated in southern and western Guizhou, and the depressions in these regions are mainly associated with the distribution of carbonate rocks. In particular, almost all of the Class A superconcentrated area in southern Guizhou is distributed within the CPCR, and limestone accounts for 64% of the lithological unit (Figure 6). The same situation occurs in lithological units where interbedded limestone and dolomite are more dominant; for example, the TCR has a dominant ratio (59% interbedded limestone and dolomite and 19% limestone) (Figures 4 and 6) in the Class B concentrated area and the Class C somewhat concentrated area. In addition, clastic rocks are overwhelmingly dominant in the Class E nonconcentrated area; for example, clastic rocks represent up to 75% in the SE, NE and northern NCR, resulting in less development of depressions in this area. It should also be noted that although we extracted a certain amount of depressions in northeastern Guizhou (downstream of the Wujiang River), we did not observe a dominant lithological dominance in this region. The lithology in the northeastern CCR is complex, and the lithology percentages of limestone, limestone interbedded with dolomite, dolomite, clastics, carbonate interbedded with clastics, and carbonate with clastics are 25%, 10%, 29%, 9%, 23%, and 4%, respectively, and the ratios of limestone, dolomite, and carbonate interbedded with clastics do not differ significantly.
This research also analysed the influence of different stratigraphic and lithologic combinations on the distribution of karst depressions based on the relation between the spatial distribution and the basement stratigraphy and lithology. Carbonate formations are widely exposed in Guizhou, among which the limestone rock group, dolomite rock group, and limestone and dolomite interbedded rock group account for 32.18%, 10.33% and 19.69% of the province's land area, respectively (Figure 7). The results of overlay analysis with the karst depression distribution map showed that 93,241, 31,699 and 61,087 karst depressions are developed in the above three rock groups, accounting for 36.28%, 12.33%, and 23.77% of the total number of depressions, respectively, which is consistent with the area ratio of the exposed carbonate rock group. The similarity analysis of the carbonate interbedded with clastic rock group, carbonate with clastic rock group, and clastic rock group shows that the number of karst depressions developed in these three rock groups accounts for 9.07%, 5.20%, and 13.35% of the total number of depressions, respectively. Overall, the percentages of the number of depressions exposed in the TCR, CPCR, and CCR with respect to the total number of depressions in different sublithologic units are 30.40%, 29.16%, and 33.55%, respectively. It is clear that there is a strong correlation between karst depressions and lithology, and the vast majority of karst depressions are developed in lithologies associated with carbonates throughout the area. In particular, pure carbonate formations (limestone, dolomite, and dolomite interbedded with limestone) strongly control the spatial distribution of karst depressions, and the proportion of karst depression development gradually decreases with increasing clastic rock content in the formations. In addition, karst depressions develop more easily in limestone than in dolomite, and almost all the depressions in the Class A superconcentrated area are present in limestone.
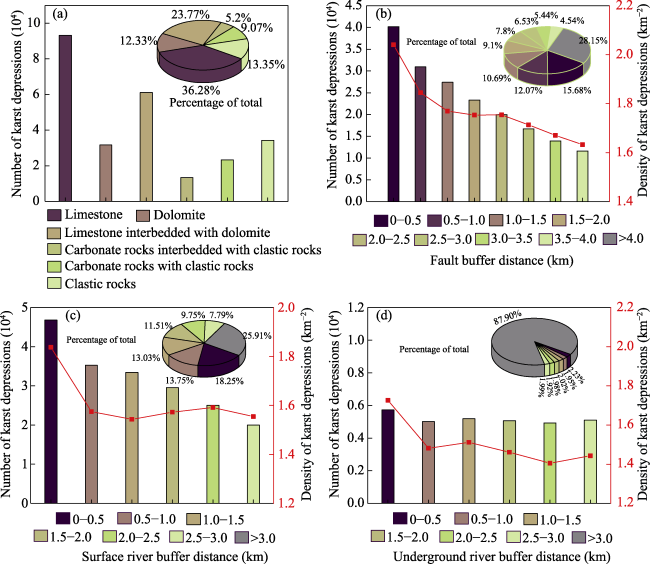
Figure 7 The results of the overlay analysis of geological conditions and karst depressions in Guizhou province, southwest China

Note: These plots include the number of depressions developed (histogram), the percentage of the total number of depressions (pie chart), and the density of depressions (dotted line chart).

Rocks are characterized by large regional diversity with different chemical compositions, exposure scales, and attitudes (Zhao et al., 2022). Differences on the macro- and micro-scales influence orogenic and dissolution forces in karst regions (Wang et al., 2014), which in turn affect the spatial configuration of karst depressions. Karst depressions often develop through dissolution of the basal rock or along pre-existing fractures (Jeanpert et al., 2016), so the soluble and permeable properties of the host rock are important conditions for depression formation (Song et al., 2006). This also implies that soluble rocks are the material basis for karst depression development, and rock variability strongly controls the spatial distribution of karst depressions.
Karst depressions have high degrees of aggregation in carbonate rocks with pure texture, thick layers, high hardness and low porosity (Song et al., 2006; Zhang et al., 2019). The pure carbonate rocks are homogeneous, the clastic content of rock layers is less than 5 m, the content of insoluble muddy material is less than 10% (Wang et al., 2004), the CaO content is more than 50%, the acid-insoluble material content is less than 10%, the rocks are more water-rich, and the pores between rock particles are well developed, so they have high solubility and permeability. Under the synergistic effect of geological structures, they mostly form subcircular, shallow disc-like negative topographic features above ground and develop underground rivers and caves below ground.
In the research area, the subpure carbonate rocks are mainly distributed in the western and northern areas (Figure 6), and the carbonate rocks contain obvious clastic interlayers (continuous thickness >10 m) with CaO contents of 40%-50% and acid-insoluble material contents between 10% and 30%. As the proportion of carbonate rocks decreases, the solubility of the rocks decreases, and the depressions developed in such formations are mainly formed by dissolution in the early stage. Then, karst fissures are continuously developed by crustal uplift, and the final depressions are formed by weathering (Gao et al., 2012). In addition, because the clastic rocks are mainly composed of sandstone, conglomerate, siltstone, etc., which are tightly cemented and hard in nature and have strong resistance to erosion (Brock-Hon et al., 2019), the content of acid-insoluble material is more than 30%, which is not conducive to the dissolution and erosion by flowing water. There is a difference in the weathering of carbonate rocks and clastic rocks, resulting in the formation of majestic geomorphic landscapes such as peaks and cliffs.

4.2 Spatial conditions controlling the distribution pattern of karst depressions

Faults are one of the manifestations of plate motion (Zhou et al., 2017), and Guizhou is divided by a large plate and two tectonic zones (Figure 1). The main active faults were extracted in ArcGIS based on the 1:500,000 geological map of Guizhou, and they present complex and diverse tectonic forms in the region (Figure 8). There is some similarity between the overall distribution direction of depressions in some concentrated areas and the main direction of active faults in the region. For example, the NW-oriented and NE-oriented faults in the southwest are consistent with the direction of Class B concentrated areas and Class C somewhat concentrated areas (Figures 4 and 8). Of course, since the depressions in the Class D weakly concentrated areas and Class E nonconcentrated areas are poorly clustered, it is impossible to determine what the connection between the overall directionality of the faults and depressions is regionally. Therefore, the influence of faults on the spatial distribution of the depressions is quantified by setting fault buffers at scales of 0-1 km, 1-2 km, 2-3 km, and 3-4 km.
Figure 8 Distribution of major active faults in Guizhou province, southwest China (after Xie et al., 1987; Wang, 2015)
The overlay analysis result between the fault buffer zone and karst depression distribution (Figure 7b) showed that there are 71,151 karst depressions, accounting for 27.75% of the total number, with a density of 1.90 km-2 within the 0-1 km fault buffer zone. In the 1-2 km, 2-3 km, and 3-4 km buffer ranges, there are 50,747, 36,724, and 25,585 karst depressions, accounting for 19.79%, 14.32% and 9.98%, with densities of 1.76 km-2, 1.73 km-2, and 1.65 km-2, respectively. The number and density of karst depressions present a negative correlation trend with the fault buffer distance, and the depressions are less developed with increasing distance from a fault zone, indicating that faults play an important controlling role in the spatial distribution of karst depressions, which is consistent with the findings of Ding et al. (2019b).
Tectonic activity is an important factor controlling the distribution pattern of karst depressions. A significant negative correlation between karst depressions and the distance from fault tectonic lines was found through quantitative studies (Figure 7b). The development scale of depressions becomes significantly larger where fault tectonic lines cross each other under specific lithological conditions because fault activity controls the attitude and distribution of rocks and causes rock fragmentation and the generation of a large number of tectonic fissures, opening up channels for surface water infiltration (Xu et al., 2008; Yao, 2009). On the one hand, CO2 and other gases in the air can migrate into flowing water and infiltrate into groundwater, which enhances the dissolution effect of groundwater on bedrock and makes the porosity of soluble rocks increase, which has a positive impact on the infiltration of water in karst areas. On the other hand, surface water and groundwater are constantly flushed along the fissure channels, increasing the mobility of water in karst areas and subjecting bedrock to long-term erosion.
From a macroscopic point of view, karst depressions are the products of multiple phases of tectonic activity (Deng et al., 1987). For example, in the western and southern regions of Guizhou, septal fold tectonics have resulted in a gentle outcrop of Devonian to Triassic carbonate rocks and the formation of highly karstic peaks and peak depressions in the region (Li, 2001). In the northeast, the NNE-oriented tectonic trap unit (Figure 8) dominates, allowing clastic rocks to be exposed and surround carbonate rocks with various ages (Figure 6), forming a karst landscape with a striped distribution. At the same time, the differences in the degree of tectonic damage in bedrock in the same outcrop also results in differences in the morphology of karst depressions. For example, Pingtang county is within a steeply dipping fracture zone (dip angle greater than 30°), and the area features an anticline whose edge is composed of clastic strata; this combination has led to a regular morphology and a large number of peak depressions. Therefore, the National Astronomical Observatory of China built a five-hundred-metre aperture spherical radio telescope (FAST) by taking advantage of the morphology of karst depressions in the region.

4.3 Hydrodynamic conditions controlling the spatial pattern of karst depressions

The surface rivers and underground rivers based on the 1:500,000 geological map of Guizhou province were vectorized to quantitatively analyse the influence of water systems on the spatial distribution of karst depressions, as shown in Figure 9.
Figure 9 Distribution of major surface rivers and subsurface culverts in Guizhou province, southwest China (after Xie et al., 1987; Han et al., 1996)
Overall, karst depressions in Guizhou are more concentrated in the Beipanjiang and Nanpanjiang river systems south of the Miaoling watershed and in the Hengjiang-Niulanjiang river system north of the Miaoling watershed and have a concentrated distribution in the upper reaches of the Wujiang River (Figures 4 and 9). In this work, 0.5-3.0 km surface river and subsurface river buffers were considered for overlay analysis, and the influence of hydrological conditions on the spatial distribution of depressions was explored by calculating the number and density of karst depressions within each buffer zone (with an interval of 0.5 km). The results showed (Figure 7c) that 18.25% of the karst depressions are located within 0.5 km of the surface rivers. There are 68,650 and 74,502 karst depressions within 0.5-1.5 km and 1.5-3.0 km of the surface rivers, accounting for 32.00% and 34.30% of the total number of depressions, respectively. In terms of increasing buffer zone distance, the number of depressions increased by 21,862 (8.53% of total number) in the 0.5-1.5 km buffer zone on both sides of surface rivers compared with the 0-0.5 km buffer zone on both sides of surface rivers, while the number of depressions increased by only 5852 (2.28% of total number) in the larger radius buffer zone (1.5-3.0 m), indicating that as the river buffer distance increases, the number of karst depressions developed shows a decreasing trend.
Surface water is an important source of groundwater recharge, and to some extent, surface rivers and underground rivers overlap each other. The subsurface rivers were obtained from the 1:500,000 hydrogeological map of Guizhou province and are far less numerous than the identified surface rivers. Therefore, the statistical results show (Figure 7d) that only 5726 depressions are distributed within the 0-0.5 km buffer zone of underground rivers, and 31,018 depressions are developed within the 3.0 km buffer zone of underground rivers, accounting for only 12.10% of the total depressions. Underground rivers, as important channels for the dissolution and erosion of basement rocks, continuously drive the formation and development of karst depressions. Figure 7d also shows that the depression density of karst depressions within the 0.5 km buffer zone of underground rivers is 1.65 km-2. With an increase in the buffer radius, the density is always less than 1.52 km-2 and tends toward a stable value between 1.40-1.50 km-2, indicating that the distance from underground rivers on the spatial distribution of karst depressions is limited but not negligible (Zhang et al., 2016).
The formation and development of karst depressions are controlled by lithology and tectonics, and as early as the beginning of the 20th century, many scholars believed that the formation of karst depressions is the integrated result of surface water and groundwater dissolution and erosion (Song, 1986). In the process of karst depression formation and evolution, the physicochemical properties, movement and runoff of water affect the development of karst depressions, while the abundant rainfall in Guizhou provides sufficient sources for the coupled transformation of the surface water network and underground water system, which provides good hydrodynamic conditions for depression-related dissolution and erosion. When the exposed bedrock blocks are destroyed by tectonic uplift and subsidence, the surface water network forms multiple drainage outlets (i.e., sinkholes) at the bottom of the depression, and the depression becomes an independent water collection unit. At this time, the waterfall holes at the bottom of the karst depressions quickly gather most of the surface water, which rapidly infiltrates the underground water system, while the underground drainage system forms pipes, fissures, pores and other forms of drainage channels. These conduits merge to form intricate underground rivers, providing sufficient groundwater runoff conditions and drainage conditions in the region and finally promoting the formation of karst depressions.

4.4 The complexity of the spatial distribution of karst depressions

In fact, the spatial distribution characteristics of karst depressions are the result of multiple factors. Although the effects of lithology, tectonics, and hydrology are explored in this work and are considered the three main controlling factors influencing the development of karst depressions in extensive references, the mechanism of karst depression formation and evolution in Guizhou province is undoubtedly more complex. For example, the hot, rainy, and humid modern and palaeoclimatic environments and history of variability also influence the dynamics and rate of bedrock dissolution (Zuo et al., 2012) and the thermal and moisture conditions necessary for biospheric carbon cycling, an important environmental condition for the formation of karst landscapes. The formation and evolution of a karst depression takes hundreds of thousands of years, and the karst depressions in Guizhou have mainly developed since the late Cenozoic (Li, 2001) through two interglacial periods, and their dissolution velocities are generally higher than those of other climatic regions in China. Additionally, topographic conditions are considered to be an important external factor influencing the vertical development of karst depressions (ÖZtÜRk, 2018). For example, different elevations make rainfall and temperature vary greatly in the vertical direction, which ultimately affects the dissolution rates of soluble rocks at different elevations. Furthermore, current studies generally agree that the density of depressions increases as the slope decreases (Gams, 2000).
In general, the formation of karst depressions is the result of complex interactions between strong dissolution, hydrodynamic processes, and geomorphologic evolution. Influencing factors include the geological setting (e.g., lithology, tectonic movements, neotectonic activity), hydrological conditions (e.g., hydrological evolution), geomorphology (e.g., elevation, slope), climate (e.g., interglacial, ice age) and other factors (e.g., vegetation, soil cover, human activities) related to karst depression development (Al-Kouri et al., 2013; Panno et al., 2013; Cahalan et al., 2018). Each factor has different fluctuations in time and space, and it is difficult to decipher the degree of influence of each factor on karst depression formation by direct observation or quantification. Ultimately, most karst depressions are formed by the synergistic effects of multiple influencing factors over a long period of time.

4.5 Limitations and deficiencies

Our basic assumption for the identification and extraction of karst depressions is that karst depressions are a subset of negative terrain. However, as described in Table 2, the topographic features of many negative terrain features are consistent with those of karst depressions. This study is based on 12.5 m DEM topographic data and adopts the contour tree method to extract karst depressions. The extraction results may include unnatural depressions or artificial negative landforms because these negative landforms may have similar topographic characteristics to karst depressions. It should be noted that the boundary of karst depressions is a relative concept, and most extraction methods have limitations (Meng, 2019). In this study, there is no single threshold that can obtain the best results in all cases due to the limitations of the DEM data and contour intervals. Therefore, it is necessary to use high-precision DEM data and carry out on-site surveys to confirm when a karst depression is used as the site for the construction of a reservoir.
In this study, we also discuss the effects of a series of geological environmental parameters on the distribution of karst depressions in karst areas of Guizhou province by quantitative methods. We have analysed the lithology, fault structure, surface drainage, groundwater movement characteristics, average annual rainfall, slope, and vegetation coverage, and these parameters are generally considered the main controlling factors for the development of karst depressions in a large number of studies (Song, 1986; Cahalan et al., 2018; Öztürk, 2018; Luo et al., 2021). However, other unexplored potential influencing factors may result in some limitations in accurately interpreting the development of the studied karst depressions. In addition, considering the extensive area involved in this study and the high dependence of the obtained potential influencing factors on the scale, the existing data limited our analysis. Therefore, future work should include more high-precision data or detailed analysis of the coupled relationship between the spatial distribution of karst depressions and geological environmental factors proposed in this study on a smaller regional scale.

5 Conclusion

Karst depressions not only play an important role in the scientific fields of geography, geology and ecology but also, because of the geometric and engineering characteristics of karst depressions as negative terrain (including less required excavation, better surrounding closure and large natural capacity), provide good site conditions for the engineering field. Therefore, this study provides a list of 256,370 karst depressions in a 150,900 km2 karst area in Guizhou province, with a total planar area of 6640.75 km2, accounting for 4.40% of the total province's karst area. The karst depressions in Guizhou exhibit a clustered distribution spatially. According to the kernel density value, the karst depressions developed in karst areas in Guizhou can be divided into five categories: type A, superconcentrated area; type B, concentrated area; type C, somewhat concentrated area; type D, weakly concentrated area; and type E, nonconcentrated area.
The quantitative analysis of the random forest model (RF) in this study shows that lithology and faults are the key internal factors affecting the spatial distribution of karst depressions, and average annual rainfall is the main external factor affecting the spatial distribution of karst depressions. Moreover, the main controlling factors of karst depression concentration areas are different. Lithology, rainfall and faults play the main controlling role in the more concentrated areas, while in the less concentrated areas, the development of karst depressions is the result of many controlling factors. Through superposition analysis and buffer analysis, it is also found that most of the karst depressions in Guizhou are developed in the stratigraphic lithology related to carbonate rocks, especially pure carbonate rocks (limestone, dolomite, and interbedded limestone and dolomite), which strongly control the spatial distribution of karst depressions. The number and density of karst depressions are negatively correlated with the distance from faults buffer distance, and the depressions are less developed with increasing distance from fault buffer distance. With the increase in the distance of the surface river buffer zone, the number of karst depressions shows a decreasing trend, while with the increase in the radius of the underground river buffer zone, the density of karst depressions tends to a stable value. This study analyses the main controlling factors affecting the development of karst depressions, which will help to understand the formation process and hydraulic conditions of karst depressions and then provide theoretical support for resource evaluation and engineering applications of karst depressions.
[1]
Al-Kouri, Omar, A’kif Al-Fugara et al., 2013. Geospatial modeling for sinkholes hazard map based on GIS &amp; RS data. Journal of Geographic Information System, 5(6): 584-592.

DOI

[2]
Avcıoğlu A, Görüm T, Akbaş A et al., 2022. Regional distribution and characteristics of major badland landscapes in Turkey. Catena, 218: 106562.

DOI

[3]
Basso A, Bruno E, Parise M et al., 2013. Morphometric analysis of sinkholes in a karst coastal area of southern Apulia (Italy). Environmental Earth Sciences, 70(6): 2545-2559.

DOI

[4]
Brock-Hon Amy, Kevin Hon et al., 2019. Geomorphic and geophysical evidence of a collapse origin for large sandstone depressions atop the western Cumberland Plateau in Tennessee. Geomorphology, 343: 168-182.

DOI

[5]
Cahalan M D, Milewski A M, 2018. Sinkhole formation mechanisms and geostatistical-based prediction analysis in a mantled karst terrain. Catena, 165: 333-344.

DOI

[6]
Chen F, Wu S, Cui P et al., 2021. Progress and prospects of applied research on physical geography and the living environment in China over the past 70 years (1949-2019). Journal of Geographical Sciences, 31(1): 3-45.

DOI

[7]
Chen H, 2016. Geomorphological and geoenvironmental approaches for evaluating karst terrain in Guizhou province, China[D]. Tokyo: University of Tokyo.

[8]
Chen S Y, Wang J X, 2017. Progress in research on tectonic uplift in Yunnan-Guizhou Plateau. Yunnan Geographic Environment Research, 29(3): 23-29. (in Chinese)

[9]
Čonč Š, Oliveira T, Portas R et al., 2022. Dolines and cats: Remote detection of karst depressions and their application to study wild felid ecology. Remote Sensing, 14(3): 656.

DOI

[10]
Cui G Y, 2021. Morphological characteristics and genetic mechanism of negative topography in large slab bridge-small sentinel corridor belt and Gejiu karst highland[D]. Kunming: Kunming University of Science and Technology. (in Chinese)

[11]
Deng Z, Lin Y S, Zhang M L et al., 1987. Analysis of controlling effects of structure on depressions and caves in Guilin. Carsologica Sinica, 6(2): 48-59. (in Chinese)

[12]
Ding Z Q, Gao X, Li Y H et al., 2019a. Regional characteristics and resource-environmental effects of karst depressions in Shilin county, China. Mountain Research, 37(3): 316-327. (in Chinese)

[13]
Ding Z Q, Yu X Y, Gao X et al., 2019b. Study on spatial distribution characteristics and influencing factors of karst depressions in Shilin county, Yunnan province. Carsologica Sinica, 38(3): 325-335. (in Chinese)

[14]
Doctor D H, Young J A, 2013. An evaluation of automated GIS tools for delineating karst sinkholes and closed depressions from 1-meter LiDAR-derived digital elevation data. In:Full Proceedings of the Thirteenth Multidisciplinary Conference on Sinkholes and the Engineering and Environmental Impacts of Karst. New Mexico.

[15]
Dong J Q, Peng J, Liu Y X et al., 2020. Integrating spatial continuous wavelet transform and kernel density estimation to identify ecological corridors in megacities. Landscape and Urban Planning, 199: 103815.

DOI

[16]
Gams I, 2000. Doline morphogenetic processes from global and local viewpoints. Acta Carsologica, 29(2): 123-138.

[17]
Gao F F, Liu H, Deng J W, 2012. Analysis on geological genesis of karst depression in Guizhou province. Subgrade Engineering, 165(6): 23-26. (in Chinese)

[18]
Gutiérrez F, Parise M, De Waele J et al., 2014. A review on natural and human-induced geohazards and impacts in karst. Earth-Science Reviews, 138: 61-88.

DOI

[19]
Han Z J, Jin Z S, 1996. Hydrological Geology Memoirs of Guizhou Province. Beijing: Seismological Press. (in Chinese)

[20]
He X Y, 2018. The values of the landscape of doline group in Yunnan Plateau and its tourism display[D]. Kunming: Yunnan Normal University. (in Chinese)

[21]
Jeanpert J, Genthon P, Maurizot P et al., 2016. Morphology and distribution of dolines on ultramafic rocks from airborne LiDAR data: The case of southern Grande Terre in New Caledonia (SW Pacific). Earth Surface Processes and Landforms, 41(13): 1854-1868.

DOI

[22]
Kim Y J, Nam B H, Jung Y H et al., 2022. Probabilistic spatial susceptibility modeling of carbonate karst sinkhole. Engineering Geology, 306: 106728.

DOI

[23]
Kranjc A, 2013. Classification of closed depressions in carbonate karst. Treatise on Geomorphology, 6: 104-111.

[24]
Li Z F, 2011. Division of karst landform in Guizhou. Guizhou Geology, 28(3): 177-181. (in Chinese)

[25]
Li X Z, 2001. Evolution of karst geomorphology of upper-Cenozoic and its influential factors in Guizhou Plateau. Guizhou Geology, 18(1): 29-36. (in Chinese)

[26]
Lindsay J B, 2014. The whitebox geospatial analysis tools project and open-access GIS. In:Proceedings of the GIS Research UK 22nd Annual Conference. Glasgow: The University of Glasgow.

[27]
Liu R, Shi S, X Sun D L et al., 2020. Based on GIS and random forest model for landslide susceptibility mapping in Wushan county. Journal of Chongqing Normal University (Natural Science), 37(3): 86-96. (in Chinese)

[28]
Luo S W, Lv Y, Wu K H et al., 2021. Formation mechanism of the spatial distribution of Mesozoic strata in Guilin peak-forest plain and peak-cluster depression. Carsologica Sinica, 40(5): 805-814. (in Chinese)

[29]
Maepa F M, Smith R S, 2020. Examining the controls on gold deposit distribution in the Swayze greenstone belt, Ontario, Canada, using multi-scale methods of spatial data analysis. Ore Geology Reviews, 125: 103671.

DOI

[30]
Meng X, 2019. Extraction and morphological characteristics analysis of karst depression in fengcong area based on DEMs[D]. Nanjing: Nanjing Normal University. (in Chinese)

[31]
Miao X, Qiu X M, Wu S S et al., 2013. Developing efficient procedures for automated sinkhole extraction from Lidar DEMs. Photogrammetric Engineering & Remote Sensing, 79(6): 545-554.

[32]
Mo Y S, Suo H Y, Jiao S L et al., 2021. Comparison of spatial interpolation methods of precipitation: A case of karst area in Guizhou province. Research of Soil and Water Conservation, 28(1): 164-170. (in Chinese)

[33]
Öztürk M Z, 2018. Karstik kapalı depresyonların (dolinlerin) morfometrik analizleri. Coğrafya Dergisi, 36: 1-13.

[34]
Öztürk M Z, Şener M F, Şener M et al., 2018. Structural controls on distribution of dolines on Mount Anamas (Taurus Mountains, Turkey). Geomorphology, 317: 107-116.

DOI

[35]
Panno S V, Kelly W R, Angel J C et al., 2013. Hydrogeologic and topographic controls on evolution of karst features in Illinois’ sinkhole plain. Carbonates and Evaporites, 28(1/2): 13-21.

DOI

[36]
Pardo-Igúzquiza E, Dowd P A, 2021. The mapping of closed depressions and its contribution to the geodiversity inventory. International Journal of Geoheritage and Parks, 9(4): 480-495.

DOI

[37]
Pardo-Igúzquiza E, Dowd P A, Telbisz T, 2020. On the size-distribution of solution dolines in carbonate karst: Lognormal or power model? Geomorphology, 351: 106972.

DOI

[38]
Peng C, 2020. Karst topography study in Weining county, Guizhou province. Inner Mongolia Coal Economy, 312(19): 203-204. (in Chinese)

[39]
Peng Y A N, Nong Y, Ye B Y, 2011. The extraction and study of geomorphic surface in Guizhou and its adjacent areas based on ASTER-GDEM. Remote Sensing for Natural Resources, 23(2): 98-103.

[40]
Qin Z Y, Gan F L, He B H, 2020. Influence of strata tendency on the surface/underground runoff production process in typical karst valley. Journal of Soil and Water Conservation, 34(5): 68-75. (in Chinese)

[41]
Rogeau A, Girard R, Kariniotakis G, 2017. A generic GIS-based method for small Pumped Hydro Energy Storage (PHES) potential evaluation at large scale. Applied Energy, 197: 241-253.

DOI

[42]
Šegina E, Benac Č, Rubinić J et al., 2018. Morphometric analyses of dolines: The problem of delineation and calculation of basic parameters. Acta Carsologica, 47(1): 23-33.

[43]
Shaw-Faulkner M G, Stafford K W, Bryant A W, 2013. Delineation and classification of karst depressions using LiDAR: Fort hood military installation, Texas. In:Full Proceedings of the Thirteenth Multidisciplinary Conference on Sinkholes and the Engineering and Environmental Impacts of Karst, New Mexico.

[44]
Shui W, Chen Y P, Wang Y W et al., 2015. Origination, study progress and prospect of karst tiankeng research in China. Acta Geographica Sinica, 70(3): 431-446. (in Chinese)

DOI

[45]
Song J B, Liu H, Wang W J et al., 2005. Methods of selecting site for square kilometre array in karst region of Guizhou, China. Earth and Environment, 33(3): 63-68. (in Chinese)

[46]
Song J B, Liu H, Wang W J et al., 2006. Theory and Method of Site Selection of Large Radio Telescope in Guizhou. Beijing: Geological Publishing House. (in Chinese)

[47]
Song L H, 1986. Mechanism of karst depression evolution and its hydrogeological significance. Acta Geographica Sinica, 41(1): 41-50. (in Chinese)

DOI

[48]
Tan Y, Li L, Huang B, 2021. Contrasting characteristics and origin of Danxia arched rock shelters in Zhejiang, China, and natural arches and bridges on the Colorado Plateau, USA. Journal of Geographical Sciences, 31(6): 802-818.

DOI

[49]
Theilen-Willige B, 2018. Detection of karst features in the Black hills area in south Dakota/Wyoming, USA, based on evaluations of remote sensing data. Geosciences, 8(6): 192.

DOI

[50]
Wang C, Kan A K, ZengY L et al., 2019. Population distribution pattern and influencing factors in Tibet based on random forest model. Acta Geographica Sinica, 74(4): 664-680. (in Chinese)

DOI

[51]
Wang H S, Xiong K N, Zhang F M et al., 2014. Evolution mechanism of dolomite karst peak cluster-canyon landform: A genesis view on Huanjiang, Guangxi. Tropical Geography, 34(5): 672-680. (in Chinese)

[52]
Wang M Z, 2015. Groundwater and Geological Environment in Karst Area of Guizhou Province. Beijing: Geological Publishing House.

[53]
Wang S, Wu Q, Ward D, 2017. Automated delineation and characterization of drumlins using a localized contour tree approach. International Journal of Applied Earth Observation and Geoinformation, 62: 144-156.

DOI

[54]
Wang S J, Li R L, Sun C X et al., 2004. How types of carbonate rock assemblages constrain the distribution of karst rocky desertified land in Guizhou province, PR China: Phenomena and mechanisms. Land Degradation & Development, 15(2): 123-131.

DOI

[55]
Williams P W, 1972. Morphometric analysis of polygonal karst in New Guinea. Geological Society of America Bulletin, 83(3): 761-796.

DOI

[56]
Wu J J, Chen S W, Zheng K X et al., 2023. Monitoring methodology study of a reservoir built on the karst depression: A large scale laboratory simulation test. ACS Omega, 8(16): 14520-14530.

DOI PMID

[57]
Wu K, Wang Y, Zhang H et al., 2022. The pattern, evolution, and mechanism of venture capital flows in the Guangdong-Hong Kong-Macao Greater Bay Area, China. Journal of Geographical Sciences, 32(10): 2085-2104.

DOI

[58]
Wu Q, Deng C, Chen Z, 2016. Automated delineation of karst sinkholes from LiDAR-derived digital elevation models. Geomorphology, 266: 1-10.

DOI

[59]
Xie J B, Wang K X, Han B Z, 1987. Regional Geology of Guizhou Province. Beijing: Geological Publishing House. (in Chinese)

[60]
Xie Y, Zhang L, Gong X et al., 2022. Empirical study of the coupling relationship between biodiversity and environmental geology under different ecological status: Evidence from five typical areas in Guizhou, China. Environmental Science and Pollution Research, 29(34): 51398-51410.

DOI

[61]
Xu H, Jia A, Song X et al., 2023. Extraction and spatiotemporal evolution analysis of tidal flats in the Bohai Rim during 1984-2019 based on remote sensing. Journal of Geographical Sciences, 33(1): 76-98.

DOI

[62]
Xu J W, Fang S M, Huang R H, 2017. A study of spatial morphological characteristics and genesis of peak-cluster depressions of the qibailong national geopark in Guangxi. Acta Geoscientica Sinica, 38(6): 961-970. (in Chinese)

[63]
Xu K J, Li X Z, Liu J Q, 2008. Features of karst landscape at Xingyi, Guizhou. Carsologica Sinica, 27(2): 157-164. (in Chinese)

[64]
Xu X, 2016. Algorithm research of watershed analysis without filling depression based on grid DEM[D]. Nanchang: Jiangxi University of Science and Technology. (in Chinese)

[65]
Yan L, Peng H, Zhang S et al., 2019. The spatial patterns of red beds and Danxia landforms: Implication for the formation factors-China. Scientific Reports, 9(1): 1961.

DOI PMID

[66]
Yan L H, Zhou Z F, Huang D H et al., 2018. Geomorphic information extraction of the karst peak cluster-depression based on Landsat 8. Science Technology and Engineering, 18(28): 182-188. (in Chinese)

[67]
Yang X W, 2019. DEM based research on the topographic characteristics and spatial variation of fenglin and fengcong karst landforms[D]. Nanjing: Nanjing Normal University. (in Chinese)

[68]
Yang Y N, Mo X, Zhang L M et al., 2020. Karstic conduits and watershed identification based on the morphological characteristics of depressions in the Yunnan-Guizhou Plateau of China. Environmental Earth Sciences, 79(10): 1-12.

DOI

[69]
Yao Y H, 2009. Efect of tectonic lineaments on valley/depression landscape pattern in karst region. Journal of Geo-information Science, 11(6): 759-764. (in Chinese)

DOI

[70]
Yuan D X, 2016. Modern Karstology. Beijing: Science Press. (in Chinese)

[71]
Zhang S Y, Zhou Z F, Xiong K N et al., 2016. Spatial pattern of the caves in Guizhou province and their influencing factors. Acta Geographica Sinica, 71(11): 1998-2009. (in Chinese)

[72]
Zhang Z, Huang X, Zhou Y et al., 2019. Discrepancies in karst soil organic carbon in southwest china for different land use patterns: A case study of Guizhou province. International Journal of Environmental Research and Public Health, 16(21): 4199.

DOI

[73]
Zhao X, Zhang Q, He G et al., 2021. Delineating pollution threat intensity from onshore industries to coastal wetlands in the Bohai Rim, the Yangtze River Delta, and the Pearl River Delta, China. Journal of Cleaner Production, 320: 128880.

DOI

[74]
Zhao Y, Zhang B, He Y et al., 2022. Influence of geological conditions on gully distribution in the dry-hot valley, SW China. Catena, 214: 106274.

DOI

[75]
Zhou X F, Zhou Y Z, Ouyang J, 2012. Settlement spatial distribution in karst plateau basin: Take the basin of hongfeng lake in Guizhou province as a case. Areal Research and Development, 31(3): 145-150. (in Chinese)

[76]
Zhou Z, Zhang S, Xiong K et al., 2017. The spatial distribution and factors affecting karst cave development in Guizhou province. Journal of Geographical Sciences, 27(8): 1011-1024.

DOI

[77]
Zumpano V, Pisano L, Parise M, 2019. An integrated framework to identify and analyze karst sinkholes. Geomorphology, 332: 213-225.

DOI

[78]
Zuo J H, Luo Q, Guo X M, 2012. Some influences of the three major steps of landforms on karst development in China: A case study of karst area in southwest China. Science & Technology Information, (18): 210-211, 213. (in Chinese)

Outlines

/