
Journal of Geographical Sciences >
Spatio-temporal pattern and attribution analysis of the mass elevation effect in the Tianshan Mountains in China
|
Zhang Mingyu (1999-), Master Candidate, specialized in the research of mountain climate change and ecological environment research. E-mail: zmy_zz1015@163.com |
Received date: 2023-07-15
Accepted date: 2023-08-20
Online published: 2023-10-08
Supported by
National Natural Science Foundation of China(41761108)
The mass elevation effect (MEE) is a thermal effect, in which heating produced by long wave radiation on a mountain surface generates atmospheric uplift, which has a profound impact on the hydrothermal conditions and natural geographical processes in mountainous areas. Based on multi-source remote sensing data and field observations, a spatial downscaling inversion of temperature in the Tianshan Mountains in China was conducted, and the MEE was estimated and a spatio-temporal analysis was conducted. The GeoDetector model (GDM) and a geographically weighted regression (GWR) model were applied to explore the spatial and temporal heterogeneity of the study area. Four key results can be obtained. (1) The temperature pattern is complex and diverse, and the overall temperature presented a pattern of high in the south and east, but low in the north and west. There were clear zonal features of temperature that were negatively correlated with altitude, and the temperature difference between the internal and external areas of the mountains. (2) The warming effect of mountains was prominent, and the temperature at the same altitude increased in steps from west to east and north to south. Geomorphological units, such as large valleys and intermontane basins, weakened the latitudinal zonality and altitudinal dependence of temperature at the same altitude, with the warming effect of mountains in the southern Tianshan Mountains. (3) The dominant factors affecting the overall pattern of the MEE were topography and location, among which the difference between the internal and external areas of the mountains, and the absolute elevation played a prominent role. The interaction between factors had a greater influence on the spatial differentiation of mountain effects than single factors, and there was a strong interaction between terrain and climate, precipitation, the normalized difference vegetation index (NDVI), and other factors. (4) There was a spatial heterogeneity in the direction and intensity of the spatial variation of the MEE. Absolute elevation was significantly positively correlated with the change of MEE, while precipitation and the NDVI were dominated by negative feedback. In general, topography had the largest effect on the macroscopic control of MEE, and coupled with precipitation, the underlying surface, and other factors to form a unique mountain circulation system and climate characteristics, which in turn enhanced the spatial and temporal heterogeneity of the MEE. The results of this study will be useful in the further analysis of the causes of MEE and its ecological effects.
Key words: mass elevation effect; spatial downscaling; GeoDetector; GWR; Tianshan Mountains
ZHANG Mingyu , ZHANG Zhengyong , LIU Lin , ZHANG Xueying , KANG Ziwei , CHEN Hongjin , GAO Yu , WANG Tongxia , YU Fengchen . Spatio-temporal pattern and attribution analysis of the mass elevation effect in the Tianshan Mountains in China[J]. Journal of Geographical Sciences, 2023 , 33(10) : 2031 -2051 . DOI: 10.1007/s11442-023-2164-0
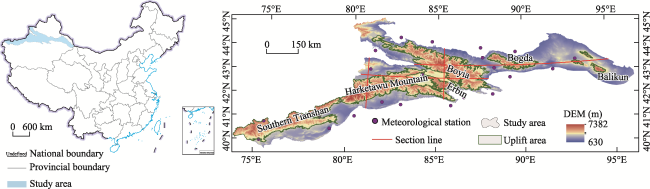
Figure 1 Overview of the Tianshan Mountains in China |
Table 1 Terrain parameters used in a temperature inversion |
| Topographic Factors | Description | Method/Formula |
|---|---|---|
| Elevation | Mountain uplift degree | Acquired from DEM data |
| Slope | Degree of surface tilt | Obtained using the ArcGIS slope tool |
| Aspect | Terrain slope orientation | $\text{Trasp}=1-\cos \left[ \pi \left( aspect-20 \right)/180 \right]$ |
| Terrain index | Synthesis of spatially differentiated features of the terrain | T=$\text{log}\left[ \left( \frac{E}{{\bar{E}}}+1 \right)\times \left( \frac{S}{{\bar{S}}}+1 \right) \right]$ |
| Terrain roughness | Ground roughness | $R=1/\cos (s)$ |
| Internal and external degree | Distance from the edge of large terrain | ArcGIS distance analysis |
Note: Trasp is the slope conversion index, aspect is the slope direction; T is the terrain index, E and$\bar{E}$represent elevation and mean elevation, respectively; S and$\bar{S}$represent slope and mean slope, respectively; R is the terrain roughness. |
Table 2 Factors influencing the spatial differentiation of the MEE in the Tianshan Mountains |
| Factor type | Topographic and locational factors | Climate factor | Underlying surface properties | |||||
|---|---|---|---|---|---|---|---|---|
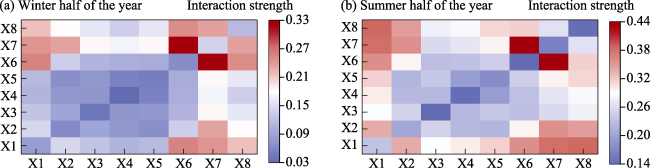
| Specific indicators | Slope (X1) | Aspect (X2) | Internal and external degree (X3) | Terrain index (X4) | Terrain roughness (X5) | Absolute elevation (X6) | Precipitation (X7) | NDVI (X8) |
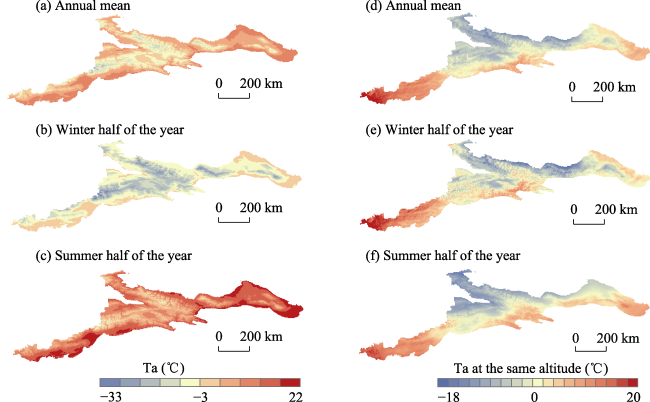
Figure 2 Spatial distribution of the annual, and summer and winter halves of year mean air temperatures (Ta) in the Tianshan Mountains |
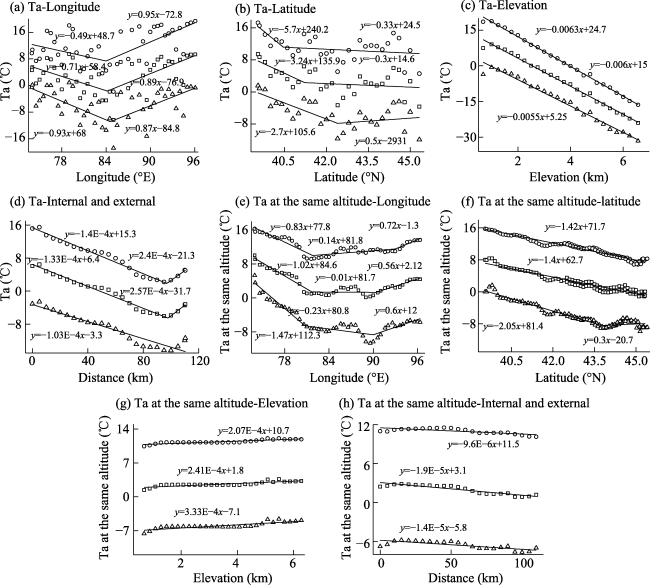
Figure 3 The variation of air temperature (Ta) and actual air temperature at the same altitude in the Tianshan Mountains |
Table 3 Statistics on the distribution of temperature at the same altitude in each uplift block in the Tianshan Mountains |
| Uplift block | Mean altitude (m) | Summer half of the year | Winter half of the year | ||
|---|---|---|---|---|---|
| Mean Ta (℃) | Difference with mean Ta at the same latitude (℃) | Mean Ta (℃) | Difference with mean Ta at the same latitude (℃) | ||
| Southern Tianshan uplift block | 3189 | 14.49 | 0.85 | -0.70 | 1.72 |
| Harketawu uplift block | 3311 | 11.08 | -0.31 | -6.19 | 0.10 |
| Erbin uplift block | 3494 | 12.34 | 0.86 | -5.04 | 1.33 |
| Boyia uplift block | 3135 | 10.80 | 0.29 | -7.01 | 0.46 |
| Bogda uplift block | 3080 | 11.57 | 1.32 | -9.81 | -1.48 |
| Balikun uplift block | 3473 | 13.37 | 2.94 | -6.64 | 1.21 |
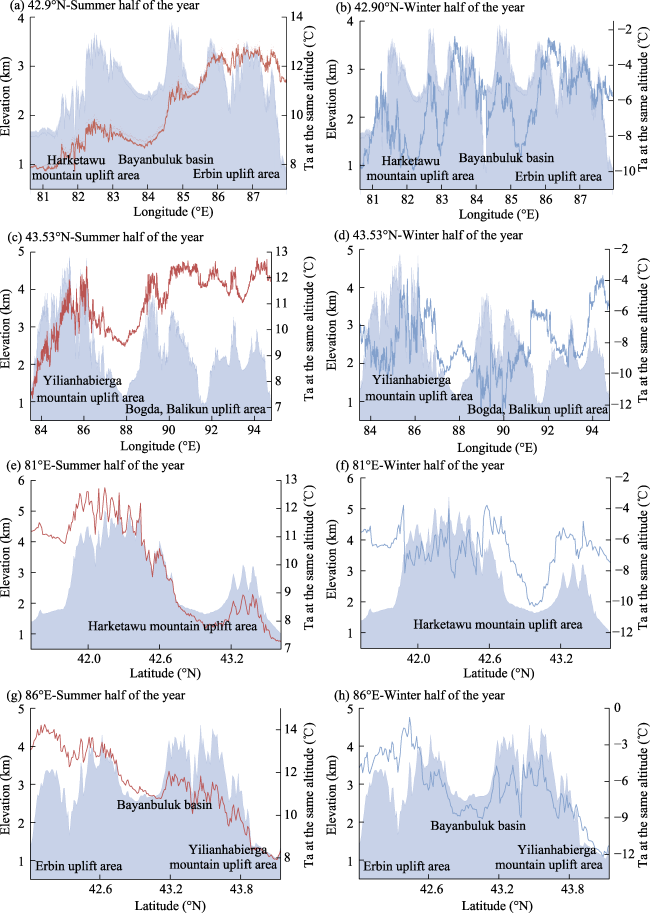
Figure 4 The temperature profile at the same altitude for different regions of the Tianshan Mountains |
Figure 5 The results of an interaction detection showing the spatial differentiation of the drivers of temperature at the same altitude in the Tianshan Mountains |
Table 4 Statistical details of the main driving factors in the uplift blocks in the Tianshan Mountains |
| Period | Summer half of the year | Winter half of the year | ||||||
|---|---|---|---|---|---|---|---|---|
| Driving factors | Internal and external degree | Absolute elevation | Precipitation | NDVI | Internal and external degree | Absolute elevation | Precipitation | NDVI |
| Tianshan Mountains | 3.82 | 11.90 | -7.73 | -0.47 | -2.99 | 6.39 | -11.26 | -0.72 |
| Southern Tianshan uplift block | 15.01 | -11.56 | 13.76 | -0.79 | 0.21 | 2.71 | 0.38 | -0.35 |
| Harketawu uplift block | 0.93 | 10.34 | -8.21 | -2.25 | -2.93 | 3.02 | -6.61 | -0.59 |
| Erbinin uplift block | -1.21 | 26.16 | -17.58 | -0.48 | -5.15 | 11.90 | -11.63 | 0.12 |
| Boyia uplift block | -0.25 | 21.76 | -13.59 | 0.43 | -2.60 | 12.22 | -15.22 | 1.21 |
| Bogda uplift block | 1.46 | 23.34 | -17.45 | -0.06 | -3.59 | 5.19 | -22.15 | -2.50 |
| Balikun uplift block | 2.99 | 22.72 | -21.31 | -0.15 | -4.22 | 5.93 | -25.28 | -3.74 |
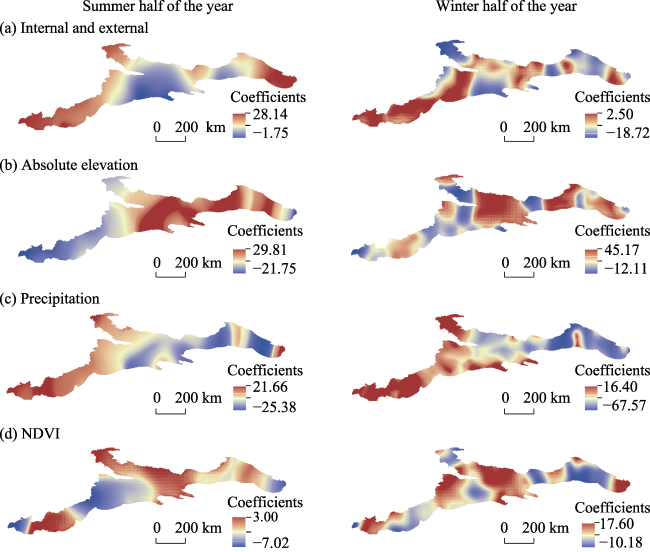
Figure 6 The impact of the main driving factors on the spatial differentiation of temperature patterns at the same altitude in the Tianshan Mountains |
| [1] |
|
| [2] |
|
| [3] |
|
| [4] |
|
| [5] |
|
| [6] |
|
| [7] |
|
| [8] |
|
| [9] |
|
| [10] |
|
| [11] |
|
| [12] |
|
| [13] |
|
| [14] |
|
| [15] |
|
| [16] |
|
| [17] |
|
| [18] |
|
| [19] |
|
| [20] |
|
| [21] |
|
| [22] |
|
| [23] |
|
| [24] |
|
| [25] |
|
| [26] |
|
| [27] |
|
| [28] |
|
| [29] |
|
| [30] |
|
| [31] |
|
| [32] |
|
| [33] |
|
| [34] |
|
| [35] |
|
| [36] |
|
| [37] |
|
| [38] |
|
| [39] |
|
| [40] |
|
| [41] |
|
| [42] |
|
| [43] |
|
| [44] |
|
| [45] |
|
| [46] |
|
| [47] |
|
| [48] |
|
| [49] |
|
| [50] |
|
| [51] |
|
| [52] |
|
| [53] |
|
| [54] |
|
| [55] |
|
| [56] |
|
| [57] |
|
| [58] |
|
| [59] |
|
/
| 〈 |
|
〉 |