Research Articles

Hedging effect alleviates the impact of land use on mainstream hydrological regimes: Evidence from Jinsha River, China

  • GAO Wei , 1 ,
  • LIU Yong 2 ,
  • DU Zhanpeng 3 ,
  • ZHANG Yuan 1 ,
  • CHENG Guowei , 4, * ,
  • HOU Xikang 5
Expand
  • 1. Guangdong Provincial Key Laboratory of Water Quality Improvement and Ecological Restoration for Watersheds, Institute of Environmental and Ecological Engineering, Guangdong University of Technology, Guangzhou 510006, China
  • 2. College of Environmental Science and Engineering, Key Laboratory of Water and Sediment Sciences (MOE), Peking University, Beijing 100871, China
  • 3. Yunnan Research Academy of Eco-environmental Sciences, Kunming 650091, China
  • 4. Institute of International Rivers and Eco-security, Yunnan Key Laboratory of International Rivers and Transboundary Eco-security, Yunnan University, Kunming 650091, China
  • 5. State Key Laboratory of Environment Criteria and Risk Assessment, Chinese Research Academy of Environmental Sciences, Beijing 100012, China
*Cheng Guowei (1995-), PhD, specialized in the water environment simulation and assessment. E-mail:

Gao Wei (1986-), PhD and Associate Professor, specialized in the simulation of watershed environmental processes. E-mail:

Received date: 2022-09-07

  Accepted date: 2023-05-29

  Online published: 2023-10-08

Supported by

National Key Research and Development Program of China(2021YFC3201004)

Abstract

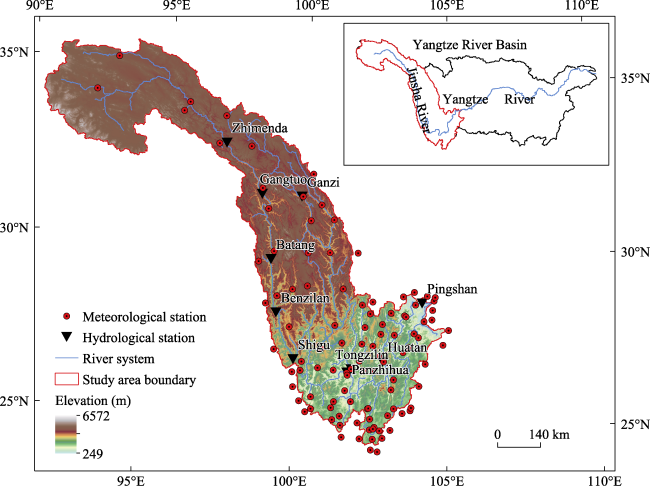
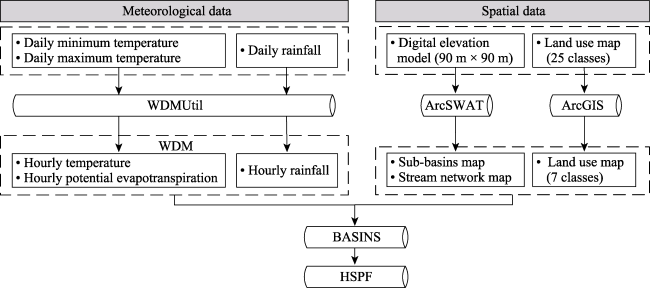
Global extreme hydrological events pose considerable challenges to the sustainable development of human society and river ecology. Land use/cover change (LUCC) is a visible manifestation of human activity and has caused substantial alterations in extreme hydrological regimes across rivers worldwide. The Jinsha River lies upstream of the Yangtze River and its hydrological variability has had profound socioeconomic and environmental effects. In this study, we developed Hydrological Simulation Program-FORTRAN (HSPF) and land-use simulation models of the entire watershed to simulate the effects of LUCC on hydrological extremes and quantify the inter-relationships among them. The main land-use changes between 1995 and 2015 were those associated with cropland, forest land, and grassland. Between 2015 and 2030, it is estimated that the coverage of forest land, grassland, construction land, and unused land will increase by 0.64%, 0.18%, 69.38%, and 45.08%, respectively, whereas that of cropland, water bodies, and snow- and ice-covered areas will decline by 8.02%, 2.63%, and 0.89%, respectively. LUCC has had irregular effects on different hydrological regimes and has most severely altered stream flows. The responses of hydrological extremes to historical land-use change were characterized by spatial variation. Extreme low flows increased by 0.54%-0.59% whereas extreme high flows increased by 0%-0.08% at the lowest outlet. Responses to future land-use change will be amplified by a 0.72%-0.90% reduction in extreme low flows and a 0.08%-0.12% increase in extreme high flows. The hedging effect caused by irregular changes in tributary stream flow was found to alleviate the observed flow in mainstream rivers caused by land-use change. The extreme hydrological regimes were affected mainly by the net swap area transferred from ice and snow area to forest (NSAIF) and thereafter to cultivated land (NSAIC). Extreme low flows were found to be positively correlated with NSAIF and NSAIC, whereas extreme high flows were positively correlated with NSAIC and negatively correlated with NSAIF.

Cite this article

GAO Wei , LIU Yong , DU Zhanpeng , ZHANG Yuan , CHENG Guowei , HOU Xikang . Hedging effect alleviates the impact of land use on mainstream hydrological regimes: Evidence from Jinsha River, China[J]. Journal of Geographical Sciences, 2023 , 33(10) : 2011 -2030 . DOI: 10.1007/s11442-023-2163-1

1 Introduction

Extreme hydrological events are critical processes in the Earth's hydrological cycles, the frequency and intensity of which have increased in recent years, thereby significantly constraining sustainable socioeconomic and ecological development (Chou et al., 2013; Allahbakhshian-Farsani et al., 2020). The spatiotemporal distribution of extreme hydrological events is highly variable and unpredictable and is influenced mainly by climate change and human activity (Wang et al., 2020). Climate change contributes to altering the total amount of water resources available via its effects on air temperature, precipitation, evaporation, and other factors (Sood and Smakhtin, 2015). Land use/cover change (LUCC) is the most direct expression of the influence of human activity on the physical environment (Gashaw et al., 2018). It regulates the relationship between climatic conditions and runoff by altering evapotranspiration, interception by vegetation, and surface water infiltration (Tsarouchi and Buytaert, 2018; Aragaw et al., 2021). LUCC can either enhance or weaken the impact of climate change on hydrological extremes under the same temperature and precipitation scenarios, and is a primary contributor to interannual variability in hydrological extremes (Yang et al., 2012; Mason et al., 2021). However, recent studies have focused mainly on the effects of climate change alone and neglected the roles of LUCC in regulating extreme hydrological regimes (Yang et al., 2016). Consequently, it is essential to identify and predict the extreme hydrological effects of LUCC in order to guide and facilitate regional land-use planning, optimize regional water resource allocation, and sustainably develop watersheds.
The effects of LUCC and climate changes on hydrological processes are characterized by mutual interactions, and consequently, quantifying their individual contributions to hydrological variation in large rivers present notable challenges (Li et al., 2013). Currently, statistical and watershed models are used to assess the impacts of LUCC on hydrological extremes in rivers, the latter of which can be used to distinguish the effects of LUCC from those of climate change. In recent decades, the methodology used to assess the hydrological effects of land-use change has undergone a transition from conventional statistical to watershed modeling techniques, which was initiated with the strategy originally adopted by Onstad (Onstad and Jamieson, 1970). Hydrological effects of different types of land-use change have hedging or superposition effects. For example, the conversion of forest land and grassland to construction and unused land can cause either increases or reductions in runoff (Jacobson, 2011; Wagner et al., 2016; Tigabu et al., 2019). Extreme hydrology is an exaggerated form of river hydrology. Most of the studies conducted to date have tended to be based on historical land-use information and have applied watershed modeling to simulate the associations between certain land-use changes and extreme hydrological regimes (Fonseca et al., 2018; Shen et al., 2021). The watershed models adopted include SWAT (Soil and Water Assessment Tool), HSPF (Hydrological Simulation Program-FORTRAN), and others. The response sensitivities to land-use change differ among extreme hydrological indices. In the future, it is predicted that LUCC in the Yangtze River Delta will result in a 70.52% annual increase in the 5-day maximum flow, which will be 14-fold larger than the annual 1-day maximum flow (Wang et al., 2020). Although most of the research conducted to date has focused on the impact of LUCC on a single maximum or minimum flow index (Zope et al., 2016; Fan et al., 2021), these assessments have not fully expressed the links between LUCC and hydrological extremes. Furthermore, changes in the hydrological extremes at river outlets are the outcomes of the comprehensive events in their entire catchment areas, and there have been few studies that have taken into consideration the spatial variabilities of extreme hydrological responses to LUCC (Wang et al., 2021).
The Jinsha River is located upstream of the Yangtze River, the maximum and minimum flows of which have been characterized as showing upward trends in recent years (Guo et al., 2018). Notably, it has been established that human activity has contributed 28%-87% to the total variability in this river's runoff (Liu et al., 2017). Although Chen et al. (2019a) analyzed the impact of LUCC on hydrological extremes at the outlet of the Jinsha River Watershed, they nevertheless failed to take into consideration the interactions of certain sub-basins and extreme hydrological changes under future LUCC scenarios.
LUCC and the hydrological regimes in the Jinsha River Watershed have undergone substantial changes in response to an intensification of anthropogenic activity, and mitigation of changes in the extreme hydrological conditions in this watershed has had profound socioeconomic and ecological effects on the Yangtze River Basin as a whole. In this study, we sought to analyze the characteristics of historical (1995-2015) and future (2015-2030) LUCC in the Jinsha River Watershed. We developed a high-resolution HSPF hydrological model for this watershed based on meteorological and natural geographical data, and simulated hydrological extremes and their regional disparity under historical and future LUCC scenarios. In addition, using a multiple linear regression model, we quantified the associations between LUCC and extreme hydrological conditions. The findings of this study will provide references for future water resource management and land-use planning in the Jinsha River Watershed.

2 Materials and methods

2.1 Study area

The Jinsha River, which has a total length of 2316 km, is located in southwest China upstream of the Yangtze River (90°-105°E and 24°-36°N). The watershed drains a total area of approximately 0.47 million km2 and accounts for 26.28% of the entire Yangtze River Basin (Figure 1). The Jinsha, whose main sources of replenishment are precipitation and ice-snow meltwater, provides an abundant supply of water and energy resources, particularly along its mainstream section. Its theoretical water energy resource reserves account for approximately one-sixth of the total area in China. The river's average annual flow is approximately 149.80 billion m3 yr-1, which accounts for 14.89% of the entire Yangtze River Basin. Tributaries of the watershed include the Pudu, Niulan, and Yalong rivers, which have average annual flows of 3.52, 4.79, and 57.08 billion m3 yr-1, respectively (Cheng et al., 2020).
Figure 1 Location of the Jinsha River Watershed and the distribution of gauging stations
The climate of the study area is complex and diverse, with annual precipitation and annual mean temperature of 636.68 mm and 2.41℃, respectively. In recent years, there has been a significant trend of temperature increase, as well as a wet and dry polarization of annual precipitation, both of which have been influenced by human activity (Cheng et al., 2022). The regional topography is complex and includes the Qinghai-Tibet, West Sichuan, and Yunnan-Guizhou plateaus, the Sichuan Basin, and the Hengduan and Western Sichuan Mountains, and within this area, the elevation of the Jinsha River Watershed ranges from 249 to 6572 m. In response to the rapid socioeconomic development in the region since the 1990s, land use within the Jinsha River Watershed has undergone substantial changes. As of 2015, the areas of cultivated land, forest land, grassland, water bodies, construction land, and unused land accounted for 26.86%, 41.72%, 23.32%, 2.83%, 2.14%, and 3.13% of the total Yangtze River Basin's land area, respectively.

2.2 Data description

For the purposes of the present study, we used two datasets. One dataset, obtained from the China Geospatial Data Cloud (http://www.gscloud.cn/), was based on simulation of the daily natural runoff between 1980 and 2017 and included a 30-m digital elevation model (DEM) required for watershed subdivision. LUCC data for 1995 and 2015, with a spatial resolution of 300 m, were derived from the European Space Agency Global Land Cover Dataset (https://www.esa-landcover-cci.org/?q=node/164). Daily precipitation data for 1958 to 2017, with a spatial resolution of 0.1°, were derived from the China Meteorological Forcing Dataset provided by the National Tibetan Plateau Data Center (http://data.tpdc.ac.cn/zh-hans/). Daily maximum and minimum air temperature data for 1958 to 2017 were obtained from the National Meteorological Information Center (https://www.nmic.gov.cn/), and daily flow data for 2007 to 2015 were obtained from the Hydrological Yearbook of the People's Republic of China-Hydrological Data of Yangtze River Basin. The other dataset was used to simulate LUCC in 2030 and included LUCC data for 2006 and 2018 at a spatial resolution of 300 m. Population, economy, and administration cell data were obtained from the Resource and Environment Science and Data Cloud Center of China (http://www.resdc.cn/Default.aspx), and protection zone, lake, and reservoir data were obtained from the National Tibetan Plateau Data Center (https://data.tpdc.ac.cn/zh-hans/) and the International Union for the Conservation of Nature (https://www.iucn.org/).

2.3 Methods

2.3.1 Land-use change

The net change in land use reflects the area of change for different land-use types during a given period (Liu et al., 2019). However, this does not accurately reflect the impact of land-use transformation on hydrological extremes. For example, grassland can undergo conversion to impervious ground, or alternatively, it may be converted to highly permeable forest land (Abou Rafee et al., 2021). Consequently, in the present study, we introduced the concept of the net swap of land use to analyze the responses of hydrological extremes to land-use change based on a land-use transfer matrix (Pontius et al., 2004).
The land-use transfer matrix comprehensively explains mutual conversions among different land-use types, and depicts the transformations of land-use function and structure driven by anthropogenic activity during a certain period of time (Duan et al., 2021). Calculations were performed using the Intersect function in ArcGIS v. 10.2 [Environmental Systems Research Institute (ESRI), Redlands, CA, USA] as follows (Huang et al., 2021):
${{S}_{ij}}=\left| \begin{matrix} {{S}_{11}} & {{S}_{12}} & \cdots & {{S}_{1n}} \\ {{S}_{21}} & {{S}_{22}} & \cdots & {{S}_{2n}} \\ \cdots & \cdots & \cdots & \cdots \\ {{S}_{n1}} & {{S}_{n2}} & \cdots & {{S}_{nn}} \\ \end{matrix} \right|$
where Sij is the area (km2) converted from type i to type j; i and j are the specific land-use types at the start and end of each study period; and n is the number of land-use types.
The net swap of land use NCij is the difference between Sij and Sji, which is calculated as follows:
$N{{S}_{ij}}={{S}_{ij}}-{{S}_{ji}}$
$N{{S}_{ji}}=-N{{S}_{ij}}$

2.3.2 HSPF model

The HSPF model, which was developed almost 30 years ago by the United States Environmental Protection Agency (USEPA), is a semi-distributed and continuous model that is used in watershed hydrology and water quality assessments. Since its development, the model has undergone continuous structural and functional modifications and is currently widely implemented in water environment management. Hydrological computations are conducted in three discrete parts, namely, pervious land (PERLND), impervious land (IMPLND), and reach or mixed reservoir (RCHRES). The model can be used to simulate hydrological progress in surface runoff, as well as interflow and underground runoff, and requires only short run times, during which it can accurately simulate the hydrological effects of land-use change (Chen et al., 2019b).
The components of the HSPF model applied in the present study included sub-catchment delineation, channel network extraction, Watershed Data Management (WDM) database creation, and hydrological response unit division. The model input included spatial (DEM, LUCC) and meteorological (daily precipitation; daily maximum and minimum air temperatures) data, and the main modeling steps are described below and shown in Figure 2.
Figure 2 Overall process flow of the HSPF model
(1) In this study, we referred to water resource zoning described in the Hydrological Yearbook of the People's Republic of China-Hydrological Data of Yangtze River Basin and used the SWAT model to divide the sub-basins and extract the channel network based on DEM. The Jinsha River Watershed, in which there are 215 sub-basins, was divided into three hydrological zones, namely, upstream of the Jinsha River Watershed, the Yalong River Watershed, and downstream of the Jinsha River Watershed. The upstream zone was divided into 102 sub-basins with an average area of 2524.41 km2; the Yalong River Watershed was divided into 60 sub-basins with an average area of 2135.61 km2; and the downstream zone was divided into 53 sub-basins with an average area of 1608.20 km2 (Figure S1).
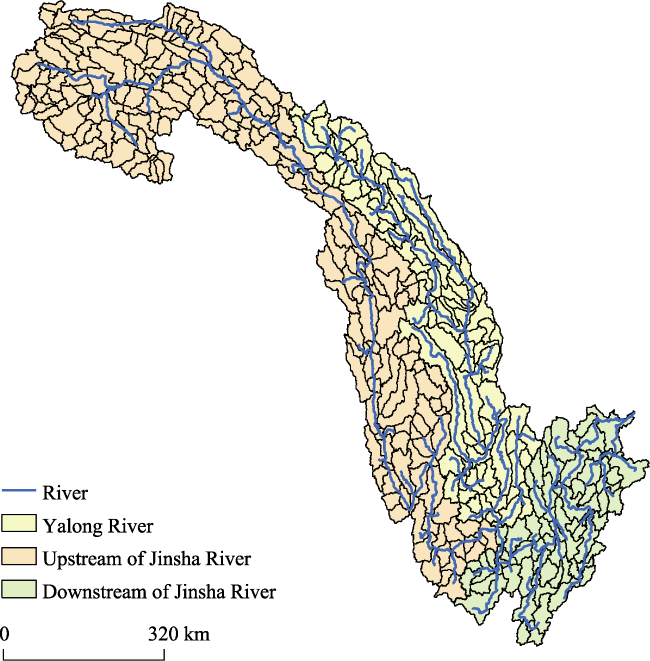
Figure S1 Spatial distribution of subbasins of the Jinsha River Watershed
(2) To reduce the run time and improve the simulation accuracy of the HSPF model for 2015, we divided 25 categories into seven LUCC categories, namely, cultivated land, forest land, grassland, water bodies, construction land, unused land, and ice-snow areas (Table S1).
Table S1 Reclassification of land use types in the Jinsha River Watershed
Old code Old land use type New code New land use type
10 Cropland, rained 1 Cultivate land
11 Herbaceous cover 3 Grassland
12 Tree or shrub cover 2 Forest land
20 Cropland, irrigated or post-flooding 1 Cultivate land
30 Mosaic cropland >50% / natural vegetation(tree, shrub, herbaceous cover) <50% 1 Cultivate land
40 Mosaic natural vegetation(tree, shrub, herbaceous cover) >50% / cropland <50% 2 Forest land
50 Tree cover, broadleaved, evergreen, closed to open >15% 2 Forest land
60 Tree cover, broadleaved, deciduous, closed to open >15% 2 Forest land
61 Tree cover, broadleaved, deciduous, closed >40% 2 Forest land
70 Tree cover, needleleaved, evergreen, closed to open >15% 2 Forest land
100 Mosaic tree and shrub >50% / herbaceous cover <50% 2 Forest land
110 Mosaic herbaceous cover >50% / tree and shrub <50% 3 Grassland
120 Shrubland 3 Grassland
121 Shrubland evergreen 3 Grassland
122 Shrubland deciduous 3 Grassland
130 Grassland 3 Grassland
150 Sparse vegetation (tree, shrub, herbaceous cover) <15% 3 Grassland
170 Tree cover, flooded, saline water 4 Water body
180 Shrub or herbaceous cover, flooded, fresh/saline/brakish water 4 Water body
190 Urban areas 5 Construction land
200 Bare areas 6 Unused land
201 Consolidated bare areas 6 Unused land
202 Unconsolidated bare areas 6 Unused land
210 Water bodies 4 Water body
220 Permanent snow and ice 7 Ice and Snow
(3) The meteorological data were collected and collated and missing temperature data points were augmented with the values for the previous or following days. To enhance HSPF simulation accuracy, we calculated the average precipitation per unit sub-basin area (Tan and Yang, 2020). The meteorological data were then stored in WDM format, embedded in the Better Assessment Science Integrating Point and Nonpoint Source (BASINS) model (https://www.epa.gov/ceam/basins-download-and-installation), and converted into hourly air temperature (ATEM), hourly potential evapotranspiration (PEVT), and hourly precipitation (PREC) values to run the HSPF. The PEVT data were calculated based on the Hamon method (Seong et al., 2018), whereas the PREC data used were the 24-h averages for daily precipitation.
(4) The aforementioned data were entered into the BASINS model, the imperviousness of the construction land was set to 50%, the imperviousness of all other land use types was set to 0, and the master control (UCI) file of the HSPF model was generated. Meteorological data (ATEM, PEVT, and PREC) were assigned to each hydrological response unit in the UCI file and construction of the HSPF model was completed.

2.3.3 Hydrological calibration

A HSPF hydrological model of the Jinsha River Watershed was constructed based on HSPF model calibration and validation. The Model-Independent Parameters Estimator (PEST; https://pesthomepage.org) was used estimate the parameters of complex environmental computer models, and the HSPF-PEST automatic calibration model was used to couple the HSPF and PEST models (Gao et al., 2014; 2015). PEST was used to read the simulated and observed values from the WDM file via a time-series processor (TSPROC), optimize the Gauss-Marquardt-Levenberg (GML) algorithm to adjust the parameters, and rewrite these to HSPF until the stop standards of iteration were met. For further information on the function and format of the HSPF-PEST model, please refer to the HSPF and PEST product manuals at https://water.usgs.gov/software/HSPF/code/doc/hspfhelp.zip and https://s3.amazonaws.com/docs.pesthomepage.org/documents/all_manuals.zip, respectively. On the basis of the daily runoff from the Zhimenda, Gangtuo, Batang, Benzilan, Shigu, Panzhihua, Ganzi, Tongzilin, Huatan, and Pingshan hydrological stations within the Jinsha River Watershed between 2009 and 2011, we used the PEST-HSPF automatic calibration model to calibrate the 11 hydrological parameters of the HSPF model, the types and ranges of which are shown as Table 1. The recommended parameter values were obtained from BASINS Technical Note 6 (Estimating Hydrology and Hydraulic Parameters for HSPF). As the typical objective function only weakly simulates extreme high and low flows (Yang et al., 2018), we used the squared errors of the daily flow, the monthly flow in the wet season (June-October), the monthly flow in the dry season (November-May), and the flow exceedance times (1%, 5%, 10%, 25%, 50%, 75%, 90%, and 95%) as objective functions in the PEST program. Overall, optimization of the PEST model minimized the sum of the four preceding weighted squared errors as follows:
${{f}_{1}}(\theta )=\underset{i=1}{\overset{N}{\mathop{\mathop{\sum }^{}}}}\,{{\left[ \left( {{Q}_{obs,i}}-{{Q}_{sim,i}}(\theta ) \right)*{{\omega }_{1,i}} \right]}^{2}}$
${{f}_{2}}(\theta )=\underset{j=1}{\overset{{{N}_{a}}}{\mathop{\mathop{\sum }^{}}}}\,{{\left[ \left( \underset{i=1}{\overset{{{n}_{j}}}{\mathop{\mathop{\sum }^{}}}}\,{{Q}_{obs,i}}-\underset{i=1}{\overset{{{n}_{j}}}{\mathop{\mathop{\sum }^{}}}}\,{{Q}_{sim,i}}(\theta ) \right)*{{\omega }_{2,j}} \right]}^{2}}$
${{f}_{3}}(\theta )=\underset{j=1}{\overset{{{N}_{b}}}{\mathop{\mathop{\sum }^{}}}}\,{{\left[ \left( \underset{i=1}{\overset{{{n}_{j}}}{\mathop{\mathop{\sum }^{}}}}\,{{Q}_{obs,i}}-\underset{i=1}{\overset{{{n}_{j}}}{\mathop{\mathop{\sum }^{}}}}\,{{Q}_{sim,i}}(\theta ) \right)*{{\omega }_{2,j}} \right]}^{2}}$
${{f}_{4}}(\theta )=\underset{i=1}{\overset{{{E}_{t}}}{\mathop{\mathop{\sum }^{}}}}\,{{\left[ E{{X}_{obs,i}}-E{{X}_{\text{sim},\text{i}}}(\theta )*{{\omega }_{3,i}} \right]}^{2}}$
$\min F(\theta )={{f}_{1}}(\theta )+{{f}_{2}}(\theta )+{{f}_{3}}(\theta )+{{f}_{4}}(\theta )$
where f1(θ), f2(θ), f3(θ), and f4(θ) are the squared errors of the daily flows, the monthly flows in the wet season, the monthly flows in the dry season, and the flow exceedance times, respectively; minF(θ) is the total squared error of all sub-objectives; θ is the parameter set to be calibrated; Q and EX are the daily flow and the fraction of time that the stream flow equals or exceeds a specific flow rate, respectively; the subscripts obs and sim are the observed and simulated data, respectively; ω is a weighting function; N is the total number of days for calibration; Na and Nb are total numbers of selected months in the wet and dry seasons to calibrate, respectively; nj is the number of days in a month; and Ei is the number of specific flow rates to be calibrated.
Table 1 Estimated PEST parameter values for the Jinsha River Watershed
Parameter Description Units Possible values Calibrated values
Min Max Min Max
KMELT Degree-day factor in/day.F 0.001 1.000 0.015 1.000
LZSN Lower zone nominal storage in 2.000 15.000 2.000 14.458
UZSN Upper zone nominal storage in 0.050 2.000 0.278 2.000
INFILT Soil infiltration capacity index in/hr 0.001 0.500 0.001 0.500
IRC Interflow recession parameter 1/day 0.300 0.850 0.300 0.850
BASETP Fraction of remaining potential evapotranspiration that can be satisfied from baseflow if enough is available none 0.010 0.200 0.010 0.200
AGWETP Fraction of remaining potential evapotranspiration that can be satisfied from active groundwater storage if enough is available none 0.001 0.200 0.001 0.200
AGWRC Ground water recession coefficient 1/day 0.850 0.999 0.850 0.999
INTFW Interflow inflow parameter none 1.000 10.000 1.000 10.000
DEEPFR Fraction of groundwater inflow to deep recharge none 1.000E-7 0.500 2.916E-4 0.500
LZETP Lower zone ET parameter none 0.100 0.900 0.100 0.500
In this study, we prioritized the periods 2009-2011 and 2013-2015 as the calibration and validation periods, respectively, whereas the validation period for the Huatan and Pingshan hydrographical stations was 2007-2008. The coefficient of determination (R2), Nash-Sutcliff Efficiency (NSE), and relative error (RE) were selected to assess the performance of the daily runoff simulated using the HSPF hydrological model for the Jinsha River Watershed (Pang et al., 2020). R2, NSE, and RE were calculated using Eqs. 9-11. R2 is the correlation between the simulated and observed values and ranges from 0 to 1, where a value of 1 indicates that the change trend is completely consistent for both groups of data. NSE is used to assess the quality of the hydrological models, the values of which range from -∞ to 1, where 1 is optimal. RE is the error between the simulated and observed values and ranges from -∞ to +∞, for which the simulated error decreases as the value nears 0 (Ngo et al., 2022). For calibration and validation, both R2 and NSE were >0.61 and RE was within the range from -12.34% to 21.45% (Figure S2). Overall, the simulation results of the HSPF hydrological model for the Jinsha River Watershed were good, and could accordingly be used to calculate the hydrological extremes using the following equations:
${{R}^{2}}=\frac{{{\left[ \mathop{\sum }_{i=1}^{n}\left( {{Q}_{obs,i}}-\overline{{{Q}_{obs}}} \right)\left( {{Q}_{sim,i}}-\overline{{{Q}_{sim}}} \right) \right]}^{2}}}{\mathop{\sum }_{i=1}^{n}{{\left( {{Q}_{obs,i}}-\overline{{{Q}_{obs,}}} \right)}^{2}}*\mathop{\sum }_{i=1}^{n}{{\left( {{Q}_{sim,i}}-\overline{{{Q}_{sim}}} \right)}^{2}}}$
$NSE=1-\frac{\mathop{\sum }_{i=1}^{n}{{({{Q}_{obs,i}}-{{Q}_{sim,i}})}^{2}}}{\mathop{\sum }_{i=1}^{n}{{\left( {{Q}_{obs,i}}-\overline{{{Q}_{obs}}} \right)}^{2}}}$
$RE=\frac{\mathop{\sum }_{i=1}^{n}({{Q}_{obs,i}}-{{Q}_{sim,i}})}{\mathop{\sum }_{i=1}^{n}({{Q}_{obs,i}})}*100%$
where ${{Q}_{obs,i}}$ and $\overline{{{Q}_{obs}}}$ are the observed and average observed flows, respectively; ${{Q}_{sim,i}}$and $\overline{{{Q}_{sim}}}$ are the simulated and average simulated flows, respectively; and n represents the total simulated data.
Figure S2 Simulation results of daily recharge of calibration period and validation period

2.3.4 Indicators of hydrological extremes

Indicators of Hydrologic Alteration (IHA) software, developed by The Nature Conservancy (https://www.conservationgateway.org/ConservationPractices/Freshwater/EnvironmentalFlows/MethodsandTools/IndicatorsofHydrologicAlteration/Pages/IHA-Software-Download.aspx), is a user-friendly tool for the assessment of changes in the hydrological regime of a watercourse induced by anthropogenic pressure (http://www.nature.org/). IHA can be used to calculate 33 parameters in five different hydrological groups, namely, flow, time, frequency, delay, and rate of water condition change (Richter et al., 1998). Indicators of hydrological extremes, which along with their ecosystem influences are shown as Table S2, have been widely evaluated in hydrological extreme assessments (Yang et al., 2017; Cheng et al., 2019b). The indicators influence river channel morphology, nutrient exchange volume, and soil moisture stress in plants, and include 10 parameters for annual minimum and maximum flow conditions at 1, 3, 7, 30, and 90 days.
Table S2 Extreme hydrological index and its ecosystem influences
Group IHA parameters Ecosystem influences
Extreme high flow Annual 1-day minimum flow (1) Balance of competitive, ruderal, and stress- tolerant organ-isms
(2) Creation of sites for plant colonization
(3) Structuring of aquatic ecosystems by abiotic vs. biotic factors
(4) Structuring of river channel morphology and physical habitat conditions
(5) Soil moisture stress in plants
(6) Dehydration in animals
(7) Anaerobic stress in plants
(8) Volume of nutrient exchanges between rivers and floodplains
(9) Duration of stressful conditions such as low oxygen and concentrated chemicals in aquatic environments
(10) Distribution of plant communities in lakes, ponds, flood-plains
(11) Duration of high flows for waste disposal, aeration of spawning beds in channel sediments
Annual 3-day minimum flow
Annual 7-day minimum flow
Annual 30-day minimum flow
Annual 90-day minimum flow
Extreme low flow Annual 1-day maximum flow
Annual 3-day maximum flow
Annual 7-day maximum flow
Annual 30-day maximum flow
Annual 90-day maximum flow

2.3.5 LUCC modeling using FLUS-Markov

The Future Land Use Simulation and Markov (FLUS-Markov) model (https://geosimulation.cn/FLUS.html) was used to simulate LUCC within the Jinsha River Watershed in 2030. FLUS-Markov is a change/time series model that combines the advantages of Markov chain determination of the quantity of change and those of FLUS for spatial allocation of the estimated change. FLUS-Markov effectively quantitatively simulates the spatiotemporal patterns of future LUCC (Zhang et al., 2021; Huo et al., 2022). The spatial allocations of change using the FLUS-Markov models are based on a suitability map. Compared with other LUCC simulations based on machine learning, statistical, and economics models, the FLUS-Markov model requires less time to simulate LUCC for large basins and the simulation results obtained tend to be more accurate (Li et al., 2020).
Land-use change is a non-linear phenomenon and involves constant interactions between natural and human factors (da Cunha et al., 2021). On the basis of the available data and the factors driving land-use change, we selected elevation, slope, population density, gross domestic product (GDP), and distances to railways, expressways, county centers, rivers, and trunk roads (Fu et al., 2018; Chen et al., 2021). Nature reserves, lakes, and reservoirs were set as restricted transformation areas. Using land-use image for 2015, we simulated the spatial distribution of all seven land-use types for 2030 using area transition files and probabilities among the LUCCs for the period 2006-2018. The simulations were completed using the FLUS-Markov model in GeoSOS-FLUS (https://geosimulation.cn/FLUS/paralleled%20FLUS_V2.4.zip). The simulation output was validated by comparing the predicted LUCC against the actual LUCC for 2018 (Figure S3). The overall accuracy was 0.85 and the kappa coefficient was 0.78, thereby verifying that the FLUS-Markov model was highly robust for simulating future LUCC dynamics within the Jinsha River Watershed.
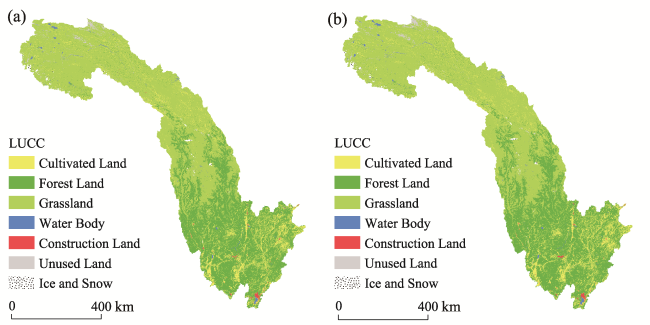
Figure S3 Actual map (a) and simulated map (b) of land use types in the Jinsha River Watershed in 2018

3 Results and discussion

3.1 Characteristics of historical and potential land-use change

Cultivated land, forest land, and grassland were identified as the predominant land-use classes in the Jinsha River Watershed between 1995 and 2015, covering >98% of the total area, with grassland accounting for the largest proportion followed by forest land and cultivated land. Water bodies, construction land, unused land, and ice and snow areas each accounted for less than 1% of the total area. On the basis of our predictions, the land-use types in the study area will continue to be dominated by cultivated land, forest land, and grassland in 2030, which will account for 8.36% (39,177 km2), 35.31% (165,395 km2), and 54.12% (253,540 km2) of the total area, respectively, whereas water bodies, construction land, unused land, and ice and snow area will account for 0.55% (2589 km2), 0.33% (1562 km2), 0.94% (4408 km2), and 0.38% (1799 km2), respectively. Figure 3 shows the distributions and changes in land-use types within the Jinsha River Watershed between 1995 and 2030.
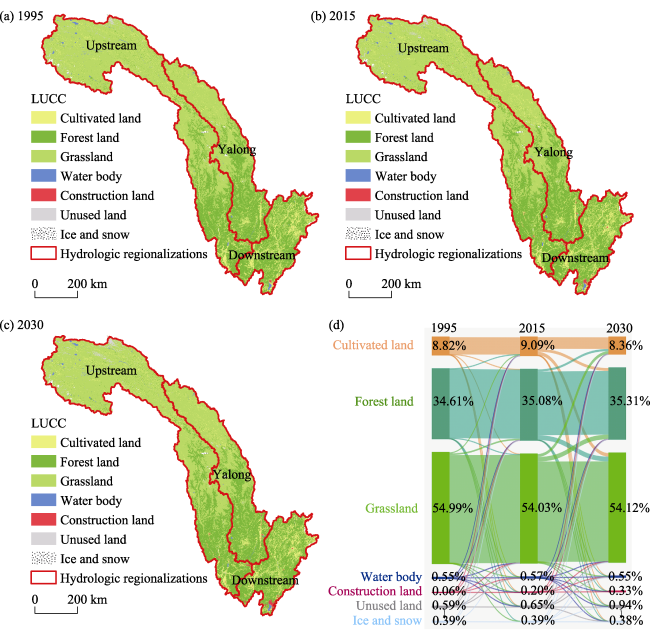
Figure 3 Distributions and changes in land-use type in the Jinsha River Watershed between 1995 and 2030 (a-c. distributions; d. percentage land-use change)
During the study period, we found that there has been an increase in the intensity of land-use change in the Jinsha River Watershed. From 1995 to 2015, 1.51% of the watershed area underwent a change in land use. Changes in construction land, which increased by 240.18%, were most significantly influenced by urbanization (Cheng et al., 2019a), and were mainly associated with the conversion of cultivated land downstream of the Jinsha River Watershed. Whereas there was a degradation in the area under grassland, the areas of cultivated land, forest land, water bodies, and unused land increased by 10.53%, 3.12%, 2.64%, and 1.36%, respectively (Liu et al., 2016). Contrastingly, the areas of ice and snow declined by 0.01% in response to global warming (Wang et al., 2018) and were replaced mainly by forest land and grassland upstream of the Jinsha River Watershed. Between 2015 and 2030, 11.77% of the Jinsha River Watershed area will undergo a change in land-use type. Forest land, grassland, construction land, and unused land will increase by 0.64%, 0.18%, 69.38%, and 45.08%, respectively, with the new patches of forest land, grassland, and unused land primarily being derived from the conversion of grassland and forest land upstream of the Jinsha River Watershed. New patches of construction land will develop, mainly on former cultivated land downstream of the Jinsha River Watershed. In contrast, there will be reductions in the areas of cultivated land, water bodies, and ice and snow of 8.02%, 2.63%, and 0.89%, respectively, mainly as a consequence of the conversion to grassland upstream of the Jinsha River Watershed.
The main current land-use exchange types in the Jinsha River Watershed will be transferred in the future. Using a land-use transfer matrix (Tables S3 and S4) reflecting dynamic land-use transfer (Zhang et al., 2016), we calculated the net swap area of land-use change in the study area (Figure 4). Between 1995 and 2015, there were 17 types of net swap area of land-use change, among which, the net swap area transferred from grassland to forest land account for the largest area (2402.07 km2), whereas that transferred from ice and snow area to forest land was the smallest (0.04 km2). Between 2015 and 2030, it is predicted that there will be 18 types of net swap area of land-use changes, of which the net swap area transferred from cultivated land to forest land will account for the largest area (1637.30 km2) and that transferred from ice and snow area to water bodies will be the smallest (0.30 km2). Compared with the period from 1995 to 2015, there will be a change from patches of ice and snow to water bodies and the directions of certain types of net swap area of land use change will be altered, including those transferred from cultivated land to forest land, grassland, and water bodies.
Table S3 Land use transfer matrix of Jinsha River Watershed from 1995 to 2015 (km2)
Hydrologic regionalizations Land use types Cultivated land Forest
land
Grass-
land
Water
body
Construction land Unused land Ice and snow
Upstream of Jinsha River Cultivated land 14874.76 41.47 283.45 3.65 68.15 0.23 0
Forest land 71.28 58924.09 749.08 6.95 18.36 1.32 0
Grassland 931.21 1984.53 173115.70 51.49 51.56 431.61 0.57
Water body 4.08 0.93 23.79 1586.96 1.83 1.49 0
Construction land 0.73 0.08 1.11 0 87.840 0 0
Unused land 0.08 0.16 143.94 0.54 0 2465.79 0
Ice and snow 0.12 0 0.51 0 0 0 1553.58
Yalong River Cultivated land 7711.32 30.72 144.21 1.71 46.31 0 0
Forest land 41.95 48687.63 496.09 17.42 10.41 0 0.03
Grassland 1096.42 1018.88 67846.19 17.14 16.78 0.09 0.23
Water body 0.30 2.37 1.51 428.93 0.10 0 0
Construction land 0.54 0.13 0.05 0.17 40.69 0 0
Unused land 0 0 0.80 0 0 138.51 0
Ice and snow 0.04 0.07 0.20 0 0 0 261.72
Downstream of Jinsha River Cultivated land 18372.26 58.12 21.89 3.91 274.37 0 0
Forest land 52.74 54055.50 107.25 15.71 61.17 0 0
Grassland 61.83 751.08 10549.93 1.23 122.79 0 0
Water body 5.28 4.23 1.15 525.67 5.79 0 0
Construction land 0.42 0.20 0.48 0.18 178.31 0 0
Unused land 0 0 0 0 0 0 0
Ice and snow 0 0 0 0 0 0 0
Table S4 Land use transfer matrix of Jinsha River Watershed from 2015 to 2030 (km2)
Hydrologic regionalizations Land use types Cultivated land Forest
land
Grass-
land
Water
body
Construction land Unused land Ice and snow
Upstream of Jinsha River Cultivated land 9247.03 1760.01 4713.46 43.99 75.12 8.64 1.58
Forest land 1449.82 53577.32 5809.81 39.61 27.88 18.96 4.3
Grassland 3822.84 4912.47 162490.85 243.31 84.78 2049.31 180.43
Water body 19.75 34.03 292.61 1259.48 1.96 40.47 0.31
Construction land 39.83 17.22 13.2 0.91 156.58 0 0
Unused land 3.27 4.38 740 27.15 0 2040.19 10.98
Ice and snow 4.03 2.78 187.51 0.61 0 12.12 1314.8
Yalong River Cultivated land 4999.45 1172.13 2552.37 22.90 61.85 0.35 0.39
Forest land 778.72 45320.65 3429.34 35.14 14.29 0.65 1.95
Grassland 1926.20 3143.01 62612.54 77.19 12.24 47.98 24.6
Water body 5.39 43.48 120.99 288.92 2.34 0 0
Construction land 18.4 11.78 3.14 1.13 79.66 0 0
Unused land 0.24 0.49 49.13 0 0 76.24 6.74
Ice and snow 0.52 1.04 32.02 0 0 7.08 211.67
Downstream of Jinsha River Cultivated land 12841.18 3808.50 885.04 81.06 343.80 0 0
Forest land 2874.8 49170.15 1880.75 37.66 95.81 0 0
Grassland 1081.84 2544.82 6703.85 19.98 148.75 0 0
Water body 32.31 51.92 48.15 400.59 11.88 0 0
Construction land 46.45 32.78 6.34 5.53 539.84 0 0
Unused land 0 0 0 0 0 0 0
Ice and snow 0 0 0 0 0 0 0
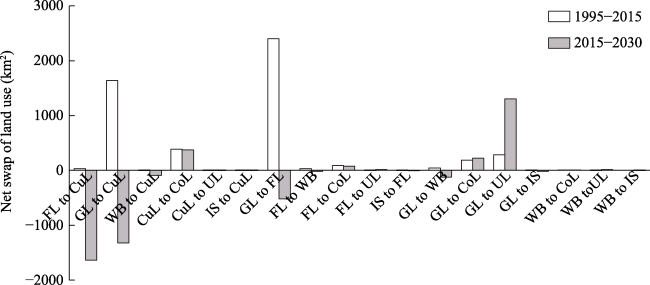
Figure 4 Net swap area of land use change in the Jinsha River Watershed (CuL: cultivated land; FL: forest land; GL: grassland; WB: water body; CoL: construction land; UL: unused land; IS: ice and snow area)

3.2 Hydrological effects of land-use change

It has previously been proposed that land-use change in the Jinsha River Watershed has had no significant hydrological effects (Chen et al., 2020). In the present study, we applied the HSPF hydrological model to assess the effects of land-use changes in the Jinsha River Watershed. The meteorological data were kept constant, and only the land-use data were replaced to simulate daily natural runoff within the Jinsha River Watershed between 1980 and 2017 under land use scenarios in 1995, 2015, and 2030, respectively (Tables S5 and 2). Historical land-use change (1995-2015) was found to have had no significant impact on the past annual runoff of the Jinsha River outlet, and it is predicted that the impact of land-use change will continue to decline in the future (2015-2030). Under the land-use scenario of 2015, the annual natural flow at the outlet of the Jinsha River was 115.88 billion m3, whereas the annual runoff yields of the Yalong River Watershed and upstream and downstream zones of the Jinsha River Watershed were 51.72, 45.14, and 19.02 billion m3, respectively. Compared with the 1995 land-use scenario, the annual natural flow at the outlet of the Jinsha River increased by 0.13 (0.15 billion m3), mainly from the upstream and downstream zones of the Jinsha River Watershed, with increases in annual runoff yield of 0.12% (0.06 billion m3) and 0.53% (0.10 billion m3), respectively. Contrastingly, the Yalong River Watershed, with a 0.02% (0.01 billion m3) reduction in annual average runoff yield, was found to make a negative contribution to the increase in annual natural flow at the Jinsha River outlet. In the future, it is predicted that between 2015 and 2030, land-use changes will have a relatively minor impact on the annual natural flow and runoff yield, with changes of less than 0.01%. Given the predicted increase in the area undergoing land-use change between 2015 and 2030, the reductions in annual flow could plausibly be explained by the irregular distribution of annual runoff in response to land-use change.
Table S5 Variation of hydrological index under different LUCC scenarios in the Jinsha River Watershed
Extreme hydrological index Upstream of Jinsha River Yalong River Downstream of Jinsha River
1995 2015 2030 1995 2015 2030 1995 2015 2030
Annual runoff yield (108×m3) 450.87 451.43 451.54 517.32 517.20 517.32 189.15 190.16 189.98
Annual 1-day minimum (m3 s-1) 131.80 133.00 130.00 454.20 456.90 453.40 674.70 678.60 672.50
Annual 3-day minimum (m3 s-1) 132.60 133.80 130.80 455.00 457.80 454.30 676.20 680.20 674.00
Annual 7-day minimum (m3 s-1) 135.30 136.50 133.50 458.50 461.20 457.80 680.80 684.80 678.70
Annual 30-day minimum (m3 s-1) 156.10 157.40 154.50 483.70 486.50 483.10 718.90 723.10 717.00
Annual 90-day minimum (m3 s-1) 215.70 217.10 214.20 537.10 539.80 536.50 817.20 821.60 815.70
Annual 1-day maximum (m3 s-1) 4699.00 4706.00 4712.00 5948.00 5943.00 5949.00 11870.00 11880.00 11890.00
Annual 3-day maximum (m3 s-1) 4629.00 4635.00 4640.00 5755.00 5749.00 5756.00 11760.00 11760.00 11770.00
Annual 7-day maximum (m3 s-1) 4499.00 4504.00 4509.00 5412.00 5405.00 5414.00 11380.00 11380.00 11390.00
Annual 30-day maximum (m3 s-1) 4049.00 4053.00 4058.00 4493.00 4486.00 4494.00 9915.00 9916.00 9927.00
Annual 90-day maximum (m3 s-1) 3439.00 3442.00 3446.00 3561.00 3557.00 3563.00 8398.00 8400.00 8410.00
Table 2 Relative changes in the extreme hydrological indices under different LUCC scenarios
Hydrological index Upstream of Jinsha River Yalong River Downstream of Jinsha River
1995-2015 (%) 2015-2030 (%) 1995-2015 (%) 2015-2030 (%) 1995-2015 (%) 2015-2030 (%)
Annual runoff yield 0.12 0.03 -0.02 0.02 0.53 -0.09
Annual 1-day minimum flow 0.91 -2.26 0.59 -0.77 0.58 -0.90
Annual 3-day minimum flow 0.90 -2.24 0.62 -0.76 0.59 -0.91
Annual 7-day minimum flow 0.89 -2.20 0.59 -0.74 0.59 -0.89
Annual 30-day minimum flow 0.83 -1.84 0.58 -0.70 0.58 -0.84
Annual 90-day minimum flow 0.65 -1.34 0.50 -0.61 0.54 -0.72
Annual 1-day maximum flow 0.15 0.13 -0.08 0.10 0.08 0.08
Annual 3-day maximum flow 0.13 0.11 -0.10 0.12 0 0.09
Annual 7-day maximum flow 0.11 0.11 -0.13 0.17 0 0.09
Annual 30-day maximum flow 0.10 0.12 -0.16 0.18 0.01 0.11
Annual 90-day maximum flow 0.09 0.12 -0.11 0.17 0.02 0.12
We found that the annual maximum flow was more sensitive to land-use change than was the annual flow and this difference is expected to widen in the future. The extreme hydrological regimes of the three hydrological zones of the Jinsha River Watershed between 1980 and 2017 under the land use scenarios of 1995, 2015, and 2030 are shown in Tables S5 and 2. Land-use changes in the Jinsha River Watershed between 1995 and 2015 were found to have had a significantly greater impact on extreme low flows (annual 1-, 3-, 7-, 30-, and 90-day minima) than on extreme high flows (annual 1-, 3-, 7-, 30-, and 90-day maxima), with the extreme low flows increasing by 0.54%-0.59% and the extreme high flows increased by less than 0.1%.

3.3 Spatial variation in the responses of hydrological extremes to LUCC and the hedging effect

We detected significant spatial differences in the responses of hydrological extremes to land-use change in the Jinsha River Watershed. The variations in extreme low flow indices upstream of the Jinsha River Watershed were significantly greater than those in the Yalong River Watershed and downstream zones of the Jinsha River Watershed. Notably, the extreme high flow indices of the three hydrological zones varied in different directions, with a reduction in the extreme high flows in the Yalong River Watershed and an increase in the extreme high flows upstream and downstream of the Jinsha River Watershed. On the basis of the aforementioned findings, we calculated the extreme hydrological regimes of the sub-basin outlets with catchment areas >1000 km2 and no confluence relationship under the land-use scenarios between 1995 and 2015, which are shown Figures 5 and 6.
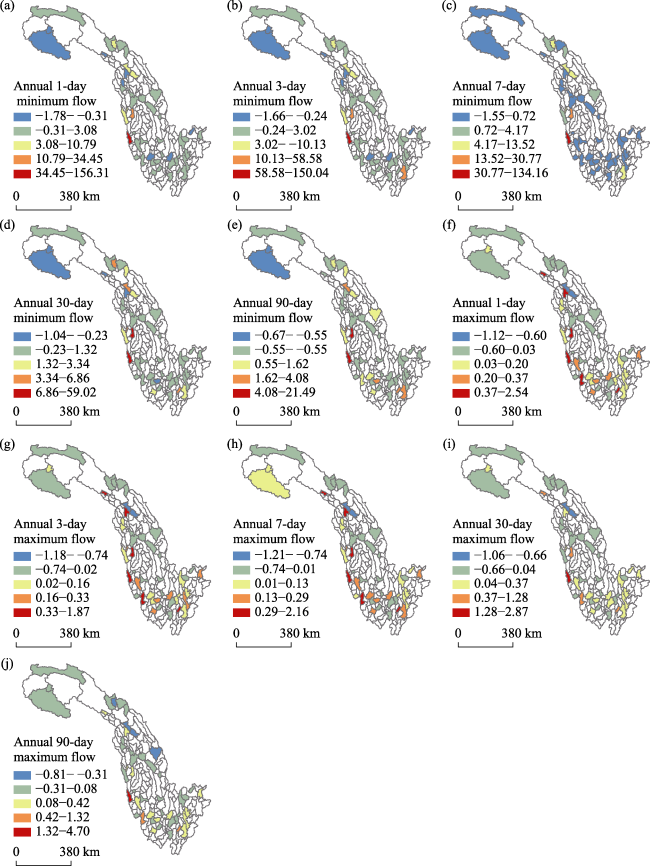
Figure 5 Relative changes in the extreme hydrological indices under the 1995-2015 LUCC scenarios for stream outlets with catchment areas >1000 km2 (%)
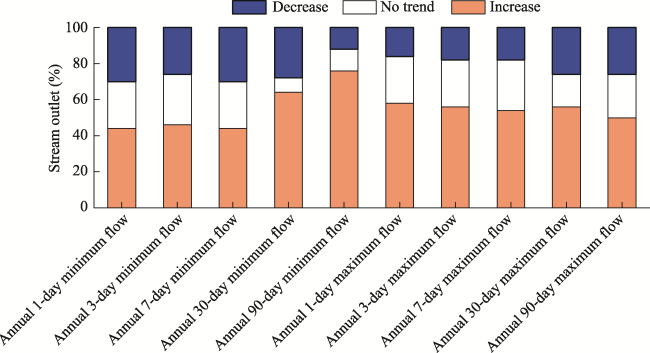
Figure 6 Percentage stream outlet for each extreme hydrological index identified with an increase, a decrease, or no trend
The responses of hydrological extremes to land-use change were found to be characterized by spatial hedging. We detected reductions and increases in extreme flow at the outlets of 12%-30% and 44%-76% sub-basins, respectively, among which, the reductions in extreme low flows ranged from 0.01% to 1.78%, with respective reductions in cumulative amounts ranging from 0.26 to 0.16 m3 s-1. Comparatively, there were reductions of between 0.01% and 1.21% for extreme high flows, with corresponding reductions in cumulative amounts ranging from 4.01 to 1.94 m3 s-1. In contrast, there were increases of between of 0.01% and 156.31% in extreme low flows at the sub-basin outlets, with corresponding increases of between 1.96 and 2.43 m3 s-1 in cumulative amounts. Comparatively, there were increases of 0.01%-4.70% in extreme high flows of the sub-basin outlets, with cumulative amounts increasing by between 6.01 and 25.64 m3 s-1. Downstream of the confluence of watersheds, the increases in the Jinsha River outlet were between 0-10 m3 s-1, which is smaller than the increase in cumulative amounts of the sub-basins, which provides evidence to indicate that the hedging effect contributes to alleviating the impact of land use on mainstream hydrological regimes. Consequently, the responses of hydrological extremes to LUCC should not be overlooked and the respective interactions should accordingly be analyzed.

3.4 Correlations between LUCC and extreme hydrological regimes

The net change in land use is an important factor influencing hydrological processes. In this study, we detected no significant relationships between net land-use change and extreme hydrological regimes in the Jinsha River Watershed. To eliminate the hedging effect between the responses of hydrological extremes to different types of land-use change (Gebremicael et al., 2019), we applied a multivariate linear regression model and investigated the correlations between LUCC and extreme hydrological regimes (Table 3). As independent variables, we used the changes in 17 types of net swap of land use in sub-basins with catchment areas >1000 km2 and under the land-use scenario between 1995 and 2015, with the corresponding changes in 10 extreme hydrological indices being used as dependent variables.
Table 3 Linear regression results of land-use changes and hydrological extremes
Extreme hydrological index Net swap types of land use Constant R2
IS to FL IS to CuL GL to CoL FL to CoL WB to CoL FL to WB
Annual 1-day minimum flow 66.033 9.239 - - - - 0.143 0.569
Annual 3-day minimum flow 68.414 9.415 - - - - 0.145 0.576
Annual 7-day minimum flow 66.839 9.403 - - - - 0.144 0.567
Annual 30-day minimum flow 69.688 9.842 - - - - 0.151 0.572
Annual 90-day minimum flow 69.114 10.309 - - - - 0.149 0.579
Annual 1-day maximum flow - 34.217 0.004 - - - -0.175 0.434
Annual 3-day maximum flow - - 0.003 - - - 0.022 0.187
Annual 7-day maximum flow -152.279 19.243 0.001 - - - -0.104 0.462
Annual 30-day maximum flow -126.674 12.871 - 0.002 - - -0.121 0.403
Annual 90-day maximum flow -68.904 8.797 - - 0.128 0.002 -0.068 0.354

Note: CuL: cultivated land; FL: forest land; GL: grassland; WB: water body; CoL: construction land; UL: unused land; IS: ice and snow area

The responses of the hydrological extremes to land-use change in small areas were found to be significant (De Niel and Willems, 2019). Extreme flows were primarily associated with the net swap areas transferred (1) from ice and snow area to forest and cultivated, grassland, and forest land, (2) from water bodies to construction land, and (3) from forest land to water bodies. Of these, the net swap area transferred from ice and snow area to forest land and cultivated land contributed the most. The extreme low flows (annual 1-, 3-, 7-, 30-, and 90-day minima) were distributed mainly in the dry season, with main the supply source being ice-snow meltwater. The extreme low flows were found to be positively correlated with the net swap area transferred from the ice and snow areas to forest land and cultivated land. This transition affected the energy balance of the snow cover by reducing the surface albedo, thereby increasing the surface temperature, accelerating the melt of snow, and increasing runoff during the dry season (DeBeer and Pomeroy, 2017). The extremely high flows (annual 1-, 3-, 7-, 30-, and 90-day maxima) were distributed mainly in the wet season, with precipitation being the main supply source. These extreme high flows were positively and negatively correlated with the net swap area transferred from the ice and snow areas to cultivated land and forest land, respectively. These conversions affected the surface runoff retention capacity of the aforementioned land types (Oztas and Fayetorbay, 2003; Khare et al., 2017; Wang et al., 2021). The extreme high flows were positively correlated with the net swap area transferred from grassland and forest land to construction land, and were also positively correlated with the net swap area transferred from forest land to water bodies. By reducing subsurface infiltration capacity, construction land and water bodies contribute to an increase in surface runoff, thereby increasing the frequency of extreme high flows (Gao et al., 2020; Sohn et al., 2020).
Predictions indicate that in the future, there will be reductions in precipitation within the Jinsha River Watershed during the wet season and increases during the dry season (Lu and Zhang, 2019), thereby contributing to higher extreme low flows, lower extreme high flows, and a relatively more uniform intra-annual distribution of Jinsha River runoff. However, the impact of future land-use change on hydrological extremes in the Jinsha River Watershed will be diametrically opposed to the effects of climate change and threaten the ecological environment and human society. To attenuate the detrimental effects of land use change on extreme hydrological regimes, it will be essential to mitigate the degradation of forest land in the vicinity of ice and snow areas, and restrict the transformation of grassland, forest land, and water bodies to construction land. Hydropower stations can contribute to the regulation of river runoff, control flooding, provide drought relief, generate electricity, and protect the environment (Xia and Chen, 2021), and to date, 12 hydropower stations have been put into operation within the Jinsha River Watershed (Cui et al., 2021), including the Suwalong station upstream, the Liyuan, Jinanqiao, and five other stations midstream, and the Baihetan, Xiluodu, and two other stations downstream. In the future, it will be necessary for the water storage and power generation at these stations to be reasonably regulated to control flooding and combat drought in the Jinsha River Watershed.
In this study, although we have proposed and demonstrated the utility of a novel method for investigating the hydrological extremes that occur in response to land-use change, both the available data and scale of the research area were limited. Moreover, we were unable to account for changes in the extreme hydrological regimes associated with hydropower stations and other anthropogenic activities. In future research, we will endeavor to fill in these information gaps accordingly.

4 Conclusions

LUCC in the upstream catchment of the largest river in China has had an irregular impact on riverine hydrological regimes, particularly in response to extreme flow events. The hedging effect may contribute to mitigating the detrimental impacts of land-use change on the mainstream flow regime by differentially altering flows in different tributaries and underestimating the influence of LUCC on overall river flows. In this study, we simulated the effects of historical and potential land use on the hydrological extremes of the Jinsha River Watershed based on semi-distributed HSPF, land-use, and multivariate linear regression analysis models. We also revealed the hedging effect of tributaries on mainstreams and the divergent changes in flow at different spatial scales.
LUCC was found to have a significant and spatially variable influence on hydrological extremes in the Jinsha River Watershed. Under the influence of spatial hedging, the changes in hydrological extremes at the lowest outlet of the Jinsha River were weaker than those at the tributaries. The extreme hydrological regimes were influenced mainly by the net swap area transferred from ice and snow area to forest (NSAIF), and thereafter to cultivated land (NSAIC) in the Jinsha River Watershed. Extreme low flow was shown to be positively correlated with NSAIF and NSAIC, whereas extreme high flow was positively correlated with NSAIC and negatively correlated with NSAIF. Predictions indicate that LUCC and its impacts on hydrological extremes of the Jinsha River Watershed will become even more pronounced by 2030. Consequently, in the future, in addition to the development of hydropower plants, land use should be rationally and collaboratively planned to reduce the detrimental impacts of land-use change on extreme hydrological events, reduce the degradation of forest land in the vicinity of areas of ice and snow, and restrict the transformation of grassland, forest land, and water bodies to construction land.
Conflicts of Interest: The authors declare no conflicts of interest.
[1]
Abou Rafee S A, de Freitas E D, Martins J A et al., 2021. Hydrologic response to large-scale land use and cover changes in the Upper Parana River Basin between 1985 and 201. Regional Environmental Change, 21(4): 112.

DOI

[2]
Allahbakhshian-Farsani P, Vafakhah M, Khosravi-Farsani H et al., 2020. Regional flood frequency analysis through some machine learning models in semi-arid regions. Water Resources Management, 34(9): 2887-2909.

DOI

[3]
Aragaw H M, Goel M K, Mishra S K, 2021. Hydrological responses to human-induced land use/land cover changes in the Gidabo River basin, Ethiopia. Hydrological Sciences Journal-Journal Des Sciences Hydrologiques, 66(4): 640-655.

DOI

[4]
Chen Q H, Chen H, Wang J X et al., 2019a. Impacts of climate change and land-use change on hydrological extremes in the Jinsha River Basin. Water, 11(7): 1398.

DOI

[5]
Chen Q H, Chen H, Zhang J et al., 2020. Impacts of climate change and LULC change on runoff in the Jinsha River Basin. Journal of Geographical Sciences, 30(1): 85-102.

DOI

[6]
Chen Y, Xu C Y, Chen X W et al., 2019b. Uncertainty in simulation of land-use change impacts on catchment runoff with multi-timescales based on the comparison of the HSPF and SWAT models. Journal of Hydrology, 573: 486-500.

DOI

[7]
Chen Z Z, Huang M, Zhu D Y et al., 2021. Integrating remote sensing and a Markov-FLUS Model to simulate future land use changes in Hokkaido, Japan. Remote Sensing, 13(13): 2621.

DOI

[8]
Cheng F Y, Liu S L, Hou X et al., 2019a. The effects of urbanization on ecosystem services for biodiversity conservation in southernmost Yunnan province, Southwest China. Journal of Geographical Sciences, 29(7): 1159-1178.

DOI

[9]
Cheng G W, Liu Y, Chen Y et al., 2022. Spatiotemporal variation and hotspots of climate change in the Yangtze River Watershed during 1958-2017. Journal of Geographical Sciences, 32(1): 141-155.

DOI

[10]
Cheng G W, Wang M J, Chen Y et al., 2020. Source apportionment of water pollutants in the upstream of Yangtze River using APCS-MLR. Environmental Geochemistry and Health, 42(11): 3795-3810.

DOI

[11]
Cheng J X, Xu L, G Fan H X et al., 2019b. Changes in the flow regimes associated with climate change and human activities in the Yangtze River. River Research And Applications, 35(9): 1415-1427.

DOI

[12]
Chou C, Chiang J C H, Lan C W et al., 2013. Increase in the range between wet and dry season precipitation. Nature Geoscience, 6(4): 263-267.

DOI

[13]
Cui L, Gu H B, Gao F, 2022. Analysis and suggestions on hydropower development utilizing the natural river sections of Jinsha River. Water Power, 48(1): 1-4, 129. (in Chinese)

[14]
da Cunha E R, Santos C A G, da Silva R M et al., 2021. Future scenarios based on a CA-Markov land use and land cover simulation model for a tropical humid basin in the Cerrado/Atlantic forest ecotone of Brazil. Land Use Policy, 101: 105141.

DOI

[15]
De Niel J D, Willems P, 2019. Climate or land cover variations: What is driving observed changes in river peak flows? A data-based attribution study. Hydrology and Earth System Sciences, 23(2): 871-882.

DOI

[16]
DeBeer C M, Pomeroy J W, 2017. Influence of snowpack and melt energy heterogeneity on snow cover depletion and snowmelt runoff simulation in a cold mountain environment. Journal of Hydrology, 553: 199-213.

DOI

[17]
Duan H M, Xie Y W, Du T et al., 2021. Random and systematic change analysis in land use change at the category level: A case study on Mu Us area of China. Science of The Total Environment, 777: 145920.

DOI

[18]
Fan P Y, Chun K P, Mijic A et al., 2021. Quantifying land use heterogeneity on drought conditions for mitigation strategies development in the Dongjiang River Basin, China. Ecological Indicators, 129: 107945.

DOI

[19]
Fonseca A R, Santos M, Santos J A, 2018. Hydrological and flood hazard assessment using a coupled modelling approach for a mountainous catchment in Portugal. Stochastic Environmental Research and Risk Assessment, 32(7): 2165-2177.

DOI

[20]
Fu X, Wang X H, Yang Y J, 2018. Deriving suitability factors for CA-Markov land use simulation model based on local historical data. Journal of Environmental Management, 206: 10-19.

DOI PMID

[21]
Gao W, Guo H C, Liu Y, 2015. Impact of calibration objective on hydrological model performance in ungauged watersheds. Journal of Hydrologic Engineering, 20(8): 04014086.

DOI

[22]
Gao W, Zhou F, Dong Y J et al., 2014. Pest-based multi-objective automatic calibration of hydrologic parameters for hspf model. Journal of Natural Resources, 29(5): 855-867. (in Chinese)

DOI

[23]
Gao Y Q, Chen J H, Luo H et al., 2020. Prediction of hydrological responses to land use change. Science of The Total Environment, 708: 134998.

DOI

[24]
Gashaw T, Tulu T, Argaw M et al., 2018. Modeling the hydrological impacts of land use/land cover changes in the Andassa watershed, Blue Nile Basin, Ethiopia. Science of The Total Environment, 619: 1394-1408.

[25]
Gebremicael T G, Mohamed Y A, Van der Zaag P, 2019. Attributing the hydrological impact of different land use types and their long-term dynamics through combining parsimonious hydrological modelling, alteration analysis and PLSR analysis. Science of The Total Environment, 660: 1155-1167.

DOI

[26]
Guo W X, Chen D X, Li Y et al., 2018. IHA-RVA-based assessment of eco-hydrological regime of Lower Jinshajiang River. Water Resources and Hydropower Engineering, 49(8): 155-162. (in Chinese)

[27]
Huang H, Zhou Y, Qian M J et al., 2021. Land use transition and driving forces in Chinese Loess Plateau: A case study from Pu county, Shanxi province. Land, 10(1): 67.

DOI

[28]
Huo J E, Shi Z Q, Zhu W B et al., 2022. A multi-scenario simulation and optimization of land use with a Markov-FLUS Coupling Model: A case study in Xiong’an New Area, China. Sustainability, 14(4): 2425.

DOI

[29]
Jacobson C R, 2011. Identification and quantification of the hydrological impacts of imperviousness in urban catchments: A review. Journal of Environmental Management, 92(6): 1438-1448.

DOI PMID

[30]
Khare D, Patra D, Mondal A et al., 2017. Impact of landuse/land cover change on run-off in the catchment of a hydro power project. Applied Water Science, 7(2): 787-800.

DOI

[31]
Li L J, Jiang D J, Hou X Y et al., 2013. Simulated runoff responses to land use in the middle and upstream reaches of Taoerhe River basin, Northeast China, in wet, average and dry years. Hydrological Processes, 27(24): 3484-3494.

DOI

[32]
Li Z Z, Cheng X Q, Han H R, 2020. Future impacts of land use change on ecosystem services under different scenarios in the ecological conservation area, Beijing, China. Forests, 11(5): 584.

DOI

[33]
Liu L L, Cao W, Shao Q Q et al., 2016. Characteristics of land use/cover and macroscopic ecological changes in the headwaters of the Yangtze River and of the Yellow River over the past 30 years. Sustainability, 8(3): 237.

DOI

[34]
Liu W, Zhan J Y, Zhao F et al., 2019. Impacts of urbanization-induced land-use changes on ecosystem services: A case study of the Pearl River Delta Metropolitan Region, China. Ecological Indicators, 98: 228-238.

DOI

[35]
Liu X W, Peng D Z, Xu Z X, 2018. Identification of the impacts of climate changes and human activities on runoff in the Jinsha River Basin, China. Advances in Meteorology, 2017: 4631831.

[36]
Lu Y, Zhang X F, 2019. Variation analysis of precipitation in Jinsha River Basin during 1957-2015. China Rural Water and Hydropower, 443(9): 22-27, 32. (in Chinese)

[37]
Mason D, Iida A, Watanabe S et al., 2021. How urbanization enhanced exposure to climate risks in the Pacific: A case study in the Republic of Palau. Environmental Research Letters, 15(11): 114007.

DOI

[38]
Ngo T S, Hoang L H, Nguyen D L, 2022. Tran T. Application of SWAT model to assess land use change and climate variability impacts on hydrology of Nam Rom Catchment in northwestern Vietnam. Environment, Development and Sustainability, 24(3): 3091-3109.

DOI

[39]
Onstad C A, Jamieson D G, 1970. Modelling the effects of land use modifications on runoff. Water Resources Research, 6(5): 1287-1295.

DOI

[40]
Oztas T, Fayetorbay F, 2003. Effect of freezing and thawing processes on soil aggregate stability. Catena, 52(1): 1-8.

DOI

[41]
Pang S J, Wang X Y, Melching C S et al., 2020. Development and testing of a modified SWAT model based on slope condition and precipitation intensity. Journal of Hydrology, 588: 125098.

DOI

[42]
Pontius R G, Shusas E, McEachern M, 2004. Detecting important categorical land changes while accounting for persistence. Agriculture Ecosystem and Environment, 101(2/3): 51-268.

[43]
Richter B D, Baumgartner J V, Braun D P et al., 1998. A spatial assessment of hydrologic alteration within a river network. Regulated Rivers: Research & Management, 14(4): 329-340.

DOI

[44]
Seong C, Sridhar V, Billah M M, 2018. Implications of potential evapotranspiration methods for streamflow estimations under changing climatic conditions. International Journal of Climatology, 38(2): 896-914.

DOI

[45]
Shen L Y, Wen T, Shi P et al., 2021. Responses of extreme hydrologic events to future land use change in the upper reaches of Huaihe River. Water Resources and Hydropower Engineering, 53(4): 95-107. (in Chinese)

[46]
Sohn W, Kim J H, Li M H et al., 2020. How does increasing impervious surfaces affect urban flooding in response to climate variability? Ecological Indicators, 118: 106774.

DOI

[47]
Sood A, Smakhtin V, 2015. Global hydrological models: A review. Hydrological Sciences Journal-Journal Des Sciences Hydrologiques, 60(4): 549-565.

DOI

[48]
Tan M L, Yang X Y, 2020. Effect of rainfall station density, distribution and missing values on SWAT outputs in tropical region. Journal of Hydrology, 584: 124660.

DOI

[49]
Tigabu T B, Wagner P D, Hormann G et al., 2019. Modeling the impact of agricultural crops on the spatial and seasonal variability of water balance components in the Lake Tana basin, Ethiopia. Hydrology Research, 50(5): 1376-1396.

DOI

[50]
Tsarouchi G, Buytaert W, 2018. Land-use change may exacerbate climate change impacts on water resources in the Ganges basin. Hydrology and Earth System Sciences, 22(2): 1411-1435.

DOI

[51]
Wagner P D, Bhallamudi S M, Narasimhan B et al., 2015. Dynamic integration of land use changes in a hydrologic assessment of a rapidly developing Indian catchment. Science of The Total Environment, 539: 153-164.

DOI

[52]
Wang Q, Xu Y P, Wang Y F et al., 2020. Individual and combined impacts of future land-use and climate conditions on extreme hydrological events in a representative basin of the Yangtze River Delta, China. Atmospheric Research, 236: 104805.

DOI

[53]
Wang W H, Wu T H, Zhao L et al., 2018. Exploring the ground ice recharge near permafrost table on the central Qinghai-Tibet Plateau using chemical and isotopic data. Journal of Hydrology, 560: 220-229.

DOI

[54]
Wang X J, Xia J Q, Dong B L et al., 2021. Spatiotemporal distribution of flood disasters in Asia and influencing factors in 1980-2019. Natural Hazards, 108(3): 2721-2738.

DOI

[55]
Wang Z W, Huang L M, Shao M A et al., 2022. Soil water holding capacity under different land use patterns in the Qinghai alpine region. Arid Zone Research, 38(6): 1722-1730. (in Chinese)

[56]
Xia J, Chen J, 2021. A new era of flood control strategies from the perspective of managing the 2020 Yangtze River flood. Science China-Earth Sciences, 64(1): 1-9.

DOI

[57]
Yang B, Chen Y, Chen X W et al., 2018. HSPF runoff simulation and optimization based on PEST automatic calibration. Science of Soil and Water Conservation, 16(2): 9-16. (in Chinese)

[58]
Yang T, Cui T, Xu C Y et al., 2017. Development of a new IHA method for impact assessment of climate change on flow regime. Global and Planetary Change, 156: 68-79.

DOI

[59]
Yang X L, Chen H L, Wang Y L et al., 2016. Evaluation of the effect of land use/cover change on flood characteristics using an integrated approach coupling land and flood analysis. Hydrology Research, 47(6): 1161-1171.

DOI

[60]
Yang X L, Ren L L, Singh V P et al., 2012. Impacts of land use and land cover changes on evapotranspiration and runoff at Shalamulun River watershed, China. Hydrology Research, 43(1/2): 23-37.

DOI

[61]
Zhang C C, Wang P, Xiong P S et al., 2021. Spatial pattern simulation of land use based on FLUS Model under ecological protection: A case study of Hengyang city. Sustainability, 13(18): 10458.

DOI

[62]
Zhang Y, Zhao Y, Wang Q M et al., 2016. Impact of land use on frequency of floods in Yongding River Basin, China. Water, 8(9): 401.

DOI

[63]
Zope P E, Eldho T I, Jothiprakash V, 2016. Impacts of land use-land cover change and urbanization on flooding: A case study of Oshiwara River Basin in Mumbai, India. Catena, 145: 142-154.

DOI

Outlines

/