Research Articles

Assessment on the sustainability of water resources utilization in Central Asia based on water resources carrying capacity

  • LIU Wenhua , 1 ,
  • WANG Yizhuo 1, 2 ,
  • HUANG Jinku 3 ,
  • ZHU Wenbin , 1, 4, *
Expand
  • 1. Key Laboratory of Water Cycle and Related Land Surface Processes, Institute of Geographic Sciences and Natural Resources Research, CAS, Beijing 100101, China
  • 2. University of Chinese Academy of Sciences, Beijing 100049, China
  • 3. Institute of Geomechanics, Chinese Academy of Geological Sciences, Beijing 100037, China
  • 4. State Key Laboratory of Plateau Ecology and Agriculture, Qinghai University, Xining 810016, China
*Zhu Wenbin, Associate Professor, specialized in hydrology, remote sensing, and water resources management. E-mail:

Liu Wenhua (1976-), Associate Professor, specialized in ecohydrology and sustainable water resources management. E-mail:

Received date: 2022-10-14

  Accepted date: 2023-05-17

  Online published: 2023-10-08

Supported by

Strategic Priority Research Program of the Chinese Academy of Sciences(XDA19090120)

Strategic Priority Research Program of the Chinese Academy of Sciences(XDA19030104)

Youth Innovation Promotion Association of Chinese Academy of Sciences(2020056)

Abstract

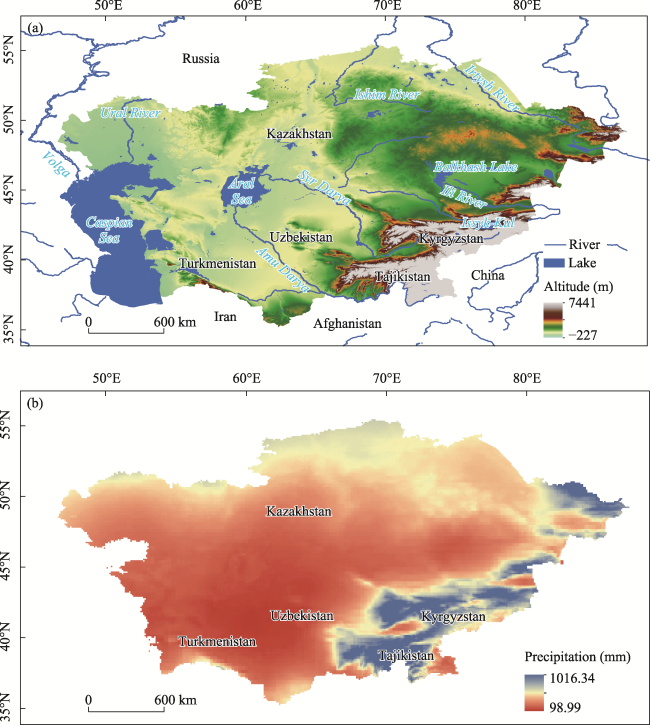
Situated in the hinterland of Eurasia, Central Asia is characterized by an arid climate and sparse rainfall. The uneven spatial distribution of water and land resources across the region has pressured economic and social development. An accurate understanding of Central Asia's water resources carrying capacity (WRCC) is vital for enhancing the sustainability of water resources utilization and guiding regional economic and social activities. This study aims to facilitate the sustainability of water resources utilization by evaluating the region's WRCC from the viewpoints of economic and technological conditions and social welfare. A concise yet effective model with relatively fewer parameters was established by adopting water resources data from the Food and Agriculture Organization (FAO) and socioeconomic data from the World Bank. The results indicated that the WRCC of all five Central Asian countries showed an increasing trend with improved water use efficiency from 1995 to 2020. Kazakhstan's WRCC was significantly higher than the other four countries, reaching 54.03 million people in 2020. The water resources carrying index (WRCI) of the five Central Asian countries varied considerably, with the actual population sizes of Turkmenistan and Uzbekistan highly overloaded. Although there has been a decrease in Central Asian countries’ WRCI between 1995 and 2020, water resources utilization problems in the region remain prominent. Based on the water resources carrying capacity evaluation system, to increase available water resources and improve production water use efficiency are key to address these issues. In light of this, this study offers practical and feasible solutions at the policy level: (1) The implementation of signed multilateral agreements on transboundary water resources allocation must proceed through joint governmental efforts. (2) Investments in advancing science and technology need to be increased to improve water use efficiency in irrigation systems. (3) The output of water-intensive crops should be reduced. (4) The industrial structure could be further optimized so that non-agricultural uses are the primary drivers of gross domestic product (GDP) growth.

Cite this article

LIU Wenhua , WANG Yizhuo , HUANG Jinku , ZHU Wenbin . Assessment on the sustainability of water resources utilization in Central Asia based on water resources carrying capacity[J]. Journal of Geographical Sciences, 2023 , 33(10) : 1967 -1988 . DOI: 10.1007/s11442-023-2161-3

1 Introduction

Water is essential for life and is an indispensable resource for maintaining natural ecosystems functions and supporting socioeconomic development (Zhang and Chen, 2009; Batisha, 2022; Han and Jia, 2022). Climate change and population growth intensify competition for water resources across countries and regions (Ibatullin et al., 2009; Tian and Zhang, 2020; Yan and Tan, 2020). The increasing water demand damages the ecological environment, aggravates socioeconomic problems and escalates political tensions (Bao and Fang, 2012; Dukhovny et al., 2013; Seidakhmetov et al., 2014; Berndtsson and Tussupova, 2020; Huang et al., 2021). Keeping water withdrawals in balance with socioeconomic development by improving water use efficiency will facilitate environmental sustainability and benefit human well-being in the long run.
Located in the hinterland of Eurasia, Central Asia is dominated by a distinctive continental arid and semiarid climate. The term “Central Asia” is frequently used for five ‘‘-stans’’ states of the former Soviet republics: Kazakhstan, Kyrgyzstan, Tajikistan, Turkmenistan, and Uzbekistan. As key members of the Belt and Road Initiative (B&R), these five countries play essential roles in global integration. However, the scarcity of water resources in Central Asia has raised concerns over the region's sustainable development. About 2.4 billion people worldwide were reported living in highly water-stressed areas due to the uneven temporal and spatial distribution of available renewable freshwater resources (Oki and Kanae, 2006). These conditions are more severe in Central Asia, where water resources have experienced mismanagement for extended periods (Chatalova et al., 2017).
As a consequence of global warming, the temperature in Central Asia has risen approximately twice as fast as the global average since the 1970s; it is expected to increase by 2-4℃ by 2050 for its major part (Hu et al., 2014b; Berndtsson and Tussupova, 2020). This has accelerated the evaporation rate, causing inland lakes such as the Aral Sea and Lake Balkhash to dry up, and threaten the normal water supply (Lioubimtseva and Henebry, 2009; UNEP, 2017; Duan et al., 2020; Yang et al., 2020). With the independence of Central Asian nations in 1991, major rivers in this region, including the Syr Darya River and the Amu Darya River, have become transborder rivers. Subsequently, transboundary disputes over water allocation have emerged due to conflicts between hydropower generation in Tajikistan upstream and agricultural irrigation in Turkmenistan and Uzbekistan downstream (Bernauer and Siegfried, 2012; Jalilov et al., 2013; Yu et al., 2021a). In addition, water resource allocation in Central Asia has been negatively affected by changing in land use and dam construction, which are mainly caused by population explosion and rapid urbanization (Zou et al., 2019). These situations ultimately give rise to food security concerns and hamper regional industrial development.
Reliable and adequate water supply is agreed as one of the key elements to realize the United Nations Sustainable Development Goals (SDGs), as most of the 17 SDGs are directly or indirectly affected by the increasing scarcity of water resources (Vanham et al., 2018). Two SDG indicators are often used to measure the progress towards the SDG on sustainable utilization of water resources; they include Indicators 6.4.1 and 6.4.2. Indicator 6.4.1 aims to measure water use efficiency, and Indicator 6.4.2 strives to evaluate water stress level. The integrated analysis of these two indicators could help all countries to well understand the synergies between water resources and SDGs. However, indicators 6.4.1 and 6.4.2 do not directly reveal the relationship between the sustainable use of water resources and population and economic conditions or propose improvement measures from the perspective of water resource management. To address these deficiencies, we deploy water resources carrying capacity (WRCC) to assess the sustainable utilization of water resources in the five Central Asian countries.
Resources carrying capacity was initially defined in ecology as the ability of food resources to support the population in a region (Chao et al., 2018). The resources carrying research conducted by UNESCO and FAO (1985) promoted the concept of water resources carrying capacity (WRCC). Soon after, the WRCC was first put forward in China by the Xinjiang Water Resource Soft-Science Research Group to develop a water resources development strategy in 1989 (Song et al., 2011). Under the strategic requirement that water resources determine the scale of population development, the WRCC has become one of China's mainstream water governance indicator systems (Song et al., 2021). Although given different definitions by Chinese scholars over the years, the WRCC is currently defined as the maximum socioeconomic scale available water resources can carry under various constraints (Jia et al., 2004; Cui et al., 2018). In this paper, considering about the natural and social attributes of the WRCC, we followed the principle of sustainable development and defined it as the maximum population size that a region can accommodate, given the ability of available water resources to support the economy, technology, and welfare.
In recent years, China has consistently emphasized the strategic importance of Central Asian countries in achieving SDGs. In 2017, President Xi Jinping pointed out that to jointly build the Belt and Road Initiative (B&R) is highly compatible with the UN's 2030 Agenda for sustainable development (Zhu and Chen, 2019). Central Asia is similar to Xinjiang in terms of geography and socioeconomic conditions. Located in northwest China, Xinjiang has a dry climate with an average annual precipitation of only 159 mm but with robust agricultural water requirements, leading to an extreme imbalance between water supply and demand. Many scholars have used water resources carrying capacity to evaluate water resources in Xinjiang, thereby facilitating economic development in the region (Song and Guo, 2014; Yang et al., 2016; Yu et al., 2021b). The successful research experience and methodology can be employed in Central Asia to quantitatively reveal cross-border differences and to promote sustainable development in all five countries along the Belt and Road.
In this context, this study develops an assessment model based on the water resources carrying capacity to evaluate the sustainability of water resources utilization in Central Asia. The primary research in this paper comprises four parts: Part one evaluates the water resources obtained from the FAO based on multi-source datasets; Part two presents details on the socioeconomic and water resources consumption indicators for the WRCC evaluation in Central Asia; Part three unveils the water resources security status of the five Central Asian states according to the WRCC and the water resource carrying index (WRCI); and Part four summarizes the suggestions for improving the sustainability of water resources utilization in Central Asia through the assessment model and the analysis results.

2 Study area

Located between 35°07′N-56°26′N and 46°29′E-87°19′E, Central Asia stretches from the Caspian Sea in the west to China's Xinjiang Uygur Autonomous Region in the east, and from Russia in the north to Afghanistan and Iran in the south. It consists of five countries: Kazakhstan (KAZ), Kyrgyzstan (KGZ), Tajikistan (TJK), Turkmenistan (TKM), and Uzbekistan (UZB). Covering an area of about 4 million km2, the region is rich in natural and biological resources, including oil and gas, with an astonishing variety of animals and plants. Meanwhile, it is also the home of 75,136,445 people in 2020, with a cultivated area of 38.52 million hm2. In general, Central Asia has an average altitude of 520.46 m above the sea level and is high in the southeast and is low in the northwest (Hu et al., 2014a). As shown in Figure 1a, its topography gradually rises eastward from the Caspian and Volga areas in the western part of TKM and KAZ. Because of its remoteness from the ocean and the relatively closed terrain, the climate of Central Asia is characterized by low precipitation and high evapotranspiration, especially aridity (Li et al., 2017). The average annual precipitation of the entire region is 276.48 mm. 87.74% of the area has an annual precipitation of 400 mm or less, while 36.11% of the area receives only 200 mm or less rainfall annually (Figure 1b). Due to the blocking effect of the high mountains in Central Asia, a small amount of water vapor transported from the Arctic and Atlantic Oceans can form relatively abundant precipitation on the windward slopes of the Pamir-Alay Mountains, the Tianshan Mountains, and the Altai Mountains, whereas there is less than 200 mm of precipitation annually in the areas around the Aral Sea and in some desert areas of TKM (Han et al., 2016).
Figure 1 Geographical location of Central Asia and spatial distribution of annual precipitation
Central Asia contains many lakes and several transborder rivers, among which the Amu Darya and Syr Darya are the primary irrigation water sources. The statistics from the Food and Agriculture Organization (FAO) in 2018 showed that the total renewable water resources in Central Asia amounted to 227.57 billion m3, most of which are consumed by agricultural irrigation with low water use efficiency. In addition, the spatial mismatch of water resources and land resources in Central Asia poses a challenge to water resource management (Zhiltsov et al., 2018). The runoff from KGZ and TJK accounts for about 80% of the total water resources in the Amu Darya Basin and the Syr Darya Basin; however, only 15% of the water resources are consumed by the two countries (Chen et al., 2018). Meanwhile, in the entire Aral Sea Basin, only a small part of the water resources is produced by the downstream countries, but a large amount of water is used to irrigate crops such as cotton, rice, and wheat. In particular, UZB's water resources output is only 12%, but its agricultural land area accounts for 53% of the total agricultural land area, and its population is more than 1.8 times that of KAZ (Chen et al., 2018). The massive and inefficient use of water resources, particularly in agriculture, has led to growing water scarcity in Central Asia.

3 Data and methodology

3.1 Data

This study selected and analyzed 14 parameters to explain the temporal and spatial variations of water resources, water withdrawals, socioeconomic development, and precipitation in Central Asia between 1995 and 2020. The 14 parameters are listed in Table 1. Water-related data for 1997, 2002, 2007, 2012, 2017 and 2018 were retrieved from AQUASTAT, the FAO's global information system on water resources and agricultural water management. As the data were performed with short interruption time intervals and relatively stable trends, we adopted linear interpolation to bridge any data gaps in the recorded time series (Yan et al., 2022). The data for calculating domestic water withdrawal came from a report by the Organization for Economic Cooperation and Development (2021). The national socioeconomic data for 1990-2020 were obtained directly from the World Bank Group. In addition, in order to reflect the spatial-temporal variation characteristics of precipitation in Central Asia, we used the annual precipitation grid dataset at a spatial resolution of 0.1° × 0.1° per pixel provided by the multi-source weighted-ensemble precipitation (MSWEP) product.
Table 1 Summary of the data used in this study
Parameters Temporal
coverage
Temporal
resolution
Source
Surface water produced internally 1997, 2002, 2007, 2012, 2017, 2018 Annual FAO
https://www.fao.org/aquastat/statistics/query/index.html
Groundwater produced internally
Overlap between surface water and groundwater
Total external renewable water resources
Total renewable water resources
Environmental flow requirements
Agricultural water withdrawal
Industrial water withdrawal
Municipal water withdrawal
Domestic water withdrawal 2002, 2018 Annual OECD
https://issuu.com/oecd.publishing/docs/central_asia_water_management-web
Population 1990-2020 Annual The World Bank
https://data.worldbank.org/
GDP
Per capita GDP
Precipitation 1981-2020 Annual MSWEP product
http://www.gloh2o.org/mswep/

3.2 Methodology

Since the 1960s, the massive water withdrawal from the Amu Darya and Syr Darya for irrigation has dried up the Aral Sea and raised global concerns over the sustainability of water resources utilization in Central Asia (Karthe et al., 2017; Yu et al., 2019; Zhang et al., 2020; Bissenbayeva et al., 2021). The per capita water use in Central Asia remains at an elevated level. In particular, the per capita water consumption of TKM is 13 times that of Chinese nationals (Falkenmark and Lundqvist, 1998; Varis, 2014). As an important indicator for determining water resources carrying thresholds, water resources carrying capacity (WRCC) provides a solid scientific basis for the sustainable utilization and development of water resources. Various scholars have chosen different evaluation methods to study WRCC according to the material needs of the research field, the current conditions related to the problem, and the research purpose (Li et al., 2018; Peng and Deng, 2020). Guided by “Big Earth Data in Support of the Sustainable Development Goals”, we established the conceptual framework of the WRCC evaluation system shown in Figure 2 (Guo, 2019). The WRCC, constrained by water resources, reflects not only the supporting role of water resources in economic and social development, but also the pressure of economic and social development posted on water resources. Based on meeting the requirement of environmental flow, and with economic and technological development and social welfare as constraints, this study determines the maximum population that can be carried by available water resources in the five Central Asian countries under the condition of balanced water supply and water demand.
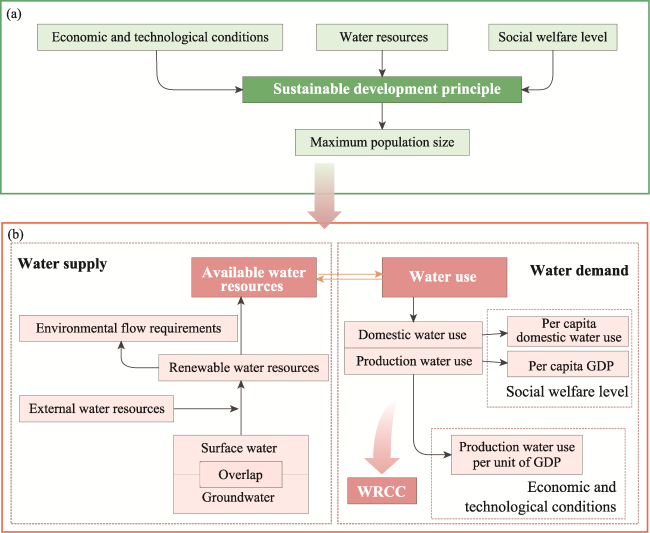
Figure 2 A conceptual framework for water resources carrying capacity in Central Asia (a. full framework; b. detail on characterizing water resources carrying capacity using data from the Food and Agriculture Organization and the World Bank)

3.2.1 Calculation of water resources carrying capacity in Central Asia

In this paper, based on the definition of “maximal bearing capacity” and available data, the WRCC can be calculated by the following equation:
$\begin{matrix} WRCC=Po{{p}_{max}} \\ \end{matrix}$
where Popmax implies the maximum population size that water resources can carry (persons), that is, the number of people that a region can bear under the condition that all accessible water resources are used for people's living and production. According to the optimization framework in Figure 2, the constraint conditions, such as available water resources, economic and technological conditions, and social welfare level, can be expressed as:
$\begin{matrix} {{W}_{AR}}\ge {{W}_{W}}={{W}_{D}}+{{W}_{P}} \\ \end{matrix}$
$\begin{matrix} {{W}_{AR}}=W-{{W}_{E}} \\ \end{matrix}$
$\begin{matrix} {{W}_{D}}={{R}_{D}}\times {{W}_{W}}/100=Pop\times {{W}_{Quot{{a}_{D}}}} \\ \end{matrix}$
$\begin{matrix} {{W}_{P}}={{W}_{A}}+{{W}_{I}}+{{W}_{S}}=GDP\times {{Q}_{P}} \\ \end{matrix}$
$\begin{matrix} pGDP=GDP/Pop\ge pGD{{P}_{min}} \\ \end{matrix}$
where WAR is the available water resources in a particular region (billion m3); WW represents the total water withdrawal (billion m3) which is composed of domestic water withdrawal (WD, billion m3) and production water withdrawal (WP, billion m3); W is the total amount of renewable water resources (billion m3) corresponding to the theoretical maximum annual water volume actually available in a country at a given time. It includes domestic produced surface water, domestic produced groundwater, the overlap between surface water and groundwater, and inbound and outbound water, as shown in Table 2. WE means environmental flow requirements (billion m3), which is the freshwater flows required to sustain freshwater ecosystems and the human livelihoods and well-being that depend on them; RD stands for the percentage of total water withdrawal devoted to domestic water withdrawal (%). In 2002, the values of KAZ, KGZ, TJK, TKM, and UZB were 4.3, 2.9, 4.9, 2.2, and 5.0, and in 2008, they were 4.8, 3.7, 6.2, 2.2, and 5.6, respectively. WQuotaD refers to the per capita domestic water withdrawal (m3/capita), which is an indicator used to measure the living standard; WA, WI and WS embody the water withdrawal for agricultural, industrial and service sectors, respectively; GDP is the actual current gross domestic product (in US dollars); QP indicates the production water consumption per unit of GDP (m3/dollar), which is a significant indicator for regional production water use efficiency; pGDP means the per capita GDP (dollar/capita), which is to measure the standard of social welfare; pGDPmin represents the minimum per capita GDP (USD/per capita). Substitute Equations 3-6 into Equation 2, and make WAR=WW in Equation 2, then the WRCC can be expressed as:
$\begin{matrix} WRCC=\frac{{{W}_{AR}}\times {{10}^{9}}}{{{W}_{Quot{{a}_{D}}}}+pGDP\times {{Q}_{P}}} \\ \end{matrix}$
In this way, it is easy to reveal the dynamic relationships between the WRCC and economic and technological conditions and social welfare level.
Table 2 General water resource conditions in Central Asia during 1995-2020 from FAO (109 m3)
KAZ KGZ TJK TKM UZB
Surface water produced internally 56.50 46.46 60.46 1.00 9.54
Groundwater produced internally 33.85 13.69 6.00 0.41 8.80
Overlap between surface water and groundwater 26.00 11.22 3.00 0.00 2.00
Total external renewable water resources 44.06 -25.31* -41.55* 23.36 32.53
Total renewable water resources 108.41 23.62 21.91 24.77 48.87
Environmental flow requirements 36.31 8.22 6.75 5.36 14.00
Available water resources 72.10 15.40 15.16 19.41 34.87

Note: * The negative sign means the difference between the country's outbound and inbound water volume, i.e., the net outbound water volume.

3.2.2 Calculation of water resources carrying index (WRCI) in Central Asia

In order to evaluate the sustainability of the WRCC, the WRCC calculated above for the five Central Asian states were compared with their actual populations during the regional study period. This study used the water resources carrying index (WRCI) to represent this ratio. The indicator can be deployed to determine whether the WRCC is in a surplus, critical, or overloaded state, detailed in Table 3. The WRCI of the regional water resources system can be defined as:
$\begin{matrix} WRCI=Pop/WRCC \\ \end{matrix}$
where Pop is the actual population size in any year. Equation 8 shows that when the WRCI is less than 1.0, the population that can be carried by water resources in the region is larger than the actual, and the volume of available water resources can support the sustainable development of the region's economy, society, and environment; when the WRCI is greater than 1.0, it means that the population that the water resources can carry in the study area is smaller than the actual. Therefore, the overpopulation phenomenon has led to a severe situation for the sustainability of water resources utilization.
Table 3 Division criterion of the WRCI in Central Asia
Basic types Sub types WRCI
Surplus Highly surplus <0.6
Moderate surplus 0.6~0.8
Lowly surplus 0.8~1.0
Critical - =1.0
Overloaded Lowly overloaded 1.0~1.2
Moderate overloaded 1.2~1.4
Highly overloaded ≥1.4

4 Results and discussion

4.1 Water resources evaluation based on multi-source datasets

The amount of water resources is the critical basis for assessing the sustainability of water resources utilization. In this paper, the water resources data of the five Central Asian countries were obtained from the FAO. However, the original data is inconsecutive in time, and some of the data were estimated by the AQUASTAT, which increased the level of uncertainty in the evaluation results. To improve the accuracy of subsequent assessments, the reliability of the FAO's water resources data must be evaluated on the basis of multi-source datasets. Therefore, we examined the temporal trends of precipitation, evapotranspiration, and runoff in Central Asia according to key water balance components and compared the data with the total amount of water resources tallied by scholars.
As illustrated in Figure 3, we mapped the temporal trend of annual precipitation in Central Asia. TJK has the most precipitation, with an average annual precipitation of 517.53 mm over the period of 1981-2020; followed by KGZ, KAZ, and UZB. TKM has the lowest annual precipitation value of 163.87 mm. In terms of the variation trend, the annual precipitation in KGZ showed a slight upward trend, with an average increase of 13.13 mm/10 year; the annual precipitation of TJK and KAZ exhibited a slight downward trend, with the average decrease of -11.82 mm/10 year and -4.34 mm/10 year, respectively; the annual precipitation of UZB and TKM were relatively stable, with average changes of -3.81 mm and -3.77 mm per decade, respectively, between 1981 and 2020. In general, from 1981 to 2020, precipitation in Central Asia changed with a gentle rate of -3.66 mm/10 year.
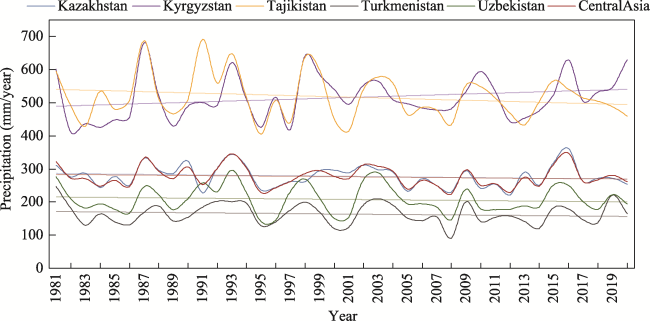
Figure 3 Changes in mean annual precipitation over Central Asia for the period 1981-2020
Additionally, during the period 1981-2012, evapotranspiration exhibited a slightly positive slope of 1.4 mm/10 year in Central Asia, far below the global average of 5.4 mm/10 year (Zhang et al., 2016; Li et al., 2017). The river runoff of the major headwater catchments in Central Asia, such as the Irtysh River Basin, Issky-Kul Basin, Amu Darya Basin, Syr Darya Basin, and Ili River Basin, presented slight increase or decrease trends since 1960. The range of increase or decrease was within 1 billion m3/10 year (Li et al., 2017; Li et al., 2022). In short, precipitation, evapotranspiration, and runoff in Central Asia have remained basically stable in recent decades. This is consistent with the FAO data, which shows that water resources in the region have remained roughly unchanged over the years.
The reliability of total renewable water resources in Central Asia was examined by reviewing published literature with data from the UN report and government statistical yearbooks and crosschecking that with the data on Knoema (an open platform for the most comprehensive source of global decision-making data in the world). As a result, the total water resources data of KAZ, KGZ, TJK, TKM and UZB used in this research were approximately the same as the statistical results in Table 4. Two scenarios were considered - with or without external renewable water resources. By comparison, it can be found that the order of total water resources in the five countries selected in this paper is basically consistent with the order described in other literature. Meanwhile, Zhang et al. (2018b), Liu and Chen (2020), and Wang et al. (2020) also used the water resources data from the FAO to analyse water resources utilization efficiency and water security. Therefore, the reliability of the water resources data from the FAO database chosen for this study is confirmed by the comparative evaluation of multi-hydrological elements and the same parameter. This means that the FAO water resources data can be used to evaluate WRCC.
Table 4 Segregated list of total renewable water resources in Central Asia along with their remarks and references (109 m3)
Remark KAZ KGZ TJK TKM UZB
Without external renewable water resources 64.351 48.931 63.461 1.411 16.341
75.402 46.502 66.802 1.402 16.302
62.443 54.004 64.005 1.406 12.207
With external renewable water resources 108.411 23.621 21.911 24.771 48.871
109.602 20.602 16.002 24.702 50.402
100.508 20.588 15.988 24.728 50.418
108.009 14.8010 21.9011 21.0012 50.00~60.007

Data source: 1 This study; 2 Deng et al., 2010; 3 Abishev et al., 2016; 4 Li et al., 2010; 5 Toderich et al., 2004; 6 Zhang et al., 2013; 7 Mukhamedieva et al., 2021; 8 Xia et al., 2013; 9 Long et al., 2010; 10 Amanaliev, 2008; 11 Knoema, 2017; 12 Issanova et al., 2017.

4.2 Indicator analysis for WRCC evaluation

4.2.1 Socioeconomic indicator analysis

The total population of Central Asia increased at a fast pace, from 50.22 million in 1990 to 75.14 million in 2020. As shown in Figure 4a, during the three decades, the population of KAZ, KGZ, TJK, TKM and UZB rose from 16.35 million, 4.39 million, 5.28 million, 3.68 million, and 20.51 million, to 18.76 million, 6.58 million, 9.54 million, 6.03 million, and 34.23 million, respectively. Among them, a decrease in population has been witnessed in KAZ since 1990 due to massive migration overseas following the country's independence. A total number of 2.758 million people left the country during the 10 years from 1991 to 2000, and it was not until 2002 that the population began to show positive growth (Long et al., 2010). This has led to a low population density of 6.88/km2 in KAZ. On the contrary, the population density of UZB is the highest (76.25/km2), placing considerable pressure on water resources.
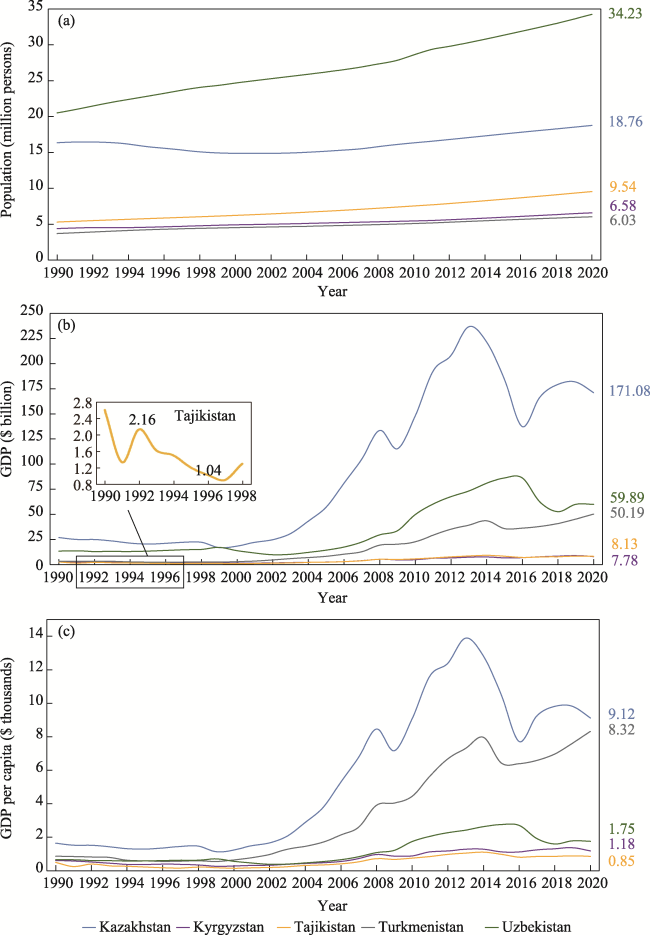
Figure 4 Temporal trends in the population (a), GDP (b) and GDP per capita (c) in Central Asia from 1990 to 2020
The disintegration of the Soviet Union gave the five Central Asian countries economic independence to a large extent. However, the centrally planned economic system implemented by the former Soviet Union has made other countries economically dependent on Moscow for a long time. As a result, after 1991, the five Central Asian countries started to face various problems and difficulties, such as severe inflation during their economic reconstruction while continuing civil wars. Central Asia experienced a period of economic recession. It can be seen from Figure 4b that the GDP of TJK dropped by more than half from 1992 to 1996. The economic downturn of the Central Asian countries was alleviated in 1996. However, due to the Russian financial crisis and the fluctuations in international raw material prices in 1998, the economy of the Central Asian countries, which tended to improve, fell to the bottom again (Chang, 2002; Wang, 2005).
Subsequently, the currency depreciation and oil price rise in 2000 underpinned the acceleration of economic growth in these countries, which are oil-rich and export-dependent (Pomfret, 2003). When the global financial crisis broke out in 2008, the sluggish world economy hindered the economic development of the five countries (Wang, 2013). In 2015, international oil and gas prices fell again, and the development of Central Asian countries that relied heavily on oil and gas resources exports suffered once again (Zhu et al., 2020). During 1990-2020, the GDP of KAZ, KGZ, TJK, TKM and UZB grew from USD 26 billion, USD 2.6 billion, USD 2.63 billion, USD 3.18 billion, and USD 13.36 billion, to over USD 170 billion, around USD 8 billion, over USD 8.13 billion, USD 50 billion, and almost USD 60 billion, respectively. Since 1990, KAZ has been veritably the biggest economy among the five Central Asian nations, with a GDP peaking at USD 236.63 billion in 2013. Nowadays, the GDP of KAZ has accounted for 57.59% of the total GDP in Central Asia, whereas the GDP of KGZ and TJK is far below the world average.
GDP per capita is a core indicator of economic performance. It is commonly used as a broad indicator to measure the average living standard or economic well-being in a country or region. The higher the per capita GDP is, the higher the national standard of living is. From the temporal changes, we can tell that from 1990 to 2020, the per capita GDP in Central Asia fell and then rose, which was similar to the GDP trend. At the current dollar rate, over the 31-year period, KGZ's per capita GDP increased by 573.35 US dollars to 1182.52 US dollars in 2020, and TJK's per capita GDP increased by 345.75 US dollars to 852.83 US dollars in 2020. These two poor countries performed slightly worse than other Central Asian countries in terms of social welfare. The economic performance of UZB was at the middle level among Central Asian countries, with the per capita GDP increasing by 1098.24 US dollars between 1990 and 2020. During the same period, both the economy and the productivity of TKM have undergone rapid growth, with per capita GDP increasing by 7455.80 US dollars to reach 8321.20 US dollars in 2020. KAZ's per capita GDP reached up to USD 9121.64 in 2020, making it the country with the highest standard of living in Central Asia; its per capita GDP surprisingly increased more than 12 times from 1999 to 2013.

4.2.2 Water use indicator analysis

From the temporal changes, we found that the total water withdrawal in Central Asia was generally stable from 1995 to 2020, and the amplitude of variations differed by country (Figure 5a). Specifically, UZB's total water withdrawal fell slightly from 59.14 billion m3 to 58.90 billion m3 over the study period. To give a close look at the 2012 data, the total water consumption of UZB reached only 52.73 billion m3 but was still higher than other countries. TKM's total water withdrawal witnessed an increase from 24.34 billion m3 to 27.95 billion m3 from 1995 to 2020, ranking second, with a mean annual of 26.90 billion m3. KAZ was close behind, with an average annual water withdrawal of 23.99 billion m3. As more irrigation areas were abandoned and industrial development slowed or even stagnated, its total water withdrawal as a whole decreased from 28.60 billion m3 to 25.03 billion m3, with 2003 being the turning point (Long et al., 2010). The upstream countries, including TJK and KGZ, had the lowest water withdrawal of 9.98 billion m3 and 8.51 billion m3, respectively. TJK's total water withdrawal declined from 10.54 billion m3 to 9.77 billion m3, and KGZ's lessened from 10.08 billion m3 to 7.66 billion m3 of the study period.
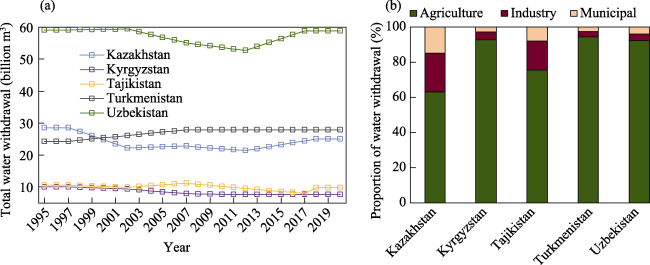
Figure 5 Temporal trends of total water withdrawal in Central Asia from 1995 to 2020 (a) and the proportion of water withdrawal in the five countries in 2020 (b)
It can be seen from Figure 5b that agricultural water was the most important water resources utilization method in all five Central Asian countries. On average, agricultural water use accounted for 83.59% of the region's total water withdrawals in 2020 (Zhang et al., 2018b). This ratio was significantly higher than the global average of 71% (Lee and Jung, 2018). To be specific, in 2020, agricultural water use of TKM, KGZ, UZB, TJK and KAZ accounted for 94.30%, 92.69%, 92.29%, 75.49% and 63.16% of their total water resources utilization, respectively. In addition, industrial and municipal water use in Central Asian countries was much lower than agricultural water use, accounting for 9.91% and 6.50% of total water consumption in the region, respectively.
Water use per unit of GDP is a critical indicator to measure water use efficiency (WUE), which refers to the economic added value generated by the volume of water withdrawn for a particular use. In Central Asia, water use per unit of GDP was generally high, indicating a low WUE. Specifically, the highest average annual water use per unit of GDP in 2020 was TJK (1.20 m3/dollar) and KGZ (0.98 m3/dollar), followed by UZB (0.98 m3/dollar), TKM (0.58 m3/dollar), and KAZ (0.15 m3/dollar), as shown in Figure 6a. Therefore, KAZ owned the highest WUE among the five countries during the study period. Generally speaking, over the past 25 years, water use per unit of GDP in Central Asia has shown a significant downward trend. For example, from 1995 to 2020, TKM's water use per unit of GDP decreased sharply by 9.25 m3/dollar due to technological progress and the decline in the proportion of agricultural water use. Therefore, to minimize water use in agricultural production and to use limited water resources for more efficient industrial and service development can improve WUE (Liu et al., 2014). In addition, although the WUE of the five Central Asian countries has shown a slight upward trend in the past ten years (2011-2020), the overall situation was relatively stable (Figure 6b).
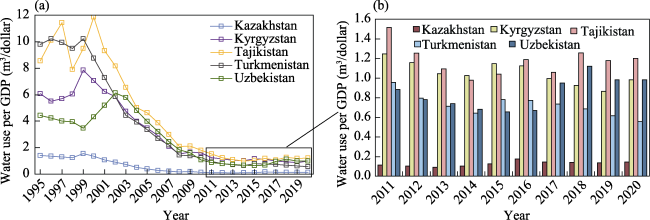
Figure 6 Temporal trends of water use per GDP in Central Asia from 1995 to 2020

4.3 Water security evaluation based on WRCC and WRCI

It can be revealed from the above section that water resources utilization in Central Asia has remained at a high level due to the region's rapid socioeconomic development since 1995. Among the five countries, UZB and TKM have consumed more water, even more than their own storage. In the last decade, the relatively slow improvements in the efficiency of water resources utilization in Central Asia have produced severe water resources situation in the region. In order to comprehensively understand the sustainable use of water resources in Central Asia, we assessed the WRCC and WRCI of the five countries. As shown in Figure 7a, the maximum population that could be carried by the water resources of the five countries in Central Asia experienced varying degrees of increase in the same period of time. According to the assessment model in this paper, and comparing various socioeconomic indicators and water use indicators, this upward trend was closely related to the significant improvement in water resources utilization efficiency.
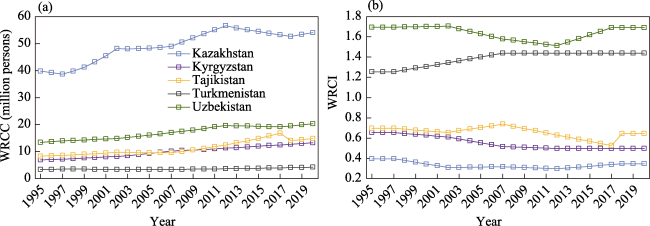
Figure 7 Temporal trends of WRCC (a) and WRCI (b) in Central Asia from 1995 to 2020
At the same time, the different economic conditions and the uneven distribution of available water resources resulted in a change in WRCC. In particular, KAZ's WRCC was substantially higher than the other four countries, peaking at 54.03 million in 2020. It was attributed to the fact that the country was rich in water resources and low in water consumption per unit of GDP. The nation with the second most available water resources was UZB. Its WRCC was 20.27 million in 2020. TJK and KGZ were similar in natural and economic conditions, which enabled the two countries to have almost identical WRCC of 14.79 million and 13.23 million, respectively. Finally, TKM carried the least population of 4.19 million in 2020 because the country suffered from severe water scarcity but maintained a high standard of living.
It can be observed that some Central Asian countries were overpopulated (Figure 7b). The country with a more serious overpopulation problem was UZB, whose WRCI averaged 1.64 between 1995 and 2020. The maximum population that could be carried by UZB was 20,266,071 in 2020. However, the country's actual population by the time was 34,232,050, which enabled a high WRCI of 1.69. Moreover, although the actual population of TKM was the least among the five countries, with only 6,031,187 people in 2020, it still exceeded the country's WRCC for that year, leading to a high WRCI of 1.44. On the contrary, due to the relatively abundant water resources and high water utilization efficiency, the WRCI of KAZ in 2020 was at a highly surplus level of 0.35. Similarly, KGZ's water resources could accommodate 6,650,337 more people in 2020, allowing for a high surplus WRCI of 0.55. The neighboring country TJK had an actual population of less than 65% of the WRCC in 2020. The average WRCI of the country showed a moderate surplus of 0.66 between 1995 and 2020.
According to temporal changes shown in Figure 7b, the WRCI for UZB, KAZ, KGZ and TJK all displayed varying degrees of decline. This meant that the sustainability of water resources development and utilization in these four countries has constantly improved over the years. However, the increasing trend of TKM's WRCI indicated that its available water resources were becoming increasingly challenging to meet the water demands of its social and economic development and people's growing living standards. Therefore, it is necessary to enact policies and adopt targeted adjustment measures to ensure that the water resources in all Central Asian countries are accessible and affordable.

4.4 WRCC regulation for sustainable development

Regulation is the combination of adjustment and control (Jin et al., 2018; Yan and Xu, 2022). The WRCC regulation aims to improve the carrying capacity of water resources through a combination of increased support and reduced load, and thereby to increase the maximum population that water resources can support in the region while ensuring people's well-being. Its connotations include enhancing carrying capacity and making it more sustainable (Gao and Liu, 1997). As demonstrated by the assessment model in this paper, increasing the available water resources and reducing the production water consumption per unit of GDP (Qp) can enlarge the water supply and lessen water demand. That is to say, the key to WRCC regulation includes not only the water resources regulation, but also the technology and industrial structure regulation (Han and Jia, 2022).
It is crucial to recognize China's successful experience in regulating WRCC and achieving the sustainability of water resources utilization in the five Central Asian countries. With the average annual precipitation of less than 200 mm/year, China's Xinjiang has scarce and unevenly distributed water resources (Yin et al., 2017). The sustainable use of water resources in Xinjiang is hindered due to the extensive economy of the region. During the 13th Five-Year Plan period (2016-2020), Xinjiang adopted a series of strategic measures to alleviate water resources security issues in the region effectively. These measures included building mountain reservoirs, optimizing planting structure, adopting drip irrigation and low-pressure sprinkler irrigation according to local conditions, strengthening agricultural water quota management and controlling the pace of agricultural development (Zhang, 2018; Zhang et al., 2018a; Fan et al., 2020; Xia et al., 2022). Drawing on the successful experience of water resources management in Xinjiang, this paper preliminarily analyzed the regulation of water resources carrying capacity when the WRCI is in a critical or surplus state. Further, it offered policy recommendations for further improving the water resources carrying capacity in Central Asia and realizing the sustainability of regional water resources utilization.
The regulation of water resources is reflected in the increase in the total amount of available water resources. Central Asia has a dry climate with scarce rainfall and severe spatial heterogeneity between water production and consumption. More specifically, about 80% of the surface runoff of the Aral Sea Basin comes from TJK and KGZ, but water resources are primarily consumed by the people downstream in TKM and UZB. In 2020, the water withdrawals of TKM and UZB accounted for 67.16% of the total water withdrawals of five Central Asian countries. Therefore, this study sought to alleviate the contradictions in water resources utilization in the five Central Asian countries by increasing the available water resources of TKM and UZB, that is, inbound water resources.
Using reverse calculation, if the WRCI reached 1.0 in 2020, TKM and UZB would have to divert at least 8.54 million m3 and 24.03 million m3 of water, respectively, which accounted for 7.36% and 20.71% of the surface water resources in the Aral Sea Basin. Based on these results, we put forward the following suggestions and recommendations: (1) The governments of Central Asian countries should strengthen mutual trust, find a balance of interests between countries, and promote the implementation of signed agreements. (2) The international community must increase technical, financial, and human support to facilitate the active fulfilment of relevant agreements by Central Asian countries. (3) The five Central Asian countries are required to strengthen the sharing of academic achievements, enhance the monitoring and scheduling of modern water resources, promote the construction of mountain reservoirs and anti-seepage water irrigation projects, reduce ineffective evaporation from water surface, and carry out practical water management measures.
To achieve the sustainability of water resources utilization, we could increase the input by regulating available water resources on the one hand and reduce the output by adjusting water use efficiency on the other hand. Furthermore, in order to maintain the existing level of domestic water use, we should focus on reducing production water consumption per unit of GDP. It can be seen from Table 5 that, in an effort to carry the actual population, the QP of TKM and UZB in 2020 should have been 0.37 m3/dollar and 0.53 m3/dollar, which was lower than the current levels of 31.48% and 43.01%, respectively. Even to keep WRCI at a moderate surplus level, the QP of UZB in 2015 should be as low as 0.21 m3/dollar, which was undoubtedly challenging. However, the Central Asian countries with high water use efficiency like KAZ, have achieved such production water use efficiency. Therefore, the proposed QP targets for TKM and UZB should be achievable in theory. Based on this assumption, we have made the following suggestions: (1) The five Central Asian countries should vigorously develop science and technology, establish a quota management system for irrigation water consumption and maintain water conservancy facilities in a timely manner. (2) Water-intensive agricultural products can be purchased from water-rich countries and regions in order to reduce the domestic output of water-intensive crops so as to save water resources in the five countries. (3) Industrial structure is ought to be optimized by reducing the contribution of agricultural production to GDP while increasing the proportion of industry and service industries, as the marginal benefit of water use in agriculture is lower than that of industry and service industries.
Table 5 The production water use per unit of GDP (m3/dollar) of TKM and UZB according to the change of the WRCI
Year TKM Critical (1.0) Lowly surplus (0.8) Moderate surplus (0.6) KAZ KGZ TJK
1995 9.59 7.60 6.04 4.48 1.34 5.89 8.14
2000 8.55 6.49 5.15 3.82 1.30 6.85 11.26
2005 3.28 2.32 1.84 1.36 0.38 3.36 4.38
2010 1.21 0.83 0.66 0.49 0.14 1.57 1.71
2015 0.76 0.53 0.42 0.31 0.14 1.11 0.98
2020 0.54 0.37 0.30 0.22 0.14 0.95 1.13
Year UZB Critical (1.0) Lowly surplus (0.8) Moderate surplus (0.6) KAZ KGZ TJK
1995 4.12 2.39 1.87 1.35 1.34 5.89 8.14
2000 4.10 2.32 1.81 1.30 1.30 6.85 11.26
2005 3.77 2.23 1.75 1.26 0.38 3.36 4.38
2010 1.02 0.64 0.50 0.36 0.14 1.57 1.71
2015 0.62 0.37 0.29 0.21 0.14 1.11 0.98
2020 0.93 0.53 0.41 0.29 0.14 0.95 1.13

5 Conclusions

Based on the SDG 6.4.1 and 6.4.2 indicators, this study evaluated water resources carrying capacity (the maximum population available water resources can support). It selected water resources and socioeconomic data from the datasets of FAO and the World Bank to study the sustainability of water resources utilization in Central Asia. Through the research, we found that economic and technological conditions as well as social welfare level are potential drivers of the sustainable utilization of water resources. It can be concluded that:
(1) After the collapse of the Soviet Union, the five Central Asian countries became independent and experienced economic recession from 1990 to 2000. With a growing population and rising oil and gas prices, the economy of the five Central Asian countries bottomed out after the 2001 global monetary crisis. From 1995 to 2020, the total water withdrawals in Central Asia were generally stable, and the region consumed more water for agriculture. Among the five countries, KAZ had relatively abundant water resources, low agricultural water use and the highest WUE. In contrast, KGZ and TJK had the lowest WUE. In general, the WUE of all five countries was seen significant improvement between 1995 and 2020, which was conducive to the sustainable utilization of water resources in the region.
(2) This study evaluated the WRCC in Central Asia from 1995 to 2020. The results showed that the WRCC of KAZ was significantly higher than that of the other four countries. The WRCC of the five Central Asian countries presented an upward trend during the study period due to improved WUE. There were obvious differences in the WRCI of the five Central Asian countries. KAZ and KGZ experienced a significant surplus, TJK had a moderate surplus, and water resources in TKM and UZB were severely overextended. Since 1995, the sustainability of water resources development and utilization in Central Asia has improved continuously.
(3) Currently, the sustainability of water resource utilization in Central Asia should mainly focus on increasing the available water sources and improving the efficiency of water use in production. Through inverse calculation, TKM and UZB in 2020 could alleviate water scarcity by diverting 8.54 million m3 and 24.03 million m3 of water resources or reducing the production water use per unit of GDP to 0.37 m3/dollar and 0.53 m3/dollar, respectively. Given this, governments and international organizations should jointly promote the implementation of signed agreements on transboundary water resource allocation. The Central Asian countries should vigorously develop science and technology to improve their irrigation systems, reduce the output of water-intensive crops, transform industrial structures by increasing the proportion of industry and services contributing to GDP, and optimize water resources management for the maximization of water utilization efficiency. To achieve these goals, the water resources carrying capacity must be systematically improved to make water resources sustainable for economic and social development.
[1]
Abishev I A, Medeu A R, Malkovskiy I M et al., 2016. Water resources of Kazakhstan and their use. Journal of Water Economy of Kazakhstan, 71(3): 6-15.

[2]
Amanaliev M, 2008. Water resources management system of Kyrgyzstan. In: Sustainable Use and Development of Watersheds. Dordrecht: Springer, 61-80.

[3]
Bao C, Fang C, 2012. Water resources flows related to urbanization in China: Challenges and perspectives for water management and urban development. Water Resources Management, 26(2): 531-552.

DOI

[4]
Batisha A, 2022. Horizon scanning process to foresight emerging issues in Arabsphere's water vision. Scientific Reports, 12(1): 12709.

DOI PMID

[5]
Bernauer T, Siegfried T, 2012. Climate change and international water conflict in Central Asia. Journal of Peace Research, 49(1): 227-239.

DOI

[6]
Berndtsson R, Tussupova K, 2020. The future of water management in Central Asia. Water, 12(8): 2241.

DOI

[7]
Bissenbayeva S, Abuduwaili J, Saparova A et al., 2021. Long-term variations in runoff of the Syr Darya River Basin under climate change and human activities. Journal of Arid Land, 13(1): 56-70.

DOI

[8]
Chang Q, 2002. Ten years of independence of five Central Asian countries: Achievements and problems. Russian, East European & Central Asian Studies, 26(1): 71-76. (in Chinese)

[9]
Chao Z, Song X, Feng X, 2018. Concept and connotation of water resources carrying capacity in water ecological civilisation construction. IOP Conference Series: Earth and Environmental Science, 111: 012003.

[10]
Chatalova L, Djanibekov N, Gagalyuk T et al., 2017. The paradox of water management projects in Central Asia: An institutionalist perspective. Water, 9(4): 300.

DOI

[11]
Chen Y, Li Z, Fang G et al., 2018. Large hydrological processes changes in the transboundary rivers of Central Asia. Journal of Geophysical Research: Atmospheres, 123(10): 5059-5069.

[12]
Cui Y, Feng P, Jin J et al., 2018. Water resources carrying capacity evaluation and diagnosis based on set pair analysis and improved the entropy weight method. Entropy, 20(5): 359.

DOI

[13]
Deng M, Long A, Zhang Y et al., 2010. Assessment of water resources development and utilisation in the five Central Asia countries. Advances in Earth Science, 25(12): 1347-1356. (in Chinese)

[14]
Duan W, Zou S, Chen Y et al., 2020. Sustainable water management for cross-border resources: The Balkhash Lake Basin of Central Asia, 1931-2015. Journal of Cleaner Production, 263: 121614.

DOI

[15]
Dukhovny V A, Sokolov V I, Ziganshina D R, 2013. Integrated water resources management in Central Asia, as a way of survival in conditions of water scarcity. Quaternary International, 311: 181-188.

DOI

[16]
Falkenmark M, Lundqvist J, 1998. Towards water security: Political determination and human adaptation crucial. Natural Resources Forum, 22(1): 37-51.

DOI

[17]
Fan M, Xu J, Chen Y et al., 2020. How to sustainably use water resources: A case study for decision support on the water utilisation of Xinjiang, China. Water, 12(12): 3564.

DOI

[18]
Gao Y, Liu C, 1997. Limit analysis on the development and utilisation of regional water resources. Journal of Hydraulic Engineering, 29(8): 73-79. (in Chinese)

[19]
Guo H, 2019. Big Earth Data in Support of the Sustainable Development Goals. Beijing: Science Press and EDP Sciences.

[20]
Han Q, Luo G, Li C et al., 2016. Simulated grazing effects on carbon emission in Central Asia. Agricultural and Forest Meteorology, 216: 203-214.

DOI

[21]
Han Y, Jia S, 2022. An assessment of the water resources carrying capacity in Xinjiang. Water, 14(9): 1510.

DOI

[22]
Hu R, Jiang F, Wang Y et al., 2014a. Arid ecological and geographical conditions in five countries of Central Asia. Arid Zone Research, 31(1): 1-12. (in Chinese)

[23]
Hu Z, Zhang C, Hu Q et al., 2014b. Temperature changes in Central Asia from 1979 to 2011 based on multiple datasets. Journal of Climate, 27: 1143-1167.

DOI

[24]
Huang W, Duan W, Chen Y, 2021. Rapidly declining surface and terrestrial water resources in Central Asia driven by socio-economic and climatic changes. Science of The Total Environment, 784: 147193.

DOI

[25]
Ibatullin S, Yasinskiy V, Mironenkov A, 2009. The impact of climate change on water resources in Central Asia. Eurasian Development Bank, Sector Report, ( 6).

[26]
Issanova G, Kaldybayev A, Temirbayeva K, 2017. Water availability in water-economic basins in Kazakhstan and their anthropogenic transformation. Journal of Geography and Environmental Management, 46(3): 58-64.

DOI

[27]
Jalilov S M, Amer S A, Ward F A, 2013. Water, food, and energy security: An elusive search for balance in Central Asia. Water Resources Management, 27(11): 3959-3979.

DOI

[28]
Jia S, Zhou C, Yan H et al., 2004. Estimation of usable water resources and carrying capacity in Northwest China. Advances in Water Science, 15(6): 801-807. (in Chinese)

[29]
Jin J, Dong T, Li J et al., 2018. Water resources carrying capacity evaluation method under different carrying standards. Advances in Water Science, 29(1): 31-39. (in Chinese)

[30]
Karthe D, Abdullaev I, Boldgiv B et al., 2017. Water in Central Asia: an integrated assessment for science-based management. Environmental Earth Sciences, 76(20): 690.

DOI

[31]
Knoema, 2017. World Data Atlas. https://knoema.com/atlas/Tajikistan/topics/Water/Total-Renewable-Water-Resources/Renewable-water-resources.

[32]
Lee S O, Jung Y, 2018. Efficiency of water use and its implications for a water-food nexus in the Aral Sea Basin. Agricultural Water Management, 207: 80-90.

DOI

[33]
Li X, Deng M, Long A et al., 2010. Analysis of water resources development in Kyrgyzstan and water problems. Advances in earth science, 25(12): 1368-1375. (in Chinese)

[34]
Li Y, Yang Y, Yan H et al., 2018. Research methods of water resources carrying capacity: Progress and prospects. Journal of Resources and Ecology, 9(5): 455-460.

DOI

[35]
Li Z, Chen Y, Fang G et al., 2017. Multivariate assessment and attribution of droughts in Central Asia. Scientific Reports, 7(1): 1316.

DOI PMID

[36]
Li Z, Li Y, Li H et al., 2022. Analysis of drought change and its impact in Central Asia. Advances in Earth Science, 37(1): 37-50. (in Chinese)

DOI

[37]
Lioubimtseva E, Henebry G M, 2009. Climate and environmental change in arid Central Asia: Impacts, vulnerability, and adaptations. Journal of Arid Environments, 73(11): 963-977.

DOI

[38]
Liu H, Lv G, He X et al., 2014. Evaluation of virtual water strategy in Turkmenistan. Journal of Economics of Water Resources, 32(6): 7-11, 24, 69. (in Chinese)

[39]
Liu Z, Chen S, 2020. Analysis of water resources and their utilization in countries targeted by the “Belt and Road” Initiative. Arid Zone Research, 37(4): 809-818. (in Chinese)

[40]
Long A, Deng M, Li X et al., 2010. An analysis of water resources development in Kazakhstan and water problems. Advances in Earth Science, 25(12): 1357-1366. (in Chinese)

[41]
Meng L, Chen Y, Li W, 2008. Study of water resources carrying capacity in Tarim River Basin of Xinjiang. Journal of Desert Research, 28(1): 185-190. (in Chinese)

[42]
Mukhamedieva I B, Rakhimova D K, Khalilova B A, 2021. Use and protection of water resources in Uzbekistan: Current state and development paths. Advances in Science and Education, 75(3): 10-12.

[43]
OECD, 2021. The use and management of water resources in Central Asia: A consultation of future directions. GREEN Action Task Force. https://issuu.com/oecd.publishing/docs/central_asia_water_management-web.

[44]
Oki T, Kanae S, 2006. Global hydrological cycles and world water resources. Science, 313(5790): 1068-1072.

DOI PMID

[45]
Peng T, Deng H, 2020. Comprehensive evaluation on water resource carrying capacity based on DPESBR framework: A case study in Guiyang, southwest China. Journal of Cleaner Production, 268: 122235.

DOI

[46]
Pomfret R, 2003. Economic performance in Central Asia since 1991: Macro and micro evidence. Comparative Economic Studies, 45(4): 442-465.

DOI

[47]
Seidakhmetov M, Alzhanova A, Baineeva P et al., 2014. Mechanism of trans boundary water resources management for Central Asia countries. Procedia: Social and Behavioral Sciences, 143: 604-609.

[48]
Song D, Guo H, 2014. Comprehensive evaluation of the carrying capacity of Xinjiang water resources based on AHP and entropy method. Journal of Nanning Normal University (Natural Science Edition), 31(3): 57-64. (in Chinese)

[49]
Song X, Kong F, Zhan C, 2011. Assessment of water resources carrying capacity in Tianjin city of China. Water Resources Management, 25(3): 857-873.

DOI

[50]
Song Z, Le Q, Chen X et al., 2021. A preliminary study on evaluating method of water resources’ carrying capacities of China and its application. Sedimentary Geology and Tethyan Geology, 41(1): 106-111. (in Chinese)

[51]
Tian J, Zhang Y, 2020. Detecting changes in irrigation water requirement in Central Asia under CO2 fertilization and land use changes. Journal of Hydrology, 583: 124315.

DOI

[52]
Toderich K, Tsukatani T, Abbdusamatov M, 2004. Water resources assessment, irrigation and agricultural developments in Tajikistan. KIER Discussion Paper, 585.

[53]
UNEP, 2017. Climate change is threatening access to water and farming in Central Asia-but solutions are at hand. https://www.unep.org/news-and-stories/news/climate-change-threatening-access-water-and-farming-central-asia-solutions.

[54]
UNESCO FAO, 1985. Carrying capacity assessment with a pilot study of Kenya: A resource accounting methodology for sustainable development. UNESCO: Paris, France; FAO: Rome, Italy.

[55]
Vanham D, Hoekstra A Y, Wada Y, 2018. Physical water scarcity metrics for monitoring progress towards SDG target 6. 4: An evaluation of indicator 6.4.2 “Level of water stress”. Science of The Total Environment, 613/614: 218-232.

DOI

[56]
Varis O, 2014. Resources: Curb vast water use in central Asia. Nature, 514(7520): 27-29.

DOI

[57]
Wang H, 2005. Analysis of the trend of economic development in five Central Asian countries. Xinjiang Social Science Forum, 31(4): 16-22. (in Chinese)

[58]
Wang H, 2013. Comparison and prospect analysis of the economic situation of Central Asian countries before and after the Financial Crisis. Journal of Xinjiang Normal University (Edition of Philosophy and Social Sciences), 34(4): 42-51. (in Chinese)

[59]
Wang X, Chen Y, Li Z et al., 2020. Development and utilization of water resources and assessment of water security in Central Asia. Agricultural Water Management, 240: 106297.

DOI

[60]
Xia Q, Chen Y, Zhang X et al., 2022. Identifying reservoirs and estimating evaporation losses in a large arid inland basin in Northwestern China. Remote Sensing, 14(5): 1105.

DOI

[61]
Xia Z, Li Q, Guo L, 2013. Sustainable Development Strategy of Xinjiang on Water Resources:Water Resources Utilization and Lessons Learned Abroad Arid Regions. Beijing: China Water Power Press. (in Chinese)

[62]
Yan B, Xu Y, 2022. Evaluation and prediction of water resources carrying capacity in Jiangsu province, China. Water Policy, 24(2): 324-344.

DOI

[63]
Yan D, Zhang X, Qin T et al., 2022. A data set of distributed global population and water withdrawal from 1960 to 2020. Scientific Data, 9(1): 640.

DOI PMID

[64]
Yan Z, Tan M, 2020. Changes in agricultural virtual water in Central Asia, 1992-2016. Journal of Geographical Sciences, 30(11): 1909-1920.

DOI

[65]
Yang L, Li B, Fu Q, 2016. Scenario analysis of water resources carrying capacity in Xinjiang based on BP neural network model. Journal of Beijing Normal University (Natural Science), 52(2): 216-222. (in Chinese)

[66]
Yang X, Wang N, Chen A et al., 2020. Changes in area and water volume of the Aral Sea in the arid Central Asia over the period of 1960-2018 and their causes. Catena, 191: 104566.

DOI

[67]
Yin G, Li L, Meng X et al., 2017. A research of precipitation trend and fluctuation in Xinjiang from 1979 to 2013. Journal of North China University of Water Resources and Electric Power (Natural Science Edition), 38(5): 19-27. (in Chinese)

[68]
Yu P, Shang M, Yao M et al., 2021a. Water resources carrying capacity evaluation based on water footprint and principal component analysis in Xinjiang. Journal of China Hydrology, 41(1): 49-54, 34. (in Chinese)

[69]
Yu Y, Chen X, Malik I et al., 2021b. Spatiotemporal changes in water, land use, and ecosystem services in Central Asia considering climate changes and human activities. Journal of Arid Land, 13(9): 881-890.

DOI

[70]
Yu Y, Pi Y, Yu X, 2019. Climate change, water resources and sustainable development in the arid and semi-arid lands of Central Asia in the past 30 years. Journal of Arid Land, 11(1): 1-14.

DOI

[71]
Zhang H, Jin G, Yu Y, 2018a. Review of river basin water resource management in China. Water, 10(4): 425.

DOI

[72]
Zhang J, Chen Y, Li Z, 2018b. Assessment of efficiency and potentiality of agricultural resources in Central Asia. Journal of Geographical Sciences, 28(9): 1329-1340.

DOI

[73]
Zhang N, 2018. High-efficient water-saving irrigation development and 13th Five-Year Plan in Xinjiang Uygur Autonomous Region. China Water Resources, 13: 36-38, 45. (in Chinese)

[74]
Zhang S, Chen J, 2009. Research on the risk of water resources shortage in North China. Journal of Natural Resources, 24(7): 1192-1199. (in Chinese)

[75]
Zhang W, Liu Z, Yao J et al., 2013. Water and soil resources characteristics and exploitation in Turkmenistan. Journal of Anhui Agricultural Sciences, 41(24): 10081-10083, 10197. (in Chinese)

[76]
Zhang Y, Li Y, Sun J et al., 2020. Optimizing water resources allocation and soil salinity control for supporting agricultural and environmental sustainable development in Central Asia. Science of the Total Environment, 704: 135281.

DOI

[77]
Zhang Y, Peña-Arancibia J L, McVicar T R et al., 2016. Multi-decadal trends in global terrestrial evapotranspiration and its components. Scientific Reports, 6(1): 19124.

DOI

[78]
Zhiltsov S, Zonn I, Kostianoy A et al., 2018. Water Resources in Central Asia:International Context. Springer International Publishing.

[79]
Zhu H, Zhang Q, Zhang S, 2020. Spatial and temporal characteristics of socio-economic development in Central Asia based on a series of nighttime light images from 1992 to 2017. Journal of Geo-information Science, 22(7): 1449-1462. (in Chinese)

[80]
Zhu L, Chen Y, 2019. Integrating Belt and Road Initiative with UN 2030 Sustainable Development Agenda: Connotations and routes. World Economics and Politics, (4): 79-100, 158. (in Chinese)

[81]
Zou S, Jilili A, Duan W et al., 2019. Human and natural impacts on the water resources in the Syr Darya River Basin, Central Asia. Sustainability, 11(11): 3084.

DOI

Outlines

/