Research Articles

Geochemical features and their implication of provenances of riparian dunes in the northern China deserts

  • LI Xiaomei , 1 ,
  • LIU Xiaokang , 1, * ,
  • YAN Ping 2 ,
  • DONG Miao 3
Expand
  • 1. School of Geography and Tourism, Shaanxi Normal University, Xi’an 710119, China
  • 2. State Key Laboratory of Earth Surface Processes and Resource Ecology, Faculty of Geographical Science, Beijing Normal University, Beijing 100875, China
  • 3. Institute of Geographical Science, Taiyuan Normal University, Jinzhong 030619, Shanxi, China
*Liu Xiaokang (1989-), Associate Professor, E-mail:

Li Xiaomei (1979-), Associate Professor, specialized in aeolian geomorphology. E-mail:

Received date: 2022-09-16

  Accepted date: 2023-04-21

  Online published: 2023-10-08

Supported by

National Natural Science Foundation of China(41871010)

National Natural Science Foundation of China(41901094)

National Natural Science Foundation of China(41801004)

The Second Comprehensive Scientific Expedition to the Qinghai-Tibet Plateau(2019QZKK0906)

Abstract

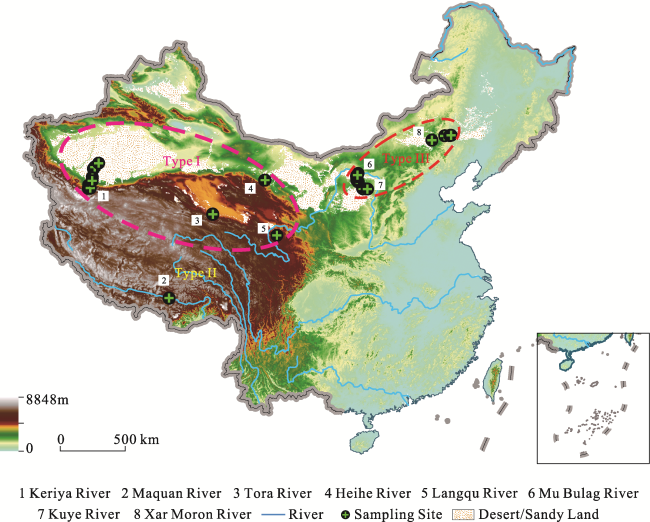
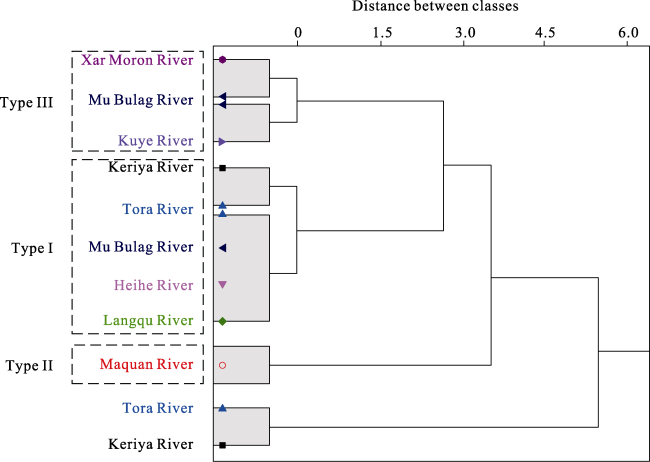
Rivers in deserts present unique geographical features owing to aeolian-fluvial interactions. In this study, 510 surface sediment samples were gathered from eight watersheds to systematically examine the major element characteristics of riparian sand dunes in northern China deserts. The findings revealed that these dunes could be categorized into three primary zones: Type I, comprising Keriya, Tora, Heihe, and Langqu rivers in the west; Type II, featuring the Maquan River in the Tibetan Plateau; and Type III, including Mu Bulag, Kuye, and Xar Moron rivers in the east. Specifically, the Type III region is characterized by a limited fresh material supply, a relatively high Chemical Index of Alteration (CIA), and the influence of nearby rivers on the provenance of riparian dunes, leading to a higher degree of chemical weathering than that of Type I in the west. Notably, Type II is marked by weak-moderate chemical weathering degree and a comparatively higher CIA value. These classifications and their difference of degree of chemical weathering are possibly governed by the type of parent rock and the availability of material. This research offers new insights into the classification of riparian dunes impacted by aeolian-fluvial interactions in arid regions of the northern China deserts. Furthermore, it provides valuable implications for studies focusing on the provenance of sediments.

Cite this article

LI Xiaomei , LIU Xiaokang , YAN Ping , DONG Miao . Geochemical features and their implication of provenances of riparian dunes in the northern China deserts[J]. Journal of Geographical Sciences, 2023 , 33(9) : 1921 -1938 . DOI: 10.1007/s11442-023-2159-x

1 Introduction

Riparian dunes, which are typical aeolian geomorphological features, extensively develop along riverbanks and superimpose on riverine landforms in arid and semi-arid regions. The surface sediments of these dunes are generally influenced by both wind and water actions, or aeolian-fluvial interactions (Bullard and Mctainsh, 2003; Song et al., 2006). Consequently, the characteristics of these sediments vary at different scales across distinct parts of the landform (Dong et al., 2012; Zhu et al., 2014; Li et al., 2022). Previous research has demonstrated that rivers, as fundamental features of desert evolution (Yan et al., 2015), can disrupt the self-organizing development of dune geomorphology (Ewing et al., 2015). For example, rivers in arid regions govern the spatial distribution of dunes by supplying sediment sources and depositional spaces (Jin and Dong, 2001; Bullard and McTainsh, 2003; Draut, 2012; Zhang et al., 2023). In fact, these aeolian-fluvial interactions can be observed in numerous aspects, particularly in their implications and significance for researching sediment provenance.
In northern China, elemental, isotopic, and mineralogical evidence of sediments indicate that the provenance of aeolian sediments is characterized by the initial grain sizes of source materials (Xu et al., 2011; Zhu et al., 2014; Liu and Coulthard, 2017; Zhu, 2022) and is typically considered to be transported from the Central Asian Orogenic Belt (CAOB) and the deserts along the northern edges of the Tibetan Plateau with dual-source characteristics (Chen et al., 2007; Yang et al., 2007; Chen and Li, 2011; Zhao et al., 2014; Hu and Yang, 2016). However, a detailed and systematic comparison of major elements in riparian environments across various deserts is still relatively scarce. Existing research primarily suggests that variations in these elements are chiefly influenced by factors such as parent rock compositions, weathering, denudation, sorting, and post-depositional changes in source composition (Smalley, 1995; Bauluz et al., 2000; Yao et al., 2002). It is widely accepted that a systematic comparison of major elements in desert riparian dune sediments will reveal the geochemical features of riparian dunes in deserts, thereby aiding in understanding the provenance of riparian dunes in arid regions under the influence of aeolian-fluvial interactions.
In this study, the composition and geochemical characteristics of major elements in desert riparian dunes in northern China (hereinafter referred to as ‘riparian dunes’) are examined based on field research and sampling. These features are also categorized into several types. The impact of aeolian-fluvial interactions on the development of landforms in arid regions holds theoretical importance. Therefore, the primary objective of this research is to comprehend the responses of aeolian sand influence on the spatial patterns of surface sediments.

2 Materials and methods

2.1 Regional setting

For this research, eight riparian dunes along rivers in typical northern China deserts were selected, including the Taklimakan Desert-Keriya River (Figure 1, No.1), Tibetan Plateau sandy land-Maquan River (Figure 1, No.2), Qaidam Basin Desert-Tora River (Figure 1, No.3), Badain Jaran Desert-Heihe River (Figure 1, No.4), Gonghe Basin sandy land-Langqu River (Figure 1, No.5), Hobq Desert-Mu Bulag River (Figure 1, No.6), Mu Us Sandy Land-Kuye River (Figure 1, No.7), and Horqin Sandy Land-Xar Moron River (Figure 1, No.8) from west to east. Their geographic locations are illustrated in Figure 1, and an overview of the study area is provided in Table 1.
Figure 1 The desert rivers and the locations of surface samples in northern China. Thereinto, (1) The Western riparian dunes include 1-Keriya and 3-Tora rivers; (2) The Central-western riparian dunes include 4-Heihe and 5-Langqu rivers; (3) The Central-eastern riparian dunes include 6-Mu Bulag and 7-Kuye rivers; (4) The East riparian dunes in northeastern region include 8-Xar Moron River; (5) The Tibetan Plateau riparian dunes include 2-Maquan River. The detailed classification basis of different riparian dunes types is based on the geochemical features. See the details in Table 4.

(Note: Figure 1 is based on the standard map (GS(2019)1832) downloaded from the standard map service website of the Ministry of Natural Resources, and the base map is unmodified.)

Table 1 The basic information of study areas
River Length (km) Basin area
(km2)
Characteristics of
drainage system
Climate pattern Desert/sandy land features Images of the sampling transects
1-Keriya 800 39500 It originates from the north slope of Kunlun Mountains, and disappears in the hinterland of Taklimakan Desert. The channel is highly curved. Extreme arid climate. The annual average temperature is about 11.6℃, and the annual precipitation is about 44.7 mm. The high mobile dunes on both sides of the river are widely developed.
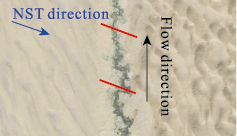
2-Maquan 180 9200 It originates from the northern slope of the western Himalaya, which is the source reaches of the Yarlung Zangbo River. The channels are reticulated. Alpine semi-arid climate. The annual average temperature is about 1.5℃, and the annual precipitation is about 131.6 mm. There are huge crescent dunes and dune chains, beach sand dunes and climbing dunes in Maquan River Valley.
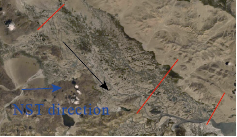
3-Tora 140 800 It originates from the Sasongwula Mountains in the Kunlun Mountains and flows into the salt lake. It is an intermittent river. Extreme arid climate. The annual average temperature is about 7.04℃, and the annual precipitation is about 44.0 mm. The wind erosion and aeolian deposition are obvious, and the aeolian landforms such as high crescent dunes are formed.
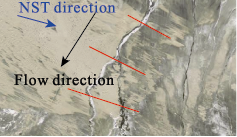
4-Heihe 821 130000 It originates from the north slope of Qilian Mountain, and disappears in the eastern desert of the Ejina alluvial fan. The channel is curved. Extreme arid climate. The annual average temperature is about 2℃, and the annual precipitation is about 36.6 mm. The quicksand belt on both sides of the middle reaches of Heihe basin is dominated of semi fixed sand dunes.
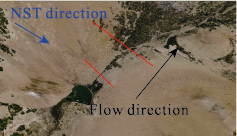
5-Langqu 58 100 It originates from the Huangnan Mountain in eastern Qinghai province, which flows into the Dabu River, belonging to four level tributaries of the Yellow River. The channel is curved. Semi-arid climate. The annual average temperature is about 1℃, and the annual precipitation is about 360 mm. The river course is winding, and the mobile sand dunes on both banks are distributed symmetrically.
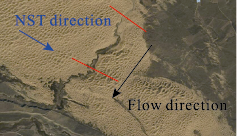
6-Mu Bulag 111 1300 It originates in Amenchijihko of Hangchin banner, Inner Mongolia, and flows into the Yellow River. The channel is more curved of desert reaches. Semi-arid climate. The annual average temperature is about 5.9℃, and the annual precipitation is about 241.1 mm. The high mobile dunes on both sides of the river are widely developed in the Hobq Desert river section.
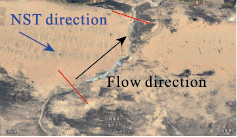
7-Kuye 242 8710 It originates from in Dongsheng district, Ordos city, Inner Mongolia, and flows into the Yellow River. It belongs to the confluence of three branches. Arid and semi-arid climate. The annual average temperature is about 11.6℃, and the annual precipitation is 350-450 mm. The sand dunes are distributed in the confluence of rivers, which is “three rivers with one sand”.
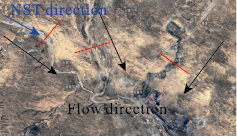
8-Xar Moron 397 32600 It originates from Baicha Mountain in Hexigten Banner, Inner Mongolia, and flows into the Xiliao River. The channels are braided. Semi-humid climate. The annual average temperature is about 5-7℃, and the annual precipitation is about 400 mm. The middle reach is mainly hilly sandy landform area, the sand dunes are mostly fixed and semi fixed dunes, and the mobile dunes are mainly near the river.

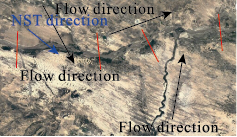
Notes: NST means net sand transport.

2.2 Research methods

Periodic monitoring and sampling at the eight study locations were determined based on the spatial distribution of riparian dunes to conduct a comprehensive investigation. A section at the middle and lower rivers, perpendicular to the river flow direction, was selected using remote sensing images from Google Earth (Table 1). Sediment samples were collected from shallow depths of up to 5 cm from floodplain surfaces and river terrace dunes along the sections. Roughly 500 to 1000 g of dune chain samples were gathered from the dune tops. Detailed documentation was made regarding the sampling locations, surrounding landforms, deposit features, and vegetation coverage. A total of 510 dune surface sediments were sampled from the study sites, with 73, 54, 63, 56, 34, 67, 101, and 62 samples collected from the Keriya River, Maquan River, Tora River, Heihe River, Langqu River, Mu Bulag River, Kuye River, and Xar Moron River, respectively.
Chemical element analysis of bulk sediment samples was conducted at the Northwest Institute of Eco-Environment and Resources, Chinese Academy of Sciences, and the School of Geography and Tourism, Shaanxi Normal University, China. Chemical elements were analyzed using X-ray fluorescence spectrometry, with samples prepared using the pressed pellet method. All samples were air-dried at room temperature and subsequently ground to pass a 75-µm sieve using a grinding mill to meet the sample pressure requirement. Four grams of the sample were oven-dried at 105℃ and placed in a sample preparation mold. Boric acid was used to edge the sample, which was then placed at the bottom of the sample well, and a circular sample with an external diameter of 32 mm was produced under 30 t of pressure. XRF analysis was performed using an Axios Sequential Wavelength Dispersive X-Ray Fluorescence Spectrometer (Panaco, Netherlands), with an error of <5%. Major elements are expressed as oxide percentages; for the calculation of oxide ratios and weathering parameters, the element contents were converted to molar mass percent.
Several chemical weathering indices were calculated in this study. The Chemical Index of Alteration (CIA = Al2O3/(Al2O3 + CaO* + Na2O + K2O) × 100) is employed to evaluate the degree of weathering in the source region and serves as a valuable quantitative index reflecting the weathering process of silicate minerals (Nesbitt et al., 1980; Nesbitt and Young, 1982). In this context, CaO* refers exclusively to the amount of CaO incorporated in silicates, and we utilized the indirect method of Mclennan (Mclennan, 1993), which assumes CaO/Na2O ratios that are reasonable for silicate material. If CaO ≤ Na2O in terms of molar fractions, the value of CaO is accepted. However, if CaO ≥ Na2O, then CaO* = Na2O. The Chemical Proxy of Alteration (CPA = Al2O3/(Al2O3 + Na2O) × 100) (Harnois, 1988; Buggle et al., 2011) and A-CN-K value (Nesbitt and Young, 1996; Chen et al., 2001; Xu et al., 2011) are utilized to indicate the degree of chemical weathering.
Principal Component Analysis (PCA) was conducted to examine the differences in the element characteristics of samples from various regions using the entire multivariate dataset, with Varimax rotation applied (Maćkiewicz and Ratajczak, 1993). Essentially, PCA simplifies high-dimensional datasets by geometrically projecting them onto lower dimensions to obtain the best data summary using a limited number of principal components (PCs). Moreover, the Bartlett test of sphericity and a KMO (Kaiser-Meyer-Olkin) test will also be conducted to confirm the applicability of PCA implementation. All statistical analyses were carried out using SPSS 22.0 and Origin 2021.

3 Results and discussion

3.1 The major element characteristics of riparian dune surface sediments

Table 2 presents the major element analysis results of various riparian dune samples. The coefficient of variation (CV) of SiO2 concentration has the lowest average (CV = 0.059), followed by K2O (CV = 0.086) and Al2O3 (CV = 0.089), indicating the relatively high stability of these major elements. Nonetheless, the concentrations of major elements in riparian dunes of the eight watersheds exhibit significant variation (Table 2), with a general trend of lower SiO2 and K2O concentrations and higher Al2O3, Fe2O3, MgO, CaO, and Na2O concentrations in the west, and the opposite pattern in the east.
Table 2 Major element concentrations of riparian dunes in the eight watersheds in northern China
River

Element
Major element contents (%)
Keriya Maquan Tora Heihe Langqu Mu Bulag Kuye Xar Moron River
SiO2 Average 60.925 72.552 60.074 68.626 70.270 79.547 63.699 86.456
Max 67.938 76.963 70.214 77.510 73.818 89.396 72.270 94.741
Min 51.498 59.655 44.800 52.459 67.283 70.977 55.310 56.991
CV 0.053 0.047 0.104 0.078 0.022 0.047 0.048 0.077
Al2O3 Average 9.586 11.793 8.302 8.269 9.394 9.204 8.356 7.916
Max 12.869 13.282 10.890 10.368 10.023 10.439 9.380 14.736
Min 8.753 10.929 6.880 7.453 8.706 7.043 6.800 5.454
CV 0.068 0.037 0.136 0.068 0.037 0.110 0.057 0.199
Fe2O3 Average 3.114 2.983 2.205 2.985 3.009 2.077 1.251 1.242
Max 5.562 6.878 3.912 4.311 3.245 2.972 2.200 6.352
Min 2.571 1.860 1.370 2.150 2.656 1.034 0.680 0.478
CV 0.155 0.323 0.254 0.171 0.043 0.215 0.254 0.717
MgO Average 2.380 1.311 1.583 1.838 0.925 0.641 0.396 0.350
Max 4.078 7.476 3.035 3.700 1.053 1.336 0.830 2.449
Min 1.818 0.780 0.963 1.005 0.759 0.299 0.190 0.128
CV 0.182 0.861 0.260 0.326 0.079 0.295 0.319 1.083
CaO Average 8.126 1.237 5.122 3.679 4.284 2.970 2.179 1.045
Max 9.725 2.261 7.853 5.563 5.542 5.196 4.280 4.877
Min 5.578 0.926 3.598 2.379 3.469 1.024 1.140 0.334
CV 0.129 0.227 0.188 0.229 0.128 0.281 0.274 0.713
Na2O Average 3.605 2.387 3.701 2.291 2.224 2.668 2.899 2.035
Max 5.854 2.562 12.183 4.077 2.323 3.725 3.480 3.539
Min 2.371 1.647 2.534 1.974 2.138 1.902 2.360 1.228
CV 0.158 0.061 0.452 0.133 0.021 0.162 0.082 0.229
K2O Average 2.054 2.898 1.619 1.677 1.677 2.290 2.269 2.937
Max 2.692 3.107 2.313 2.106 1.835 2.987 2.630 3.382
Min 1.886 2.049 1.093 1.555 1.556 1.851 1.800 2.406
CV 0.060 0.066 0.193 0.068 0.040 0.115 0.075 0.074

Notes: All the samples were measured by the bulky samples, and the information of detailed sampling areas, specific landform, and topographical parts were shown in Table 1.

In particular, as revealed by Table 2 and Figure 2, the average SiO2 concentration of riparian samples from the western Keriya and Tora rivers is relatively low, at almost 60%, which is slightly lower than the values of the Upper Continental Crust (UCC) (Taylor and McLennan, 1985). In contrast, samples from riparian dunes along the eastern Mu Bulag and Xar Moron rivers exhibit comparably higher SiO2 concentrations of nearly 80% and over 85% (the highest value), respectively, which is significantly greater than the UCC values. The concentration of MgO (CV = 0.426) and CaO (CV = 0.271) in the samples varies considerably, with a higher concentration in the western region and a lower concentration in the eastern region. Specifically, the concentrations of MgO in the western riparian dunes of Keriya, Heihe, and Tora rivers are greater than 1.5%, while the concentrations of CaO in the western riparian dunes of Keriya and Tora rivers are greater than 8% and 5%, respectively. In contrast, the average concentration of MgO and CaO in the samples collected from the Eastern Mu Bulag, Kuye, and Xar Moron rivers is significantly lower than that of the western region.
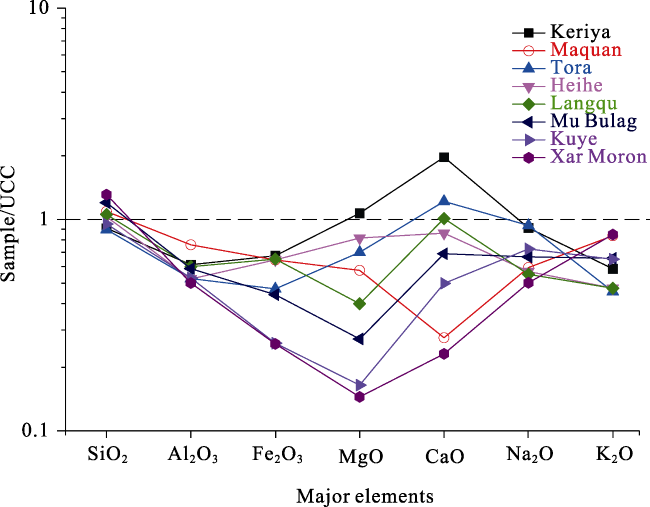
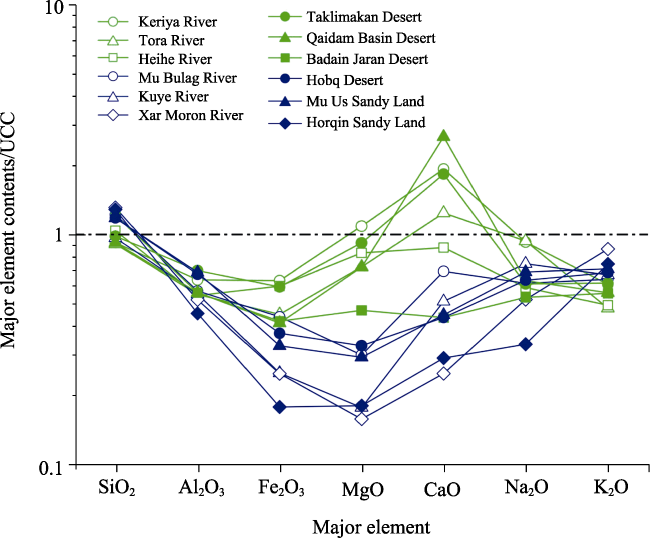
Figure 2 The relative UCC values of major elements in the eight watersheds in northern China
Regarding other major element indicators, according to the relative variation of major elements with respect to UCC ratios (Figure 2), with the exception of SiO2 concentrations that exhibit a relatively similar and clustered distribution, the other major elements, including Al2O3, Fe2O3, Na2O, and K2O, all exhibit a deficit state. The depletion phenomenon of MgO and CaO concentrations is not entirely the same, with an enrichment of MgO and CaO concentrations in Keriya riparian dunes and an enrichment of CaO concentration in Tora riparian dunes. It is noteworthy that the characteristics of the riparian dunes of the Maquan River in the Tibetan Plateau differ significantly from others, having the highest content of Al2O3 and a significant reduction in the concentration of CaO.

3.2 Classification of spatial distribution types of major elements in riparian dunes of different deserts

The analysis of the correlation among various elements and their ratios in the riparian sand dunes of the desert is crucial to understand the geochemical characteristics of riparian dune surface sediments. This analysis holds significant importance for identifying and classifying the possible source of sediments.
Figure 3a demonstrates that the eight watersheds might be classified into two categories, where the sampling locations of Maquan, Mu Bulag, and Xar Moron rivers are dispersed along a straight line with a strong negative correlation of up to 0.86. In contrast, the Keriya, Tora, Heihe, Langqu, and Kuye rivers are weakly correlated and thus are clustered together. Typically, SiO2 is primarily found in quartz and silicate minerals, while Al2O3 is mostly present in aluminosilicate minerals such as feldspar, mica, and clay minerals. In the eight watersheds of northern China, Si and Al are the most abundant and relatively stable major elements, accounting for approximately 80% (Table 2). The significant negative correlation between SiO2 and Al2O3 indicates the associated quartz, silicate, and aluminosilicate minerals and explains the dilution of quartz to other elements.
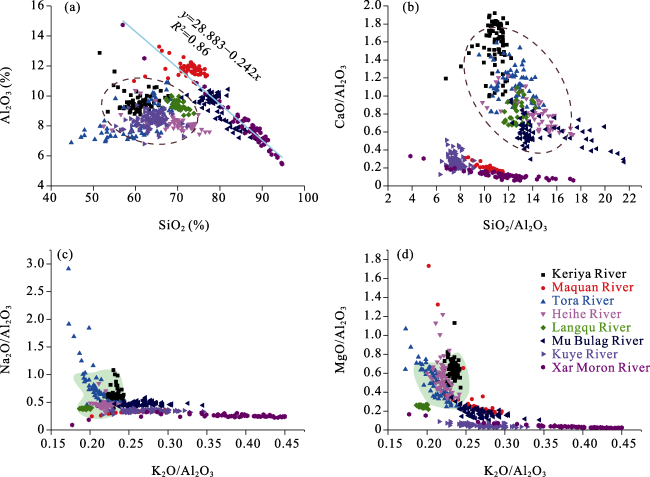
Figure 3 Scatter plots for the samples from the eight watersheds and correlation between various oxides such as (a) SiO2 and Al2O3, (b) SiO2/Al2O3 vs. CaO/Al2O3, (c) K2O/Al2O3 vs. Na2O/Al2O3, (d) K2O/Al2O3 vs. MgO/Al2O
The major element ratios exhibit specific characteristics that can be utilized to infer important information about sediment geochemistry. For instance, the K2O/Al2O3 ratio is frequently used as an index of chemical maturity and can also serve as an indicator of the original composition of sediments during the early stages of chemical weathering when Ca and Na are removed (Cox et al., 1995). The SiO2/Al2O3 ratio is widely used as an index in identifying sediment provenance due to its relative stability (Hao et al., 2010). Furthermore, the ratios between active and inert constituents, such as K2O/Al2O3 and MgO/Al2O3, can provide crucial insights into the sedimentation environment and source (Wang et al., 2001). The scatter plots of SiO2/Al2O3 vs. CaO/Al2O3 (Figure 3b), K2O/Al2O3 vs. Na2O/Al2O3 (Figure 3c), and K2O/Al2O3 vs. MgO/Al2O3 (Figure 3d) exhibit clear partition characteristics, indicating significant differences between the West (Keriya, Tora, Heihe, and Langqu rivers) and the East (Mu Bulag, Kuye, and Xar Moron rivers). The light green dash areas in Figures 3c and 3d represent the distinct sediment provenance and partition.
Except for the analysis of various elements and their ratios, Principal Component Analysis (PCA) and cluster analysis were commonly conducted to analyze the major elements of riparian dunes in the eight watersheds. The Bartlett test of sphericity test and KMO test were performed, and their significance values were found to be 0.000 and 0.584, respectively. The results of the principal component analysis, considering the variables with correlation, showed that the cumulative contribution rate of the total variance reached 73.60% for the two principal components with characteristic roots greater than 1.0 (as indicated in Table 3). The primary principal component included silicate and carbonate indices such as SiO2, MgO, CaO, and Na2O, while the secondary principal component comprised aluminum and iron silicate mineral indices, including K2O, Al2O3, and Fe2O3.
Table 3 Principal components of eigenvalues, variance contribution rate, and cumulative contribution rate of major chemical elements
Component Initial eigenvalues Extraction square and loading Rotating square and loading
Total Variance (%) Cumulative (%) Total Variance (%) Cumulative(%) Total Variance (%) Cumulative (%)
1 3.48 49.69 49.69 3.48 49.69 49.69 3.03 43.25 43.25
2 1.67 23.91 73.60 1.68 23.91 73.60 2.13 30.35 73.60
3 0.87 12.49 86.09
4 0.39 5.57 91.66
5 0.26 3.76 95.42
6 0.251 3.59 99.00
7 0.07 1.00 100
The results of the principal component analysis of riparian dune samples collected from eight desert rivers are illustrated in Figure 4. A significantly positive correlation with a minimum angle can be observed between CaO and MgO in the riparian dune samples of various desert rivers. In contrast, a significantly negative correlation with a minimum angle can be observed between NaO and K2O. Generally, there is a clear distribution difference between sediments from the West and East, and the Maquan River in the Tibetan Plateau is closely related to the eastern region.
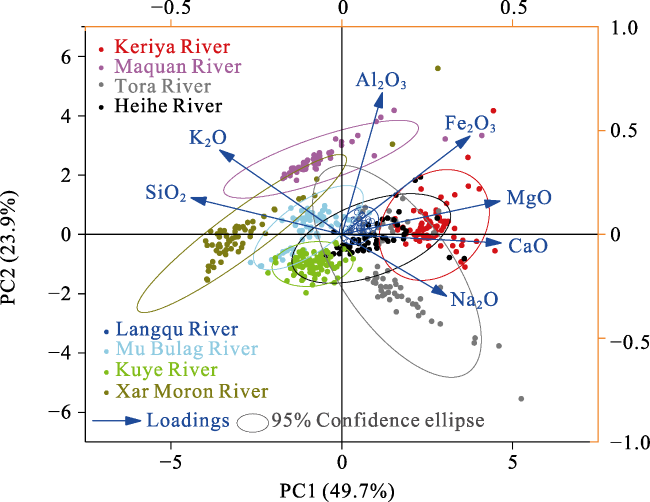
Figure 4 Principal component analysis (PCA) of major elements of riparian dunes in eight watersheds
Additionally, we conducted a cluster analysis based on all 510 samples to obtain detailed zoning (Figure 5). Based on the results of the cluster analysis, we selected a suitable system with a distance of around 3 and classified the samples into three major types. Type I includes dune samples from the Keriya, Tora, Heihe, and Langqu rivers (mostly distributed in the West), Type II includes samples from the Maquan River distributed in the Tibetan Plateau, and Type III includes samples from Xar Moron, Kuye, and Mu Bulag rivers (mostly distributed in the East). Thereinto, samples of Mu Bulag River belong to both Type I and Type III, and because of a higher percentage in Type III, here we classify it as Type III.
Figure 5 Diagram showing principal component clustering analysis (the method combining mean linkage (between groups) and heavy scale distance clustering)
The three identified types represent different sand dune types in the extremely arid and arid regions in the west, riverbank dunes in the Tibetan Plateau sandy land, and riparian dunes in the semi-arid and semi-humid desert rivers in central and eastern China. The sediments in each type exhibit distinct characteristics due to their spatial distributions (Table 2). In Type I, the samples exhibit lower SiO2 concentrations and higher CaO concentrations, indicating low quartz content and high carbonate content. Conversely, in Type III, the higher SiO2 concentrations and lower CaO concentrations indicate the dilution of other elements by excess quartz. In Type II, the samples’ concentrations of K2O and Al2O3 are higher than those of CaO and MgO, indicating K and Al-rich and carbonate-poor aluminosilicate minerals, including feldspar, mica, and clay minerals.

3.3 The three types of riparian dunes and their chemical weathering characteristics

The elemental concentrations in riparian dunes of selected deserts are classified into three groups. SiO2, CaO, K2O, and Na2O are major elements that are closely related to the abundance of quartz, carbonates, feldspar, and mica/clay minerals, respectively. To eliminate the influence of changes in carbonate content, the ratios of other element concentrations to the concentration of Al2O3 are used to demonstrate the relative changes in other elements in dunes, overcoming the impact of variations in carbonate fluctuations. The statistical results of the analysis are presented in Table 4.
Table 4 The statistical details of the chemical element ratio of different riparian dunes in northern China
Type River SiO2/Al2O3 Fe2O3/Al2O3 K2O/Al2O3 Na2O/Al2O3 MgO/Al2O3 CaO/Al2O3
Type I: Extremely arid and arid land Keriya 10.805 0.207 0.233 0.619 0.633 1.544
Tora 10.459 0.169 0.212 0.733 0.486 1.124
Heihe 14.109 0.230 0.220 0.456 0.567 0.810
Langqu 12.717 0.204 0.194 0.389 0.251 0.831
Average 12.022 0.203 0.214 0.549 0.484 1.077
Type II: Tibetan Plateau Maquan 10.459 0.161 0.267 0.333 0.283 0.191
Type III: Semi-arid and semi-humid land Mu Bulag 14.693 0.144 0.270 0.477 0.178 0.588
Kuye 12.959 0.095 0.295 0.571 0.121 0.475
Xar Moron 18.566 0.100 0.403 0.423 0.113 0.240
Average 15.406 0.113 0.322 0.490 0.137 0.434

Notes: All the ratios are molar ratios.

The SiO2/Al2O3 ratios in dunes reflect the relative change of quartz compared to other silicate minerals. Table 4 shows that the abundance of quartz in different sample types, as evidenced by SiO2/Al2O3 ratios, is in the order of Type III (15.406) > Type I (12.022) > Type II (10.459). The relative variations in Fe2O3/Al2O3 and MgO/Al2O3 ratios reflect the abundance of ferromagnesian silicates, which is in the order of Type I, Type II, and Type III. Riparian dune sediment samples from western areas exhibit a higher abundance of ferromagnesian silicates than those from eastern areas. Similarly, the CaO/Al2O3 ratios of samples, which could reflect the abundance of carbonate minerals, show that the western areas have a higher abundance of ferromagnesian silicates and carbonate minerals in the riparian dunes than the eastern areas. Thus, the significant difference between the western and eastern parts of the study area indicates a higher abundance of iron, magnesium silicate, and carbonate minerals in the riparian dunes in the western areas than in the eastern sand dunes.
The Na2O/Al2O3 and K2O/Al2O3 ratios reflect the abundance of minerals such as plagioclase and potassium feldspar, muscovite, and clay in silicate minerals. The order of Na2O/Al2O3 ratio in riparian dune samples is Type I > Type III > Type II, while that of K2O/Al2O3 ratio is Type III > Type II > Type I. This difference can be attributed to the variation in abundance of potassium feldspar and plagioclase in the parent rocks of the sandy area in the eastern region and the deserts in the western region. The sandy areas in the eastern region are rich in potassium feldspar and scarce albite feldspar, while the deserts in the western areas are rich in potassium feldspar and scarce in albite feldspar (He et al., 2016; Yang et al., 2021).
In order to distinguish the regional characteristics of riparian dunes in each watershed, the changes in major elements are analyzed using SiO2/10-CaO-Al2O3 (Figure 6a), (K2O+Na2O)-CaO-Fe2O3 (Figure 6b), and CaO-Na2O-K2O (Figure 6c) (Zhao et al., 2019). The abundance of carbonate, plagioclase, potassium feldspar, and muscovite in the dune samples is reflected by CaO-K2O-Na2O, while the abundance of quartz-carbonate-silicate minerals is reflected by the SiO2/10-CaO-Al2O3. Similarly, the relative abundance of feldspar- carbonate-ferromagnesian silicate minerals is represented by (K2O+Na2O)-CaO-Fe2O3. Most of the samples from riparian dunes in the western and central-western parts of the desert rivers belong to Type I, which is characterized by high carbonate content and low potassium feldspar/muscovite content. On the other hand, samples from sandy areas in the east-central and northeastern parts belong to Type III, which is characterized by low carbonate content and high feldspar content. The samples from the Xar Moron River show different characteristics, with relatively low carbonate content and high potassium feldspar/muscovite content. The Maquan River samples belong to Type II, which is characterized by low carbonate content and medium plagioclase and potassium feldspar/muscovite content. However, some of the riparian dune samples from the western desert rivers categorized as Type I are rich in ferromagnesian silicates and poor in carbonates, and fall partly in the center of the triangular plot. Overall, the findings show that the samples from different regions exhibit distinct characteristics due to differences in their spatial distribution.
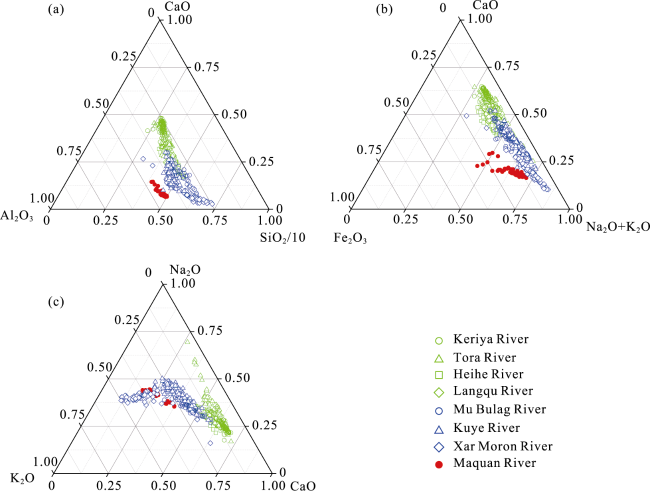
Figure 6 Triangular plot of major elements of riparian dunes in the eight watersheds
The results suggest a significant difference in mineral composition between the Type II samples from the Maquan River and the samples from the other types. Carbonate minerals exhibit the maximum variation, while feldspars show the minimum variation. Types I and III exhibit notable differences in the abundance of feldspars, ferromagnesian minerals, quartz, and silicates, with minor variations in the abundance of carbonates. This may be due to the occurrence of some minerals in the parent rocks of all three riparian dune types, which have distinct regional geochemical element characteristics.
In terms of the chemical weathering characteristics, the A-CN-K diagram (Figure 7) illustrates the weathering trends of sediments in riparian dunes of the selected watersheds, which are represented by different chemical components. PAAS (Taylor and McLennan, 1985), the primary weathering product of UCC, has a direction pointing from the UCC, representing the weathering trend of the early continental period (Nesbitt and Young, 1982).
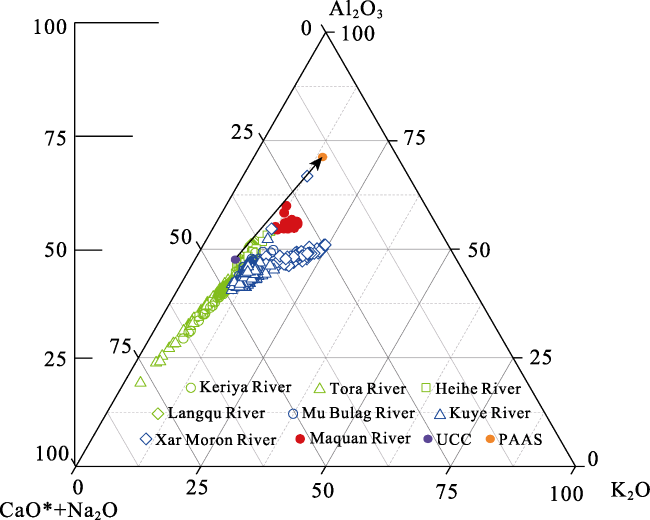
Figure 7 A-CN-K diagram of riparian dunes in the eight watersheds
The samples from all three types are mainly in the vicinity of UCC. The Type II samples show an early stage to moderate degree of chemicalweathering, with CIA values ranging from 55 to 60 (with an average of 55.9). Type I (green color) and Type III (dark blue color) indicate the same degree of chemical weathering, similar to UCC, with average CIA values of 43.2 and 45.4, respectively, representing the unweathered climate conditions or the early stage of chemical weathering (Figure 7). Generally, the degree of weathering generally increases from west to east region. Type I samples show more consistency with the continental weathering trend, Type III samples from the East of Xar Moron River are not consistent, and Type II samples from the Tibetan Plateau regions show the trend of migration continental weathering. Overall, the samples from the three types of riparian dunes exhibit a distinct degree of chemical weathering, even though the continental weathering trends remain consistent.

3.4 Main factors controlling the changes of major elements contents in surface sediments of riparian dunes in different deserts

The study findings suggest that the major factors affecting the geochemical characteristics of major elements in Chinese deserts are surface morphology, material source, and clastic mineral composition, which are primarily influenced by the tectonic background of the area. The regional context of the origin of deserts may therefore approximate the tectonic landform, and the material source and composition may remain relatively stable (Zhao et al., 2019). The composition of rocks in the source location and the availability of new materials play a crucial role in determining significant element shifts. However, the surface sediment characteristics of riparian desert dunes vary due to the combined effects of wind and water transport and the geochemical characteristics of the surface sediments. This indicates that the surface sediments of riparian dunes exhibit some regional spatial differentiation under the interaction of geomorphic erosion (Li et al., 2016; 2017).
The most important factor determining insignificant element variations is the composition of rocks in the source location. In northern China, most deserts have a near-source provenance, meaning that the desert sediments originate from the surrounding mountains and become a source of riparian dunes due to the actions of wind and water (Zhu et al., 1980; Chen and Li, 2011; Dong and Wang, 2015; Hu and Yang, 2016). In other words, desert sediments are derived from the surrounding mountains, and rivers act as significant transportation channels for material sources (Li and Yan, 2014; Yan et al., 2015). Therefore, river and desert sediments contribute to the majority of the sand dunes on both sides of the river. The study reveals significant geographical changes in the composition of major chemical elements in the sand dunes on both sides of distinct desert/sandy land rivers, particularly in the concentrations of Ca and Mg (Table 2 and Figure 2).
Thus, the riparian dunes in the eastern region of China exhibit lower SiO2 abundance and higher Fe and Mg concentration which is due to their lower mineral maturity (Figure 6) and limited material supply resulting from their permanent and semi-fixed dune nature and strong chemical weathering. On the other hand, the abundance of CaO in the riparian dunes of the western Taklimakan Desert-Keriya River and Qaidam Basin Desert-Tora River is significantly higher than in the eastern region, as evidenced by the variation of CaO abundance in the riparian dunes of different basins (Figures 2 and 3). This CaO enrichment is likely due to the presence of abundant carbonate minerals in the adjacent mountains (Li et al., 2007; Xie, 2012). Conversely, the riparian dunes of Mu Bulag River in the middle and Xar Moron River in the east exhibit noticeably lower CaO abundance due to the limited exposure of carbonate strata in the Ordos area (Li et al., 2007; Li, 2010; Xie, 2012). The presence of three divisions of K2O and Al2O3 in Figure 2 indicates substantial variations in the sources of potassium in the riparian dunes. The occurrence of potassium-rich granite, potassium-rich basalt, and granite in the riparian dunes of Horqin Sandy Land-Xar Moron River in the northeast may be related to the presence of potassium-rich granite, potassium-rich basalt, and granite in the surrounding source region.
These K-rich rocks are transported to Horqin Land via water during the process of weathering and denudation, leading to a higher concentration of K2O in the riparian dunes samples. The concentration of quartz in desert sediments is influenced by the bedrock type of the surrounding mountains, and these sediments impact the material sources of the adjacent desert rivers (Fu and Yang, 2004; Fu and Wang, 2015). The chemical composition of riparian dunes in various rivers is different, and hence rivers may also be considered the natural border and barrier of deserts. The material sources of the riparian desert dunes are influenced not only by the parent rocks but also by the introduction of new materials due to the actions of wind, water, and weathering processes. According to Table 5, there is a difference in the chemical composition of the desert sediments in the hinterland and those in the riparian sediments of the desert. The abundance of SiO2 and Al2O3 in the riparian dunes of rivers in the western desert is lower than that in the corresponding hinterland of the desert. At the same time, the content of Fe2O3, MgO, CaO, and Na2O is higher in the riparian dunes than in the hinterland of the desert. In contrast, the abundance of Fe2O3, MgO, CaO, and Na2O is higher, indicating that the riparian dunes are more susceptible to the supplement of fresh materials and the loss of original components due to wind and water transport than the desert hinterland. The desert hinterlands are rich in quartz and silicate minerals but contain a lower concentration of carbonate substances. In Figure 8, the sediments from the western desert hinterland and the corresponding riparian dunes show comparable tendencies to shift compared to the UCC. For instance, the concentration of CaO is enriched while other elements are depleted, with more significant depletion in the eastern sandy lands and riparian dunes. This suggests a connection between them in terms of provenance. However, the loss of riparian dunes in the desert is more substantial than that in the desert hinterland. This indicates that the chemical composition of the sediments on both sides of the rivers in the riparian dunes is more susceptible to the influence of foreign and fresh materials, and the chemical weathering process of the riparian dunes is more pronounced due to the effects of flowing water.
Table 5 Composition of major chemical elements (%) in surface sediments of deserts and desert rivers in China (Zhao et al., 2019)
Deserts/Basins SiO2 Al2O3 Fe2O3 MgO CaO Na2O K2O
Taklimakan Desert 64.90 10.60 2.96 2.04 7.69 2.38 2.09
Keriya River 60.93 9.59 3.11 2.38 8.13 3.61 2.05
Qaidam Basin Desert 60.70 8.50 2.06 1.60 11.18 2.46 1.9
Tora River 59.97 8.34 2.25 1.60 5.21 3.66 1.63
Badain Jaran Desert 79.90 8.50 2.10 1.04 1.83 2.08 1.89
Heihe River 68.63 8.27 2.99 1.84 3.68 2.29 1.68
Hobq Desert 77.90 10.20 1.86 0.73 1.95 2.47 2.32
Mu Bulag River 79.55 9.20 2.08 0.64 2.97 2.67 2.29
Mu Us Sandy Land 77.80 10.40 1.64 0.65 1.88 2.68 2.41
Kuye River 63.79 8.35 1.25 0.39 2.17 2.90 2.27
Horqin Sandy Land 84.80 6.90 0.89 0.40 1.22 1.30 2.53
Xar Moron River 86.46 7.92 1.24 0.35 1.05 2.04 2.94
Figure 8 UCC standardized map of desert/sandy hinterland and its riparian dune elements in northern China
The riparian dunes zones in different deserts exhibit substantial variations in terms of material denudation supply and physical and chemical weathering in the source area. The western desert is mainly characterized by mobile dunes that undergo significant physical weathering and moderate chemical weathering. The river receives a large amount of debris from resulting in lower mineral maturity (Figure 6), poor SiO2 abundance, and higher Fe and Mg concentration. The majority of the riparian dunes in the east are semi-fixed or permanent dunes, experiencing strong chemical weathering and limited material supply, likely due to grassland deterioration and increased sand formation (Li et al., 2016). In contrast, the western deserts are characterized by inland rivers that act as sedimentary basins, receiving both dissolved and suspended matter that results in poorly sorted sediments with a high proportion of fine-grained materials that serve as the main source of sand for the riparian dunes via wind transport. On the other hand, the rivers in the eastern sandy terrain are mainly outflow rivers, where suspended and dissolved materials flow into the ocean, and well-sorted sand particles are the primary source of sand for the sandy terrain (Xie and Ding, 2007; Zhao et al., 2014).

4 Conclusions

Based on systematically analyzing the characteristics of major elements in the surface samples of riparian sand dunes in major deserts in China, the geochemical features and their implication of provenances of riparian dunes in the northern China deserts were studied. The main conclusion indicated that:
(1) The major elements’ abundance in the riparian dunes of China’s desert rivers displays significant spatial variations across three regions: Type I sandy rivers in the western area (Keriya River, Tora River, Heihe River, Langqu River), Type II sandy rivers in the Tibetan Plateau (Maquan River), and Type III desert rivers in the eastern and northeastern area (Mu Bulag River, Kuye River, and Xar Moron River).
(2) The riparian dunes of desert/sandy rivers in China are generally depleted in SiO2, Al2O3, Fe2O3, Na2O, MgO, and K2O, especially in the northeastern riparian dunes due to SiO2 dilution. The most significant deficit is in carbonate CaO and MgO, while the desert rivers in the western severely dry areas are rich in CaO and MgO, particularly CaO.
(3) Two primary factors, rock composition in the source area and fresh material supply, primarily contribute to the change in element content in riparian dunes. The deserts/sandy lands in the middle east and northeast (Type III) receive limited fresh material supply, have relatively high CIA, and are affected by nearby rivers’ material supply, resulting in higher degrees of chemical weathering than in the western and central-western parts. Furthermore, the Tibetan Plateau experiences a weak to moderate degree of chemical weathering.
[1]
Bauluz B, Mayayo M J, Fernandez-Nieto C et al., 2000. Geochemistry of Precambrian and Paleozoic siliciclastic rocks from the Iberian Range (NE Spain): Implications for source-area weathering, sorting, provenance, and tectonic setting. Chemical Geology, 168(1/2): 135-150.

DOI

[2]
Buggle B, Glaser B, Hambach U et al., 2011. An evaluation of geochemical weathering indices in loess-paleosol studies. Quaternary International, 240(1/2): 12-21.

DOI

[3]
Bullard J E, McTainsh G H, 2003. Aeolian-fluvial interactions in dryland environments: Examples, concepts and Australia case study. Progress in Physical Geography, 27(4): 471-501.

[4]
Chen J, An Z S, Liu L W et al., 2001. Variations in chemical compositions of the eolian dust in Chinese Loess Plateau over the past 2.5 Ma and chemical weathering in the Asian inland. Science in China Series D: Earth Sciences, 44(5): 403-413.

DOI

[5]
Chen J, Li G J, 2011. Geochemical studies on the source region of Asian dust. Science China Earth Sciences, 54(9): 1279-1301.

DOI

[6]
Chen J, Li G J, Yang J D et al., 2007. Nd and Sr isotopic characteristics of Chinese deserts: Implications for the provenances of Asian dust. Geochimica et Cosmochimica Acta, 71(15): 3904-3914.

DOI

[7]
Cox R, Lowe D R, Cullers R L, 1995. The influence of sediment recycling and basement composition on evolution of mudrock chemistry in the southwestern United States. Geochimica et Cosmochimica Acta, 59(14): 2919-2940.

DOI

[8]
Cullers R L, Podkovyrov V N, 2000. Geochemistry of the Mesoproterozoic Lakhanda shales in southeastern Yakutia, Russia: Implications for mineralogical and provenance control, and recycling. Precambrian Research, 104(1/2): 77-93.

DOI

[9]
Dong Z B, Lv P, Lu J F et al., 2012. Geomorphology and origin of yardangs in the Kumtagh Desert, Northwest China. Geomorphology, 139/140: 145-154.

DOI

[10]
Draut A E, 2012. Effects of river regulation on aeolian landscapes, Colorado River, southwestern USA. Journal of Geophysical Research: Earth Surface, 117(F2): F02022.

[11]
Ewing R C, Hayes A G, Lucas A, 2015. Sand dune patterns on Titan controlled by long-term climate cycles. Nature Geoscience, 8(1): 15-19.

DOI

[12]
Folk P L, Ward W D, 1957. Brazos River Bar: A study in the significance of grain size parameters. Journal of Sedimentary Petrology, 27(1): 3-26.

DOI

[13]
Fu X D, Wang Y S, 2015. Provenance studies of Chinese deserts: Review and outlook. Acta Sedimentologica Sinica, 33(6): 1063-1073. (in Chinese)

[14]
Fu X D, Yang X P, 2004. Preliminary measurement and analysis of quartz δ18O of northern deserts in China. Quaternary Sciences, 24(2): 243-243. (in Chinese)

[15]
Hao Q Z, Guo Z T, Qiao Y S et al., 2010. Geochemical evidence for the provenance of middle Pleistocene loess deposits in southern China. Quaternary Science Reviews, 29(23/24): 3317-3326.

DOI

[16]
Harnois L, 1988. The CIW index: A new chemical index of weathering. Sedimentary Geology, 55(3): 319-322.

DOI

[17]
He T, Liu L W, Chen Y et al., 2016. Plagioclase sub-species in Chinese loess deposits: Implications for dust source migration and past climate change. Quaternary Research, 85(1): 17-24.

DOI

[18]
Hu F G, Yang X P, 2016. Geochemical and geomorphological evidence for the provenance of aeolian deposits in the Badain Jaran Desert, northwestern China. Quaternary Science Reviews, 131(Part A):179-192.

DOI

[19]
Jin H L, Dong G R, 2001. Preliminary study on the role of river wriggling in the evolution of aeolian landforms in arid region: Taking Hotan River as an example. Journal of Desert Research, 21(4): 367-373. (in Chinese)

[20]
Li G J, 2010. Geochemical tracing of aeolian dust source in East Asia[D]. Nanjing: Nanjing University. (in Chinese)

[21]
Li G J, Chen J, Chen Y et al., 2007. Dolomite as a tracer for the source regions of Asian dust. Journal of Geophysical Research: Atmospheres, 112(D17): D17201.

DOI

[22]
Li X M, Liu X K, Yan P, 2022. Spatial variability of the physicochemical characteristics of surface sediments in the “Three Rivers and One Dune” Region in the Kuye River Basin, Mu Us Sandy Land, China. Catena, 210: 105943.

DOI

[23]
Li X M, Yan P, 2014. Landscape pattern characteristics of deserts and rivers in northern China. Progress in Geography, 33(9): 1198-1208. (in Chinese)

DOI

[24]
Li X M, Yan P, 2017. Spatial pattern and dynamic change of channel and dune in typical basins of northern China. Arid Zone Research, 34(6): 1436-1447. (in Chinese)

[25]
Li X M, Yan P, Qian Y et al., 2017. Spatial distribution of grain size and chemical elements in surface sediments in the Xar Moron River Basin. Arid Zone Research, 34(1): 191-199. (in Chinese)

[26]
Li X M, Yan P, Wu W et al., 2016. Differences of surface sediments in three basins of northern China and its implications. Journal of Earth Environment, 7(6): 577-589.

[27]
Liu B L, Coulthard T J, 2017. Modelling the interaction of aeolian and fluvial processes with a combined cellular model of sand dunes and river systems. Computers & Geosciences, 106: 1-9.

DOI

[28]
Liu Q Q, Yang X, 2018. Geochemical composition and provenance of aeolian sands in the Ordos Deserts, northern China. Geomorphology, 318: 354-374.

DOI

[29]
Lu R J, Jia F F, Gao S Y et al., 2015. Holocene aeolian activity and climatic change in Qinghai Lake basin, northeastern Qinghai-Tibetan Plateau. Palaeogeography, Palaeoclimatology, Palaeoecology, 430: 1-10.

DOI

[30]
Lu W Y, Zhao W C, Balsam W et al., 2017. Iron mineralogy and speciation in clay-sized fractions of Chinese desert sediments. Journal of Geophysical Research: Atmospheres, 122(24): 13, 458-13,471.

[31]
Maćkiewicz A, Ratajczak W, 1993. Principal components analysis (PCA). Computers & Geosciences, 19(3): 303-342.

DOI

[32]
Mclennan S M, 1993. Weathering and global denudation. Journal of Geology, 101(2): 295-303.

DOI

[33]
Nesbitt H W, Markovics G, Price R C, 1980. Chemical processes affecting alkalis and alkaline earths during continental weathering. Geochimica et Cosmochimica Acta, 44(11): 1659-1666.

DOI

[34]
Nesbitt H W, Young G M, 1982. Early Proterozoic climates and plate motions inferred from major element chemistry of lutites. Nature, 299(5885): 715-717.

DOI

[35]
Nesbitt H W, Young G M, 1996. Petrogenesis of sediments in the absence of chemical weathering: Effects of abrasion and sorting on bulk composition and mineralogy. Sedimentology, 43(2): 341-358.

DOI

[36]
Smalley I, 1995. Making the material: The formation of silt sized primary mineral particles for loess deposits. Quaternary Science Reviews, 14(7/8): 645-651.

DOI

[37]
Song Y, Yan P, Liu L Y, 2006. A review of the research on complex erosion by wind and water. Journal of Geographical Sciences, 15(2): 231-241.

[38]
Taylor S R, McLennan S M, 1985. The Continental Crust: Its Composition and Evolution. Oxford: Blackwell.

[39]
Xie J, Ding Z L, 2007. Compositions of heavy minerals in northeastern China sandlands and provenance analysis. Science in China Series D: Earth Sciences, 50(11): 1715-1723.

DOI

[40]
Xie X, Ren T X, Sun H Z., 2012. Geochemical Atlas of China. Beijing: The Geological Publishing House. (in Chinese)

[41]
Xu Z W, Lu H Y, Zhao C F et al., 2011. Composition, origin and weathering process of surface sediment in Kumtagh Desert, Northwest China. Journal of Geographical Sciences, 21(6): 1062-1076.

DOI

[42]
Yan P, Li X M, Ma Y F et al., 2015. Morphological characteristics of interactions between deserts and rivers in northern China. Aeolian Research, 19(Part B):225-233.

DOI

[43]
Yang S L, Luo Y L, Li Q et al., 2021. Comparisons of topsoil geochemical elements from Northwest China and eastern Tibetan Plateau identify the plateau interior as Tibetan dust source. Science of the Total Environment, 798: 149240.

DOI

[44]
Yang X P, Zhu B Q, White P D, 2007. Provenance of aeolian sediment in the Taklamakan Desert of western China, inferred from REE and major-elemental data. Quaternary International, 175(1): 71-85.

DOI

[45]
Yao C X, Li B S, Jin H L et al., 2002. Sedimentary cycles of trace elements in Salawusu River Valley since 150 ka BP. Journal of Geographical Sciences, 12(1): 65-71.

[46]
Zhang F, Wang J, Ma J et al., 2023. OSL chronology reveals Late Pleistocene floods and their impact on landform evolution in the lower reaches of the Keriya River in the Taklimakan Desert. Journal of Geographical Sciences, 33(5): 945-960.

DOI

[47]
Zhao W, Liu L, Chen J et al., 2019. Geochemical characterization of major elements in desert sediments and implications for the Chinese loess source. Science China Earth Sciences, 62(9): 1428-1440.

DOI

[48]
Zhao W C, Sun Y B, Balsam W et al., 2014. Hf-Nd isotopic variability in mineral dust from Chinese and Mongolian deserts: Implications for sources and dispersal. Scientific Reports, 4(1): 5837.

DOI

[49]
Zhu B Q, 2022. The recent evolution of dune landforms and its environmental indications in the mid-latitude desert area (Hexi Corridor). Journal of Geographical Sciences, 32(4): 617-644.

DOI

[50]
Zhu B Q, Yu J J, Rioual P et al., 2014. Particle size variation of aeolian dune deposits in the lower reaches of the Heihe River basin, China. Sedimentary Geology, 301: 54-69.

DOI

[51]
Zhu Z, Wu Z, Liu S et al., 1980. An Introduction to Deserts in China. rev. ed. Beijing: Science Press.

Outlines

/