
Journal of Geographical Sciences >
Evolution of rural multifunction and its natural and socioeconomic factors in coastal China
|
Wang Yazhu (1988-), PhD and Research Associate, specialized in environmental effects of urban and rural development. E-mail: yzwang@niglas.ac.cn |
Received date: 2022-10-31
Accepted date: 2023-07-04
Online published: 2023-10-08
Supported by
National Natural Science Foundation of China(42101318)
National Key Research and Development Program of China(2018YFD1100101)
Science and Technology Service Network Initiative of Chinese Academy of Sciences(KFJ-STS-ZDTP-011)
Rural decline has become a global problem. To address this issue, the division of rural functions and identification of driving factors are important means of rural revitalization. Taking the town area as a unit, this study conducts a division and evolution analysis of rural regional functions in Jiangsu province in coastal China by constructing an evaluation system using the spatial econometric model to diagnose endogenous and exogenous driving factors of rural multifunction formation. The results show that the functions of agricultural supply and ecological conservation have decreased, while the functions of economic development and social security have increased. Agricultural production functions are concentrated in northern and central Jiangsu. The economic development function is mainly based on industrial development, and is the strongest in southern Jiangsu. Social security functions are concentrated in suburban area, county centers, and key towns. High-value areas of ecological conservation are concentrated along lakes, the coast, and hilly areas of southern Jiangsu. The multifunctional development of villages and towns is affected by endogenous and exogenous factors, including economic geographic location, natural resources, economic foundation, human capital, traffic conditions, market demand, infrastructure, and environmental governance. Natural factors have a significant impact on the supply of agricultural products and the formation of ecological conservation functions. The effects of socioeconomic factors on these four functions differ significantly. This study expands the theory of rural development functions, the classification and zoning paradigm, and the quantitative study of driving mechanisms. The results provide a reference for practical value and policy significance for the reconstruction of rural functions and rural revitalization.
WANG Yazhu , DUAN Xuejun , WANG Lei , WANG Lingqing . Evolution of rural multifunction and its natural and socioeconomic factors in coastal China[J]. Journal of Geographical Sciences, 2023 , 33(9) : 1791 -1814 . DOI: 10.1007/s11442-023-2153-3
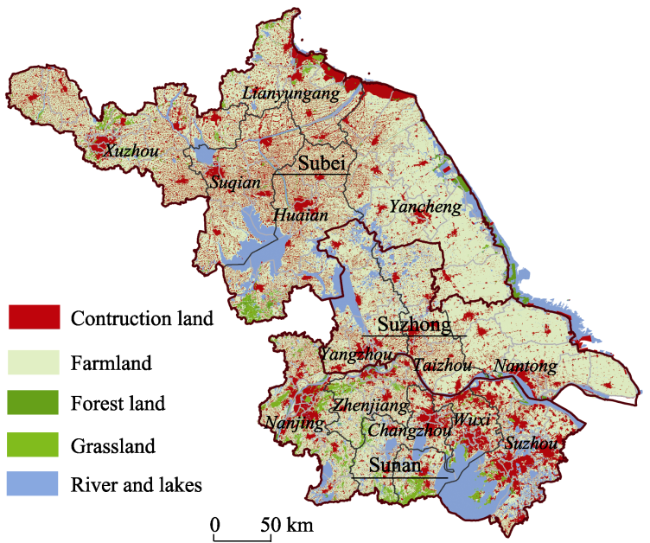
Figure 1 Land use regional distribution of Jiangsu province |
Table 1 Primary and secondary classification index system of rural functions |
| Primary classification target layer | Secondary classification target layer | Index layer | Weight |
|---|---|---|---|
| Agricultural product supply function | Grain production function | V1 Sowing area of grain crops | 0.054 |
| Cash crop production function | V2 Planting area of vegetable crops | 0.052 | |
| Aquaculture function | V3 Total meat production | 0.059 | |
| V4 Aquatic product output | 0.071 | ||
| Economic development function | Industrial development function | V5 Number of industrial enterprises above designated size | 0.021 |
| V6 Output value of industrial enterprises above designated size | 0.033 | ||
| Business function | V7 Number of markets | 0.020 | |
| V8 Trade market turnover | 0.114 | ||
| V9 Number of supermarkets over 50 m2 | 0.038 | ||
| Tourism function | V10 Number of accommodation and catering enterprises | 0.064 | |
| Social security function | Living function | V11 Location | 0.006 |
| V12 Number of branches of financial institutions | 0.041 | ||
| V13 Number of parks and leisure and fitness squares | 0.036 | ||
| V14 Minimum living security number of street residents | 0.018 | ||
| Cultural function | V15 Total number of students in school | 0.026 | |
| V16 Number of libraries and cultural stations | 0.040 | ||
| V17 Area of public cultural facilities | 0.121 | ||
| Medical function | V18 Number of medical and health institutions | 0.042 | |
| V19 Number of beds in medical and health institutions | 0.048 | ||
| Ecological conservation function | Biodiversity function | V20 Vegetation coverage | 0.021 |
| Water conservation function | V21 Water area | 0.076 |
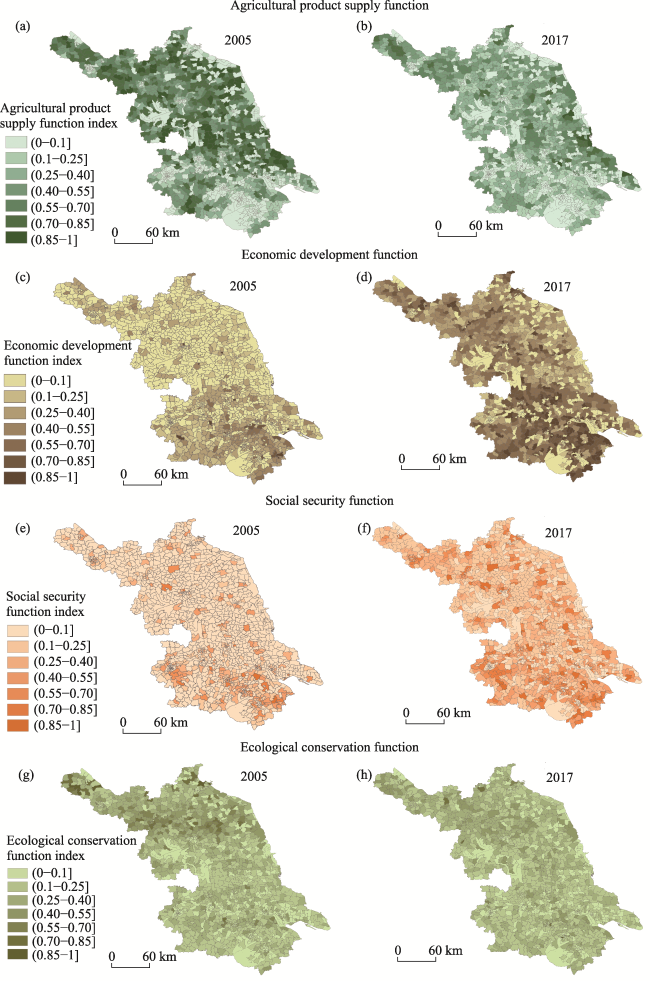
Figure 2 Spatiotemporal evolution of rural functions in Jiangsu province |
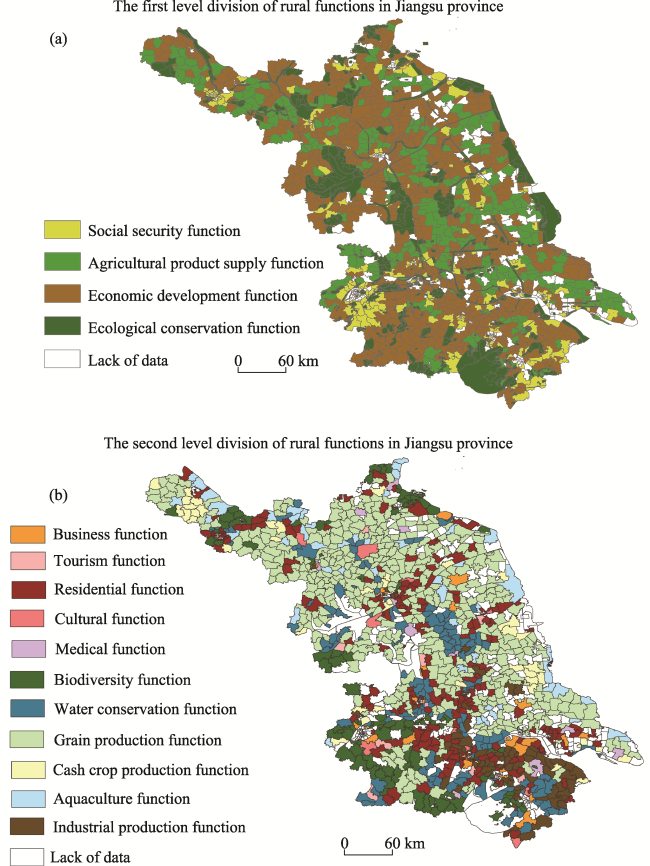
Figure 3 Primary and secondary functional zoning of rural Jiangsu province |
Table 2 Classification of primary and secondary functions of rural development |
| Primary function | Secondary function | Number of villages | Proportion of all villages (%) |
|---|---|---|---|
| Agricultural product supply function | Grain production function | 423 | 28.45 |
| Cash crop production function | 101 | 6.79 | |
| Aquaculture function | 50 | 3.36 | |
| Economic development function | Industrial production function | 134 | 9.01 |
| Business function | 29 | 1.95 | |
| Tourism function | 21 | 1.41 | |
| Social security function | Residential function | 224 | 15.06 |
| Cultural function | 12 | 0.81 | |
| Medical function | 16 | 1.08 | |
| Ecological conservation function | Biodiversity function | 114 | 7.67 |
| Water conservation function | 147 | 9.89 | |
| Lack of data | 216 | 14.53 |
Table 3 Influencing factor variables for rural development in agricultural product supply function |
| Category | Variable | Variable factors | Unit | Variable description |
|---|---|---|---|---|
| Endogenous factors | Geographical location | Geographic conditions (X1) | km | Straight line distance from city and county center |
| Natural resources | Hydrological resources (X2) | km | Distance from rivers above grade 4 and lakes above 10 km2 | |
| Terrain conditions (X3) | m | Elevation size | ||
| cultivated land area (X4) | km2 | Cultivated land area/registered resident population | ||
| Ecological status (X5) | % | Vegetation coverage | ||
| Economic base | Economic basis (X6) | 10,000 yuan | Rural collective economic income | |
| Human capital | Number of labor force (X7) | people | Number of permanent residents | |
| Able person factor (X8) | people | Numbers of large planting households, large livestock households, and poultry breeding households | ||
| Traffic conditions | Transportation accessibility (X9) | min | Traffic accessibility of national and provincial road network densities | |
| Exogenous factors | Market demand | Trading market (X10) | induvial | Number of trading markets dominated by grain, oil, vegetables, fruits, and aquatic products |
| Infrastructure | Fixed asset investment (X11) | 10,000 yuan | Fixed asset investment completed | |
| Environmental governance | Sewage treatment (X12) | % | Centralized treatment rate of domestic sewage | |
| Garbage collection (X13) | % | Domestic waste disposal rate |
Table 4 Spatial dependence test of rural function evolution in Jiangsu province |
| Spatial dependence test | Agricultural product supply function | Economic development function | Social security function | Ecological conservation function |
|---|---|---|---|---|
| Moran's I (error) | 4.257*** | 8.256** | 6.523** | 2.548** |
| LMMAG | 20.715* | 27.683** | 22.683* | 2.163* |
| R-LMLAG | 8.264* | 1.657** | 0.851** | 1.983** |
| LMERR | 13.936** | 34.151*** | 26.432* | 1.269* |
| R-LMERR | 0.539** | 9.544** | 10.956* | 3.865* |
Note: * Significant correlation at the 10% significance level; ** Significant correlation at the 5% significance level; *** Significant correlation at the 1% significance level. |
Table 5 Spatial regression analysis of rural function evolution influencing factors in Jiangsu province |
| Impact factor | Agricultural product supply function | Economic development function | Social security function | Ecological conservation function | ||||||||
|---|---|---|---|---|---|---|---|---|---|---|---|---|
| OLS | SLM | SEM | OLS | SLM | SEM | OLS | SLM | SEM | OLS | SLM | SEM | |
| Geographic conditions (X1) | 0.138* | 0.184* | 0.296* | 0.089 | 0.134* | 0.149 | 0.159* | 0.286** | 0.216** | −0.188 | −0.057 | −0.134* |
| Hydrological resources (X2) | 0.028 | 0.042 | 0.125 | 0.104 | 0.089* | 0.052** | −0.047 | −0.058 | 0.049 | 0.027* | 0.034** | −0.009 |
| Terrain conditions (X3) | −0.194* | −0.176 | −0.254** | 0.078 | −0.057 | 0.098 | 0.077* | 0.098 | 0.034 | 1.002 | 1.355 | 1.286 |
| Cultivated land area (X4) | 0.152 | 0.085** | 0.253** | −0.208** | −0.247* | −0.240* | −0.208 | −0.247 | −0.187 | −1.222 | −1.035 | −1.004 |
| Ecological conditions (X5) | −0.097 | −0.088 | −0.059 | −3.007 | −3.078 | −0.357 | −0.157 | −0.089 | −0.114 | 2.871** | 2.958** | 2.903* |
| Economic basis (X6) | 0.095** | 0.105* | 0.243** | 0.342** | 0.379** | 0.408** | 0.148* | 0.198 | 0.217* | −0.889 | −0.994 | −0.971 |
| Number of labor force (X7) | −0.023 | 0.058 | 0.218* | 0.101 | 0.127* | 0.214** | 0.178 | 0.207 | 0.197 | 0.135 | −0.148 | −0.120* |
| Able person factor (X8) | 0.104 | 0.154* | 0.162** | 0.047* | 0.089 | 0.186 | 0.187 | 0.259 | 0.209* | −0.187* | −0.207* | −0.183 |
| Transportation accessibility (X9) | 0.259 | 0.287* | 0.387 | 0.189* | 0.246** | 0.341** | 0.105* | 0.187** | −0.127 | −0.113* | −0.127 | 0.198 |
| Trading market (X10) | 0.141 | −0.058 | 0.274* | 0.008 | −0.027 | 0.087 | −0.049 | 0.087 | −0.031 | 0.035 | −0.040 | −0.007 |
| Sewage treatment (X12) | 0.004* | 0.008 | 0.025 | 0.187* | 0.118 | 0.208** | 0.182* | 0.196* | 0.146* | −0.007 | −0.098 | 0.054 |
| Garbage collection (X13) | −0.025 | −0.085 | 0.095 | −0.008 | 0.014* | 0.027 | −0.089 | 0.152* | 0.144 | 0.029 | 0.152** | −0.067 |
| ρ (Spatial lag term) | 0.313** | 0.274*** | 0.347** | 0.189*** | 0.482** | 0.187** | 0.257** | 0.206** | ||||
| λ (Spatial error term) | (2.47) | (4.95) | (3.24) | (4.87) | (5.12) | (1.24) | (2.98) | (−0.87) | ||||
| R2 | 0.513 | 0.554 | 0.581 | 0.615 | 0.664 | 0.698 | 0.581 | 0.605 | 0.594 | 0.453 | 0.497 | 0.462 |
| Adjust R2 | 0.504 | 0.589 | 0.572 | 0.412 | ||||||||
| F | 21.719 | 27.179 | 24.357 | 15.247 | ||||||||
| LogL | 380.34 | 398.67 | 890.71 | 896.23 | 618.12 | 602.34 | 157.95 | 150.44 | ||||
| AIC (Akaike information criterion) | −935.57 | −953.89 | −1675.94 | −1685.24 | −1255.22 | −1204.95 | −824.12 | −795.18 | ||||
| SC (Schwarz Criterion) | −785.22 | −792.51 | −1358.18 | −1458.87 | −924.11 | −902.23 | −548.24 | −507.33 | ||||
Note: *, **, and *** indicate significant correlations at the 10%, 5%, and 1% levels, respectively. OLS, ordinary least squares; SEM, spatial error model; SLM, spatial lag model. |
| [1] |
|
| [2] |
|
| [3] |
|
| [4] |
|
| [5] |
|
| [6] |
|
| [7] |
|
| [8] |
|
| [9] |
|
| [10] |
|
| [11] |
|
| [12] |
|
| [13] |
|
| [14] |
|
| [15] |
|
| [16] |
|
| [17] |
|
| [18] |
|
| [19] |
|
| [20] |
|
| [21] |
|
| [22] |
|
| [23] |
|
| [24] |
|
| [25] |
|
| [26] |
|
| [27] |
|
| [28] |
|
| [29] |
|
| [30] |
|
| [31] |
|
| [32] |
|
| [33] |
|
| [34] |
|
| [35] |
|
| [36] |
|
| [37] |
|
| [38] |
|
| [39] |
|
| [40] |
|
| [41] |
|
| [42] |
|
| [43] |
|
| [44] |
|
| [45] |
|
| [46] |
|
| [47] |
|
| [48] |
|
| [49] |
|
| [50] |
|
| [51] |
|
| [52] |
|
| [53] |
|
| [54] |
|
| [55] |
|
| [56] |
|
| [57] |
|
| [58] |
|
| [59] |
|
| [60] |
|
| [61] |
|
| [62] |
|
| [63] |
|
| [64] |
|
| [65] |
|
| [66] |
|
| [67] |
|
| [68] |
|
| [69] |
|
| [70] |
|
| [71] |
|
| [72] |
|
| [73] |
|
| [74] |
|
| [75] |
|
| [76] |
|
| [77] |
|
| [78] |
|
| [79] |
|
| [80] |
|
| [81] |
|
| [82] |
|
| [83] |
|
| [84] |
|
| [85] |
|
| [86] |
|
| [87] |
|
| [88] |
|
/
| 〈 |
|
〉 |