
Journal of Geographical Sciences >
Impact of labor transfer differences on terraced fields abandonment: Evidence from micro-survey of farmers in the mountainous areas of Hunan, Fujian and Jiangxi
|
Xie Hualin (1979-), Professor, specialized in land resource economy and ecological economy. E-mail: xiehl_2000@163.com |
Received date: 2023-04-10
Accepted date: 2023-05-25
Online published: 2023-08-29
Supported by
National Natural Science Foundation of China(41930757)
National Natural Science Foundation of China(41971243)
In recent years, the phenomenon of abandonment of cultivated land in mountainous areas has occurred frequently, and the problem of abandonment has become a focus of attention of government agricultural departments and academic circles. However, few studies have paid attention to the impact of differences in labor transfer on the abandonment behavior of farmers’ terraced fields. Based on this, this paper takes the terraced fields of Hunan, Fujian and Jiangxi provinces as the research area, combined with data from 1438 farmer households, and uses the Probit and Tobit models to analyzed the impact of the difference in the quantity, distance and quality of labor off-farm transfer on the decision-making and scale of terraced field abandonment of farmer households. The results show that: (1) The greater the quantity of labor transfer, the farther the transfer distance and the higher the quality of non-agricultural employment, can promote the decision of farmers to abandon terraced fields; (2) With the deepening of the degree of non-agricultural transfer, the scale of abandoned terraced fields by farmers in hilly and mountainous areas will also expand; (3) The distance and quality of labor transfer can strengthen the impact of labor transfer quantity on farmers’ decision to abandon land. To alleviate the phenomenon of abandoned terraced fields, the government should pay attention to the labor substitution role of agricultural service outsourcing and mechanization in mountainous areas. The government should actively promote the transformation of terraced fields into mechanized farming, improve the cultivated land transfer market, and encourage farmers to transfer terraced fields.
XIE Hualin , WU Qing , LI Xiubin . Impact of labor transfer differences on terraced fields abandonment: Evidence from micro-survey of farmers in the mountainous areas of Hunan, Fujian and Jiangxi[J]. Journal of Geographical Sciences, 2023 , 33(8) : 1702 -1724 . DOI: 10.1007/s11442-023-2149-z
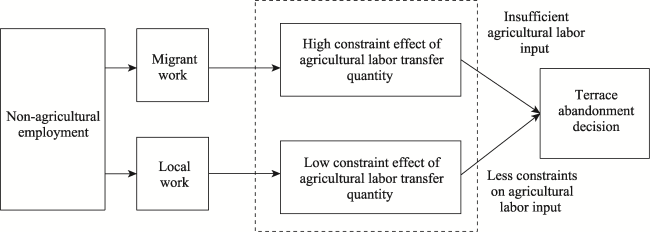
Figure 1 Impact of non-agricultural employment distance on farmers’ terrace abandonment decision |
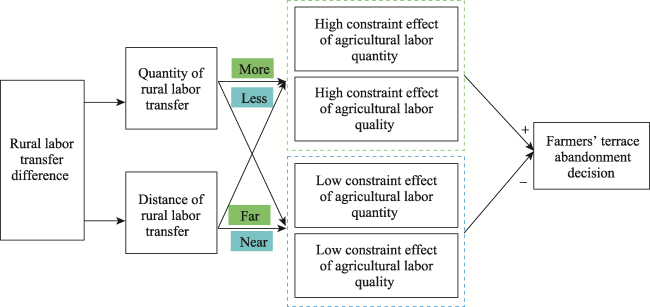
Figure 2 Analysis of the impact of rural labor transfer difference on terrace abandonment |
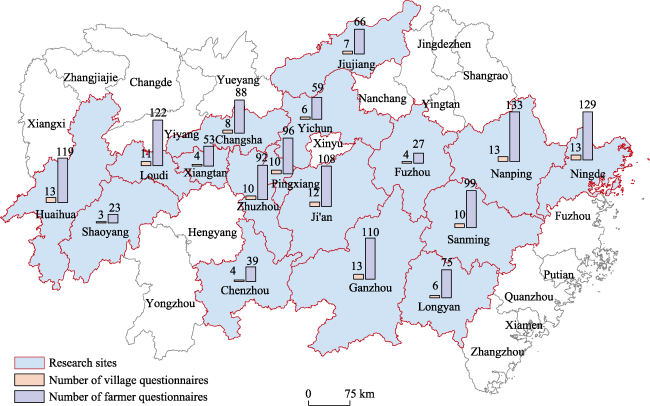
Figure 3 Sample distribution |
Table 1 Definition and summary statistics of variables |
| Variables | Description | Mean | Standard deviation | |
|---|---|---|---|---|
| Dependent variables | ||||
| Terrace abandonment behavior | Whether household abandon terrace (0=no;1=yes) | 0.405 | 0.491 | |
| Terrace abandonment rate | Proportion of abandoned terrace to the total farmland (%) | 0.170 | 0.271 | |
| Independent variables | ||||
| Agricultural labor transfer differences | Transfer quantity | Proportion of non-agricultural employment labor to the total labor (%) | 0.678 | 0.324 |
| Transfer distance | Weighted processing of non-agricultural employment | 1.797 | 1.244 | |
| Transfer quality | Working times of non-agricultural employment (Month) | 18.593 | 13.114 | |
| Control variables | ||||
| Labor characteristic | Amount | (Number) | 2.797 | 1.203 |
| Average age | Average age of labor (Year) | 48.164 | 9.512 | |
| Education | Labors with middle school education level (Number) | 1.060 | 0.969 | |
| Health status | Proportion of labor with poor health to the total labor (%) | 0.126 | 0.233 | |
| Elderly labor proportion | Proportion of elderly labor to the total labor (%) | 0.149 | 0.277 | |
| Village cadre or not | Are there village cadre among labors (0=no; 1=yes) | 0.153 | 0.368 | |
| Income characteristic | Total income | Processed with logarithm (yuan, 1 USD≈6.8974 yuan) | 4.804 | 0.424 |
| Terrace endowment characteristic | Farmland transfer | Whether transfer farmland (0=no; 1=yes) | 0.516 | 0.5 |
| Farmland plots | (Number) | 33.004 | 46.361 | |
| Farmland area | (Mu, 1 Mu≈0.067 ha) | 5.307 | 4.012 | |
| Farmland soil quality | (1=poor; 2=medium; 3=good) | 2.016 | 0.654 | |
| Substitution degree of labor input | Mechanization degree of agricultural production | Assign values from whether terrace can be plowed, seeded, and harvested mechanically | 0.445 | 0.454 |
| Regional characteristic | Regional variable | N/A | ||
| No of samples | 1438 | |||
Table 2 Probit model regression results of the impact of labor transfer differences on households’ terrace abandonment decision |
| Variables | Dependent variable: Whether household abandon terrace (0=no;1=yes) | |||||||||
|---|---|---|---|---|---|---|---|---|---|---|
| Probit model 1-1 | Probit model 1-2 | Probit model 1-3 | ||||||||
| Coefficients | Robust standard error | dy/dx | Coefficients | Robust standard error | dy/dx | Coefficients | Robust standard error | dy/dx | ||
| Core independent variables | ||||||||||
| Agricultural labor transfer differences | Labor transfer quantity | 0.284* | 0.139 | 0.934 | ||||||
| Labor transfer distance | 0.111*** | 0.034 | 0.037 | |||||||
| Labor transfer quality | 0.015*** | 0.005 | 0.005 | |||||||
| Control variables | ||||||||||
| Labor characteristic | Amount | -0.017 | 0.043 | -0.006 | -0.042 | 0.043 | -0.014 | -0.134** | 0.056 | -0.044 |
| Average age | -0.001 | 0.006 | -0.000 | 0.003 | 0.006 | 0.001 | 0.0005 | 0.006 | 0.000 | |
| Education level | -0.037 | 0.044 | -0.012 | -0.034 | 0.044 | -0.011 | -0.022 | 0.044 | -0.007 | |
| Health status | 0.112 | 0.165 | 0.037 | 0.079 | 0.164 | 0.026 | 0.085 | 0.164 | 0.028 | |
| Elderly labor proportion | 0.277 | 0.199 | 0.091 | 0.198 | 0.197 | 0.065 | 0.208 | 0.198 | 0.069 | |
| Village cadre or not | 0.068 | 0.098 | 0.022 | 0.126 | 0.099 | 0.041 | 0.021 | 0.101 | 0.007 | |
| Income characteristic | Total income | -0.124 | 0.118 | -0.041 | -0.133 | 0.117 | -0.044 | -0.166 | 0.121 | -0.054 |
| Terrace endowment characteristic | Farmland transfer | -0.115 | 0.072 | -0.038 | -0.127* | 0.072 | -0.042 | -0.118* | 0.072 | -0.039 |
| Farmland plots | 0.002 | 0.001 | 0.001 | 0.002 | 0.001 | 0.001 | 0.002 | 0.001 | 0.001 | |
| Farmland area | 0.025** | 0.012 | 0.009 | 0.027** | 0.012 | 0.009 | 0.028** | 0.012 | 0.009 | |
| Farmland soil quality | -0.631*** | 0.06 | -0.208 | -0.627*** | 0.06 | -0.205 | -0.631*** | 0.06 | -0.208 | |
| Substitution degree of labor input | Mechanization degree of agricultural production | -0.469*** | 0.086 | -0.155 | -0.469*** | 0.086 | -0.154 | -0.463*** | 0.086 | -0.152 |
| Regional characteristic | Regional variable | Yes | Yes | Yes | ||||||
| Wald chi2 | 224.045 | 228.594 | 225.200 | |||||||
| Prob > chi2 | 0.000 | 0.000 | 0.000 | |||||||
| No of samples | 1438 | 1438 | 1438 | |||||||
Table 3 Analysis of households’ terrace abandonment decisions by introducing cross-terms |
| Variables | Dependent variable: Whether household abandon terrace (0=no;1=yes) | |||
|---|---|---|---|---|
| Probit model 1-4 | Probit model 1-5 | |||
| Coefficients | Robust standard error | Coefficients | Robust standard error | |
| Core independent variables | ||||
| Labor transfer quantity | 0.012 | 0.178 | 0.029 | 0.203 |
| Labor transfer quantity × Labor transfer distance | 0.120*** | 0.042 | ||
| Labor transfer quantity × Labor transfer quality | 0.350** | 0.202 | ||
| Controls | Yes | Yes | ||
| Control regional characteristic | Yes | Yes | ||
| Prob > chi2 | 0.000 | 0.000 | ||
| No of samples | 1438 | |||
Note: Statistical significance at the 0.1, 0.05 and 0.01 levels is denoted by *, ** and * **, respectively. |
Table 4 Tobit model regression results of the impact of labor transfer differences on households' terrace abandonment scale |
| Variables | Dependent variable: Households’ terrace abandonment rate | ||||||
|---|---|---|---|---|---|---|---|
| Tobit model 2-1 | Tobit model 2-2 | Tobit model 2-3 | |||||
| Coefficients | Robust standard error | Coefficients | Robust standard error | Coefficients | Robust standard error | ||
| Core independent variables | |||||||
| Agricultural labor transfer differences | Labor transfer quantity | 0.218*** | 0.065 | ||||
| Labor transfer distance | 0.068*** | 0.015 | |||||
| Labor transfer quality | 0.010*** | 0.003 | |||||
| Control variables | |||||||
| Labor characteristic | Amount | -0.016 | 0.020 | -0.034* | 0.019 | -0.100*** | 0.027 |
| Average age | -0.002 | 0.003 | -0.001 | 0.003 | -0.002 | 0.003 | |
| Education level | -0.016 | 0.021 | -0.013 | 0.021 | -0.005 | 0.021 | |
| Health status | 0.107 | 0.077 | 0.079 | 0.077 | 0.083 | 0.077 | |
| Elderly labor proportion | 0.198** | 0.096 | 0.146 | 0.093 | 0.148 | 0.094 | |
| Village cadre or not | -0.035 | 0.043 | 0.003 | 0.043 | -0.068 | 0.044 | |
| Income characteristic | Total income | -0.108* | 0.059 | -0.099* | 0.057 | -0.132** | 0.059 |
| Terrace endowment characteristic | Farmland transfer | -0.111*** | 0.034 | -0.119*** | 0.034 | -0.113*** | 0.034 |
| Farmland plots | 0.001*** | 0.0004 | 0.001** | 0.0004 | 0.001** | 0.0003 | |
| Farmland area | 0.008* | 0.004 | 0.009** | 0.005 | 0.009** | 0.004 | |
| Farmland soil quality | -0.245*** | 0.027 | -0.24*** | 0.026 | -0.245*** | 0.027 | |
| Substitution degree of labor input | Mechanization degree of agricultural production | -0.244*** | 0.043 | -0.244*** | 0.042 | -0.240*** | 0.043 |
| Regional characteristic | Regional variable | Yes | Yes | Yes | |||
| F | 16.23 | 17.35 | 16.56 | ||||
| Prob > F | 0.000 | 0.000 | 0.000 | ||||
| No of samples | 1438 | 1438 | 1438 | ||||
Note: Statistical significance at the 0.1, 0.05 and 0.01 levels is denoted by *, ** and * **, respectively. |
Table 5 Measurement results of instrumental variable models |
| Variables | Model 3-1 | Model 3-2 | Model 3-3 | |||
|---|---|---|---|---|---|---|
| IV-Probit | IV-Tobit | IV-Probit | IV-Tobit | IV-Probit | IV-Tobit | |
| Instrumental variable | ||||||
| Labor transfer quantity | 1.750*** (0.567) | 0.984*** (0.312) | ||||
| Labor transfer distance | 0.746** (0.309) | 0.376*** (0.129) | ||||
| Labor transfer quality | 0.053** (0.20) | 0.027*** (0.008) | ||||
| Wald-test | 5.53** | 7.02** | 5.62** | 7.22** | 4.09** | 4.51** |
| P-value of Wald endogeneity test | 0.0186 | 0.0080 | 0.0178 | 0.0072 | 0.0431 | 0.0337 |
| Constants | 0.475 | 0.499 | -0.014 | 0.202 | 2.269 | 1.435 |
| Weak instrumental variable test | ||||||
| Weakiv-wald | 6.45*** | 8.35*** | 5.8** | 7.16*** | 6.96*** | 9.00*** |
| Weakiv-AR | 7.11*** | 9.23*** | 7.17*** | 9.12*** | 7.2*** | 9.25*** |
| No of samples | 1438 | 1438 | 1438 | |||
Table 6 Model robustness test of core variable replacement |
| Variables | Dependent variable: Whether household abandon terrace (0=no;1=yes) | Replaced dependent variable: Households’ terrace abandonment area | |||||
|---|---|---|---|---|---|---|---|
| Probit model 4-1 | Probit model 4-2 | Tobit model 5-1 | Tobit model 5-2 | Tobit model 5-3 | |||
| Coefficients | Coefficients | Coefficients | Coefficients | Coefficients | |||
| Replaced core independent variables | |||||||
| Labor transfer quantity | 0.106* (0.057) | 0.386** (0.167) | |||||
| Labor transfer quality | 0.254* (0.140) | 0.725* (0.400) | |||||
| Original core independent variables | |||||||
| Labor transfer distance | 0.365*** (0.100) | ||||||
| Control variables | |||||||
| Labor characteristics | Amount | -0.099* (0.056) | -0.047 (0.043) | -0.364** (0.164) | -0.160 (0.123) | -0.155 (0.121) | |
| Average age | -0.001 (0.006) | -0.002 (0.006) | -0.008 (0.019) | -0.012 (0.018) | 0.004 (0.018) | ||
| Education level | -0.036 (0.044) | -0.041 (0.044) | -0.091 (0.131) | -0.112 (0.131) | -0.081 (0.130) | ||
| Health status | 0.098 (0.164) | 0.128 (0.165) | 0.280 (0.482) | 0.360 (0.486) | 0.199 (0.480) | ||
| Elderly labor proportion | 0.263 (0.198) | 0.247 (0.198) | 0.961* (0.571) | 0.905 (0.568) | 0.756 (0.563) | ||
| Village cadre or not | 0.065 (0.098) | 0.083 (0.098) | 0.038 (0.277) | 0.095 (0.275) | 0.244 (0.278) | ||
| Income characteristic | Total income | -0.114 (0.117) | -0.121 (0.120) | -0.418 (0.346) | -0.411 (0.353) | -0.454 (0.344) | |
| Terrace endowment characteristic | Farmland transfer | -0.117 (0.072) | -0.103 (0.073) | -0.408* (0.210) | -0.373* (0.211) | -0.441** (0.210) | |
| Farmland plots | 0.002 (0.001) | 0.002 (0.001) | 0.007* (0.004) | 0.007* (0.004) | 0.007* (0.004) | ||
| Farmland area | 0.026** (0.012) | 0.028** (0.012) | 0.136*** (0.037) | 0.140*** (0.038) | 0.138*** (0.037) | ||
| Farmland soil quality | -0.630*** (0.060) | -0.625*** (0.060) | -1.617*** (0.199) | -1.599*** (0.198) | -1.597*** (0.197) | ||
| Substitution degree of labor input | Mechanization degree of agricultural production | -0.474*** (0.086) | -0.480*** (0.086) | -1.374*** (0.275) | -1.401*** (0.276) | -1.354*** (0.274) | |
| Regional characteristics | Regional variable | Yes | Yes | Yes | Yes | Yes | |
| Chi-square /F value | 223.857 | 223.892 | 7.249 | 7.230 | 7.352 | ||
| Prob > chi2/ Prob > F | 0.000 | 0.000 | 0.000 | 0.000 | 0.000 | ||
| No of Samples | 1438 | 1438 | 1438 | 1438 | 1438 | ||
| [1] |
|
| [2] |
|
| [3] |
|
| [4] |
|
| [5] |
|
| [6] |
|
| [7] |
|
| [8] |
|
| [9] |
|
| [10] |
|
| [11] |
|
| [12] |
|
| [13] |
|
| [14] |
|
| [15] |
|
| [16] |
|
| [17] |
|
| [18] |
|
| [19] |
|
| [20] |
|
| [21] |
|
| [22] |
|
| [23] |
|
| [24] |
|
| [25] |
|
| [26] |
|
| [27] |
|
| [28] |
|
| [29] |
|
| [30] |
|
| [31] |
|
| [32] |
|
| [33] |
|
| [34] |
|
| [35] |
|
| [36] |
|
| [37] |
|
| [38] |
|
| [39] |
|
| [40] |
|
| [41] |
|
| [42] |
|
/
| 〈 |
|
〉 |