Urban vitality assessment at the neighborhood scale with geo-data: A review toward implementation

  • LIU Sheng , 1, 2 ,
  • GE Jian 1 ,
  • YE Xinyue , 3, * ,
  • WU Chao 4 ,
  • BAI Ming 5
Expand
  • 1. College of Civil Engineering and Architecture, Zhejiang University, Hangzhou 310058, China
  • 2. Hangzhou City University, Hangzhou 310011, China
  • 3. Department of Landscape Architecture and Urban Planning, Texas A&M University, College Station, TX 77840, USA
  • 4. School of Geographic and Biologic Information, Nanjing University of Posts and Telecommunications, Nanjing 210023, China
  • 5. Zhejiang University Urban-Rural Planning & Design Institute, Hangzhou 310030, China
*Ye Xinyue (1974-), Professor, E-mail:

Liu Sheng, PhD Candidate and Associate Professor, specialized in human geography. E-mail:

Received date: 2022-10-24

  Accepted date: 2023-04-24

  Online published: 2023-07-24

Supported by

National Natural Science Foundation of China(51908495)

Abstract

The number of urban vitality assessment studies is rising continuously, owing to the emergence of geographic data. The current literature focuses primarily on evaluation, rather than implementation, of urban vitality. Hence, a scoping review and research agenda are needed for urban vitality research to be more practical. This study aims to fill the research gap by exploring the content and methods of vitality assessment that can make urban vitality research more compatible with policy, planning, and design practice. We chose the neighborhood scale, which is the most practical initiative unit for vitality enhancement. We discovered that the gaps between the current research and practice primarily lie in the diversity of research subjects, the authenticity and comprehensiveness of vitality measurement, and the multi-domain of impact factor analysis. On this basis, we classified the following expandable aspects: (1) multi-type, multi-dimensional, multi-temporal, and implementation-adaptive vitality evaluation; (2) methods reflecting high-quality social interactions and the perceptions of vulnerable groups; (3) how design and urban management impacts vitality; and (4) the synergistic effects of multiple indicators on vitality. Overall, the research content and methodology presented in this paper can help neighborhood-scale vitality assessment to provide more meaningful insights for policy makers and practitioners.

Cite this article

LIU Sheng , GE Jian , YE Xinyue , WU Chao , BAI Ming . Urban vitality assessment at the neighborhood scale with geo-data: A review toward implementation[J]. Journal of Geographical Sciences, 2023 , 33(7) : 1482 -1504 . DOI: 10.1007/s11442-023-2139-1

1 Introduction

1.1 The origins of vitality research

Vitality is the capacity to live and develop (Merriam-Webster). It originated in physiology and psychology and represents quality of life (Stern, 2010). In the current literature, vitality has been studied in the contexts of psychology, biology, linguistics, economics, and geography (Lavrusheva, 2020). In biology, vitality is considered to be physically energetic, whereas in psychology, vitality is identified as spiritual power, or the ability of retaining enthusiasm and spirit (Ryan and Frederick, 1997). In linguistics, vitality is defined as the strength of language groups within diverse group settings (Barker et al., 2001). In economics, vitality is a firm’s or a city’s ability to optimize the allocation of regional resources and the multi-level competitiveness (Tu, 2020). Although the definition of vitality varies by field, they are all the exuberant comprehensive functional attributes of a specific field. Dynamic research in various fields has evolved from early qualitative connotation and mechanism analysis to today’s quantitative measurement and impact factor analysis, gradually promoting the precise and in-depth analysis of how to scientifically improve its vigorous comprehensive survival and development attributes in a certain field.
In geographical studies, vitality first emerged at the urban scale. Since the 1950s, scholars and practitioners have discussed urban vitality as a component of urban development and planning, and this concept has evolved to have multiple meanings and qualitative dimensions (Chion, 2009). Kevin Lynch proposed that vitality is the degree to which the form of settlement supports the vital functions, biological requirements, and capabilities of human beings (Lynch, 1984). Prominent urbanologists, such as Jacobs and Montgomery, have identified a series of the built environment’s features that affect urban vitality, including mixed land-use, small block sizes, building density, and street intersection density (Jacobs, 1993; Montgomery, 1998). Since 2005, vitality assessment has expanded from the city scale to the neighborhood scale. Gradually, the composition and the impact factors of urban micro space vitality have been explored, including the impact of English-speaking population migration on Canadian community vitality (Warnke, 2005), and the effect of education on vitality in rural America (Beaulieu and Gibbs, 2005).

1.2 Multi-scale vitality assessment and implementation guidance

In recent years, vitality assessment research has gradually increased because of the emergence of geographical big data. The current literature focuses primarily on optimizing the evaluation method that uses new data and artificial intelligence techniques at three different scales: region, city, and neighborhood. At the regional level, the studies investigate the growth and shrinkage pattern of spatial and economic vitality in metropolitan areas (Lang et al., 2020; Huang et al., 2021; Wang et al., 2022), along with the mechanisms of urban vitality’s impact on the economic circle (Pan et al., 2021; Wang and Dai, 2021). At the city scale, increased data-based assessments of vitality are gradually integrated and their dimensions diversified (Jin et al., 2017; Wu et al., 2018a; Li et al., 2022), increasing the grid resolution for the cities’ vitality patterns from 1 kilometre to 50 meters (He et al., 2018; Kim, 2020; Gómez-Varo et al., 2022).
At the neighborhood scale, urban vitality is typically reflected by urban activities and the interactions with spatial entities at small scales (Yue et al., 2017), and it has been divided into four types: the neighborhood as a whole, as well as streets, parks, and metro station areas within the neighborhood. The techniques for assessing vitality at this scale are also evolving. Since 2010, studies have employed remote sensing images to measure neighborhood vibrancy (Barrios, 2008). In recent years, using monitoring tools (City grid sensors/GPS tracking devices) and street view data combined with machine learning have emerged (Wu et al., 2018b; Qi et al., 2020; Li et al., 2021).
However, vitality enhancement implementation is also a significant objective of vitality assessment, and only a few studies have addressed it. Some studies have included effective practical implications by analyzing vitality characteristics and impact factors. At the city scale, research has addressed practical policies and management for the improvement of vitality. For example, Li et al. (2022) raised the managerial implications for mediating the relationship between planning policies and urban design strategies to optimize resource allocation and promote sustainable development. Based on the positive effect of intersection density on economic vitality, Long and Huang (2019) suggested that small blocks should be encouraged in real estate developers’ urban planning proposals. Under the neighborhood scale, some studies also provide guidance for the micro built environment. For example, after analyzing the street food’s impact on neighborhood vitality in Portland, recommendations were made to allow vendors and street activities without over-regulating (Newman and Burnett, 2013). Mu et al. (2021) proposed planning smaller parks, improving water quality as well as fitness and sanitation facilities to enhance service efficiency and visitor experience. From an architecture’s adaptability perspective, Zumelzu and Barrientos-Trinanes (2019) suggested that transforming a front yard into a terrace could stimulate street life.
However, no implementation-related reviews of urban vitality assessment have been conducted. Although some researchers have reviewed city-scale vitality assessment in terms of indicators, impact factors, and the relationship with the urban form and urbanization (Song et al., 2020), a scoping review and forward on how to make urban vitality research more compatible with policy, planning, and design practice, has not yet been developed. Therefore, even though the implementation-focused urban vitality assessment emerged in the past few years, a relevant scoping review is still urgently required.

1.3 Why we chose the neighborhood scale

Regional and city scales are relatively too large to be related directly to vitality enhancement implementation. In contrast, the spatial and social areas at the neighborhood scale are the basic units for vitality enhancement, from where most renewal projects are initiated (Sharifi and Murayama, 2013). Therefore, based on the implementation-oriented effectiveness, this study chose the neighborhood scale, which comprises small scales spaces at the daily intervention level and contains feasible initiating units for vitality enhancement, for review.
Neighborhoods have both spatial and social properties. They are the spatial units of social life within cities, towns, suburbs, and rural areas (Wikipedia, 2022). They are also functionally defined as sets of social interactions, with small-scale spaces like street networks, facilities, mixed-use places, open space, and architecture (Chhetri et al., 2006; Serin et al., 2018). Recent reviews of neighborhood scale assessments have covered a wide range of topics. Popular topics include neighborhood sustainability and the built environment. Sustainability-related reviews focus on low carbon (Markantoni and Woolvin, 2015; Brozovsky et al., 2021), resilience (Sharifi, 2016; Koliou et al., 2020), and sustainability in a neighbourhood (Adewumi et al., 2018; Grazieschi et al., 2020), whereas reviews on built environments are centred on walkability (Adewumi et al., 2018; Grazieschi et al., 2020), physical activity (Salvo et al., 2018; Lambert et al., 2019), and special care for children and older adults (Sellström and Bremberg, 2006; Cerin et al., 2017; Kim et al., 2019). To the best of our knowledge, there are no published reviews of vitality or toward implementation at the neighborhood level.

1.4 Research objective

This study aims to fill the current research gap by exploring the content and methods of vitality assessment that can make urban vitality research more compatible with policy, planning, and design practice. As such, the results of the neighborhood-scale vitality research can be applied more effectively in relevant practice and policy. The following are the study’s specific objectives:
·To find out how neighborhood-scale vitality assessment relates to vitality enhancement implementation (Addressed within the results, section 3)
·To find the gaps between current vitality assessment research and the practice (Addressed within the discussion, section 4)
·To find out what research contents and methods can fill these gaps (Addressed within the discussion, section 4)

2 Method

2.1 Data base

We selected studies from six databases: Elsevier, Scopus, Web of Science, Taylor Francis Online, Wiley Online Library, and SAGE Journals. As this study focuses on urban vitality at the neighborhood scale using geographic data, which have emerged gradually over the past decade, we set the initial database as that between January 2012 and May 2022 and the keywords ‘urban vitality’. Thereafter, we followed the method of Preferred Reporting Items for Systematic Reviews and Meta-Analyses (Moher et al., 2009) (Figure 1) to select neighborhood-scale studies related to vitality enhancement implementation. After removing duplicates from the first 1439 initial search results, we began screening the remaining 1241 papers according to the inclusion and exclusion criteria (Table 1). We initially identified 37 papers as eligible based on their titles and abstracts. Afterwards, two reviewers read the full text and determined 24 papers (Table 2) that met the criteria.
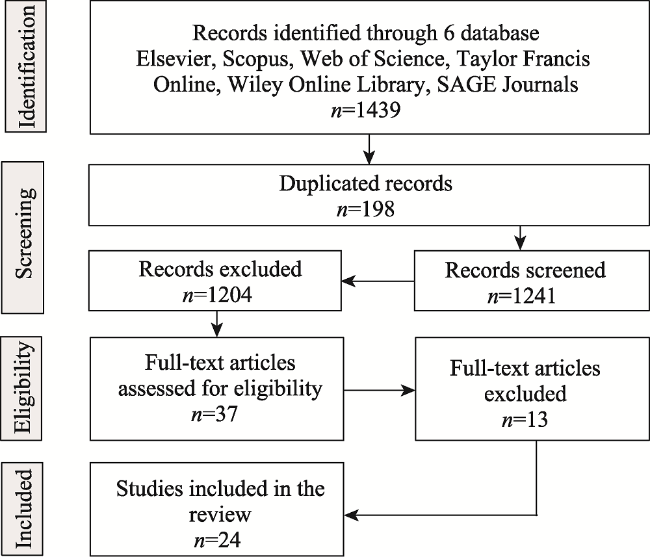
Figure 1 PRISMA flow diagram for article selection
Table 1 Inclusion and exclusion criteria
Inclusion criteria Exclusion criteria
1 English articles Articles without any quantitative research
2 Empirical studies Articles that make no mention of vitality practice (design, planning, policy, management)
3 Articles that studied vitality assessment at neighborhood scale
4 Articles that used geo-data
5 Articles partially relates to the implementation of vitality
Table 2 Basic information related to the selected works
Reference Object type Study area Geo-unit Related practice field
1 (Zumelzu and Barrientos-Trinanes, 2019) Neighborhood Chile Building block Planning, Design
2 (Wang et al., 2020) Park China 500 m and 500-1000 m
buffer of waterfront
Planning
3 (Wu et al., 2022b) Street China Street segment, with a buffer of 10 m on both sides Planning, Design
4 (Guo et al., 2021) Street China street segment Planning
5 (Yang et al., 2021) Street China Street block (Traffic analysis zone) Planning
6 (Van Leuven, 2022) Neighborhood United States Business districts Policy, Management
7 (Wu et al., 2021) Street China Building block Planning, Design
8 (Qi et al., 2020) Street China Less than 100 m Design
9 (Xiao et al., 2021a) Metro station areas China 600 m buffers around metro station entrances Planning, Design,
Policy
10 (Xiao et al., 2021b) Metro station areas China 600 m buffers of the station Planning, Policy
11 (Xu and Chen, 2021) Metro station areas China Building block Design
12 (Dong et al., 2021) Metro station areas China Metro lines and stations Planning, Design,
Management
13 (Li et al., 2021) Street China Building blocks Planning, Design
14 (Mu et al., 2021) Park China NA Planning, Design,
Management
15 (Newman and
Burnett, 2013)
Street United States Street segment Policy, Management
16 (Jiang et al., 2022) Street China Street segment Planning
17 (Wu et al., 2018b) Neighborhood China Neighborhood Policy, Planning
18 (Niu et al., 2021) Park China Street block Planning
19 (Zhu et al., 2020) Park China Park Planning, Design
20 (Liu et al., 2021) Park China Street block Planning, Design
21 (Liu et al., 2022) Neighborhood China Neighborhood Planning
22 (Wang and
Vermeulen, 2021)
Street Netherlands Building block Planning, Management
23 (Kang, 2020) Neighborhood Korea Polygon unit Planning
24 (Zacharias, 2020) Street Hong Kong (China) Ramway stops Management

2.2 Research steps

(1) We explored the prominent subjects, methods, and driving forces. 1) For the research subjects, we analyzed space, region, population group, vitality dimensions, time division, and objectives of the assessment. 2) For the research methods, we examined the methods and data for vitality measurement. 3) For the driving forces, we investigated the impact factors and their effects and practical implications, from the design, planning, and management perspectives.
(2) We identified the gaps between research and practice. Based on the current study’s research subjects, methods, and driving forces, we identified the implementation gaps and voids in neighborhood-scale urban vitality assessment.
(3) We discussed research topics and technical methods to fill the gaps. Based on the gaps identified, we detailed the potential content, technical bottlenecks, and proposed paths for meeting the demands for vitality enhancement implementation.

3 Results

3.1 Research subject

3.1.1 Space, region, and population groups

Statistically, we screened four types of vitality assessment studies related to implementation at the neighborhood scale, including the neighborhood as a whole, as well as the streets, metro station areas, and parks located within the community area (Figure 2). These spatial types are the key units of urban vitality enhancement initiatives. Currently, there are relatively many street level vitality analyses, but only a few metro station area vitality studies.
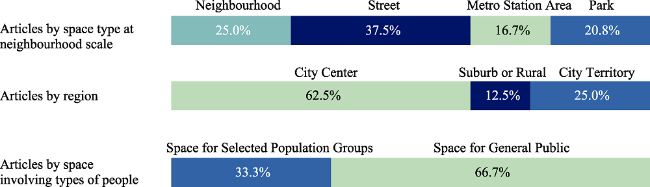
Figure 2 Space, region, and population groups of the research subject
Neighborhood-scale vitality enhancement requires differentiated guidance regarding the region and the type of people involved. As shown in Figure 2, the region included in this review is mainly the city centre (62.5%). Although some studies have conducted neighborhood-scale vitality assessment on the entire city territory and compared the characteristics and impact mechanisms between suburbs and the city centers (Xiao et al., 2021b), research on suburbs are few, covering only the types of metropolis suburb (Wu et al., 2018b), small towns across the rural continuum (Van Leuven, 2022), and rural communities in small cities(Liu et al., 2022).
Meanwhile, Figure 2 shows that general public spaces is still the major assessment type (66.7%), whereas the space for selected population groups is the limited assessment type (33.3%), which only related to neighborhoods with different social classes, housing quality, ownership and functions (Figure 3). From these specific perspectives, the following groups of people have been examined: the upper or middle class, inhabitants with or without household registration or housing ownership, shopping crowds on commercial streets, original residents in historic districts, and low-income farmer in traditional villages (Wu et al., 2018b; Zumelzu and Barrientos-Trinanes, 2019; Li et al., 2021; Wu et al., 2021; Liu et al., 2022).
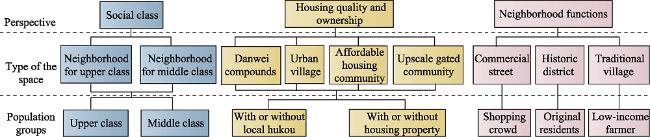
Figure 3 The perspective, space, and population types (for selected population groups)

3.1.2 The dimensions of vitality

Neighborhood-scale vitality is multimodal. Built environment accounts for the majority of the spatial dimension (75%, as shown in Figure 4). Many studies have investigated the influence mechanisms (Yang et al., 2021; Wu et al., 2022b) and evaluation techniques (Wu et al., 2018b; Niu et al., 2021) from this perspective. Nevertheless, some studies are dedicated to non-spatial dimensions, including the economic vitality in small-town business districts (Wu et al., 2018b; Van Leuven, 2022); the preservation and development vitality in traditional villages (Liu et al., 2022); and the organizational vitality of the neighborhood, park recreation, and street food (Newman and Burnett, 2013; Zhu et al., 2020; Wang and Vermeulen, 2021).
Figure 4 The dimension of neighborhood-scale vitality assessment

3.1.3 The time division of vitality

We discovered that the neighborhood-scale vitality assessment did not pay special attention to multi-temporal vitality, and only 20.8% of included studies are related to time division (Figure 5). These time-division studies largely focused on the differences in characteristics between weekdays and weekends. Wu et al. (2022b) found that, in the vitality pattern, the impacts of weekdays and weekends were mainly related to commuting, and most built environment elements had stronger impacts during the weekends. Yang et al. (2021) investigated the spatial-temporal influence mechanism of weekdays and weekends on neighborhood vitality and proposed valuable ways to improve it. For example, improving accessibility can significantly boost the vitality of neighborhoods during the weekends, given the increased demand for weekend travel to educational venues.
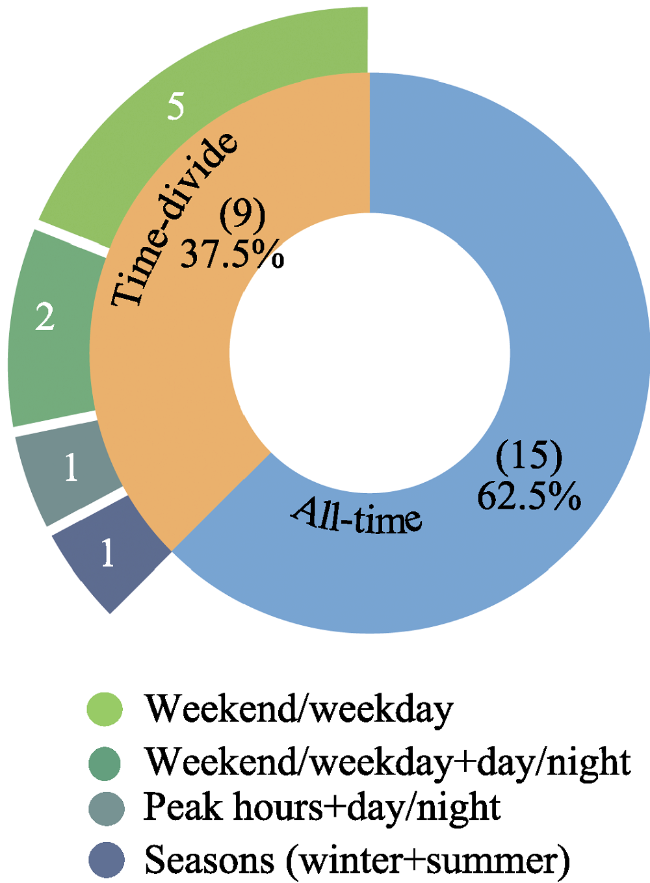
Figure 5 The time division of neighborhood-scale vitality assessment
A few studies have also explored the differences between the two sub-periods (day and night; weekday and weekend) simultaneously. For instance, Kang et al. (2020) compared the effects of humans and the built environment on neighborhood vitality during three specific times—mornings, working hours, and evenings—on weekdays and weekends. Wang et al. (2020) analyzed the spatial and temporal variations of vitality in waterfront spaces by time division (day and night; weekday and weekend).

3.1.4 Objectives of the assessment

Statistically, the majority of the relevant current literature (75%) focuses on optimizing the evaluation method (Figure 6). Studies aiming to optimize spatial perception methods for small-scale community features, for higher accuracy and to be closer to reality, are emerging. However, there are very few studies aimed at improving policy and management that are connected to optimizing vitality practices. At present, the policy optimization research is primarily concerned with the revitalization of small towns, historical districts, and traditional villages (Li et al., 2021; Liu et al., 2022; Van Leuven, 2022), whereas the management optimization research is primarily focused on traffic and facility management issues confronting general neighbourhood (Newman and Burnett, 2013; Zacharias, 2020; Zhu et al., 2020; Wang and Vermeulen, 2021).
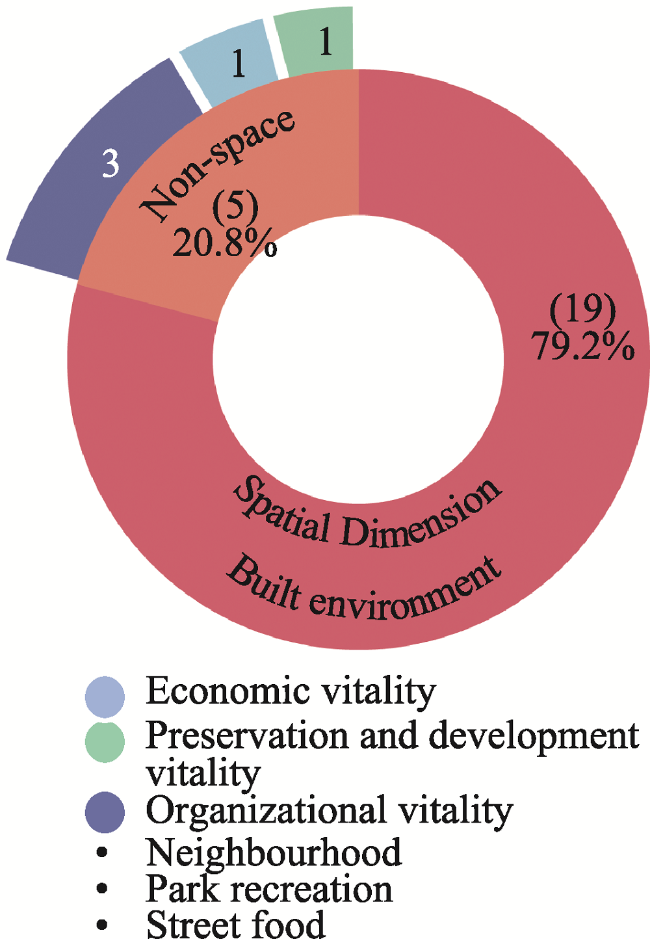
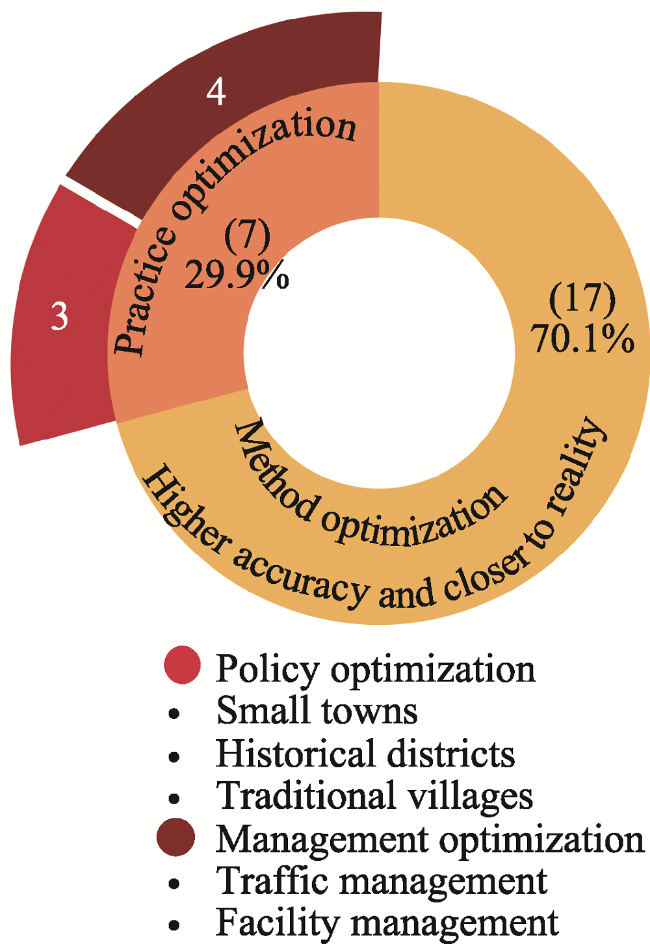
Figure 6 Categorization of the objectives of the neighborhood-scale vitality assessment

3.2 Method

3.2.1 Method for measuring vitality

Currently, two types of methods are used to measure vitality at the neighborhood scale: single-factor and multi-factor fusion (Figure 7), and the methods that characterize the flow of people or activity per unit area are the most prevalent (66.7%). First, applying location-based data (like mobile data and check-in data) to characterize the flow of people per unit space-time is found to be the most popular method, and it can establish large-scale spatial behavioural patterns at the individual level (Hollenstein and Purves, 2010; Wan and Lin, 2013). Second, the traditional method of using on-site headcount per unit of time and space is still practical (Xu and Chen, 2021), and while it is time-consuming, it can still be used in small-scale spaces. Third, studies have begun to supplement instrumental monitoring to obtain more accurate travel data. For example, researchers have utilized long-term and on-site repeatedly measured data generated from city sensors to extract the pedestrian volume as the proxy for vibrancy in the historic districts (Li et al., 2021). Wu et al. (2018b) asked respondents to wear GPS tracking devices and used their percentages of out-of-home, non-work activities to define neighborhood vitality. Overall, these methods benefit neighborhood-scale vitality by providing a more realistic and precise description of pedestrian volume.
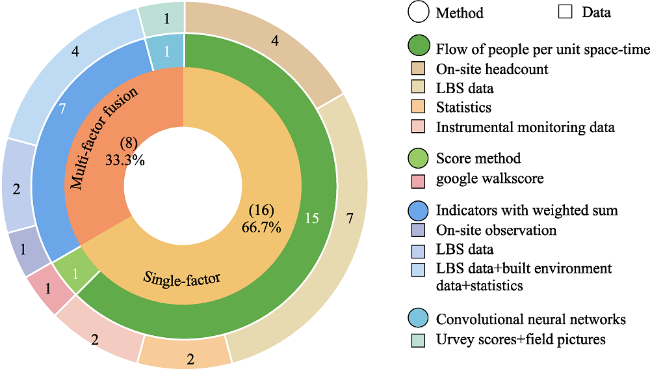
Figure 7 Neighborhood-scale vitality measurement and data
Moreover, another common method is the integration of multiple vitality elements (33.3%). Many studies have investigated the composition of vitality by establishing an indicator system and applying multi-source data fusion (location-based data, built environment data, and statistical data) for weighted sum calculation. We also discovered that some studies combined vitality survey scores and field pictures and used convolutional neural networks to simulate the visual features of urban street vitality recognition (Qi et al., 2020), bringing the spatial vitality recognition closer to the real perception and making it suitable for massive data processing.

3.2.2 Data for measuring vitality

Location-based services (LBS) data is the underlying data on which neighborhood-scale vitality studies rely, as 62.5% of the studies utilized it (Figure 8). Currently, four types of LBS data are used to measure vitality at the neighborhood scale, each with its own advantages. For example, mobile phone data can accurately measure the spatial and temporal variation in the flow of people (Kang, 2020; Jiang et al., 2022). In addition to the basic flow of people, social media can reflect the perceived vitality of public spaces (Zhu et al., 2020). The fusion of Multiple LBS data can reflect the rich content of vitality. For example, Xiao et al. (2021a) combined four types of LBS data (Metro smartcard data, Sina Weibo check-in data, Dianping review data, and Baidu positioning record data), which can synthesize people flow and the user experience to characterize multiple dimensions of the vitality of transit-oriented development (TOD). Using LBS data integrated with other data can further provide some information that might be missing in big and open data, such as built environment and statistic data (Liu et al., 2021; Liu et al., 2022).
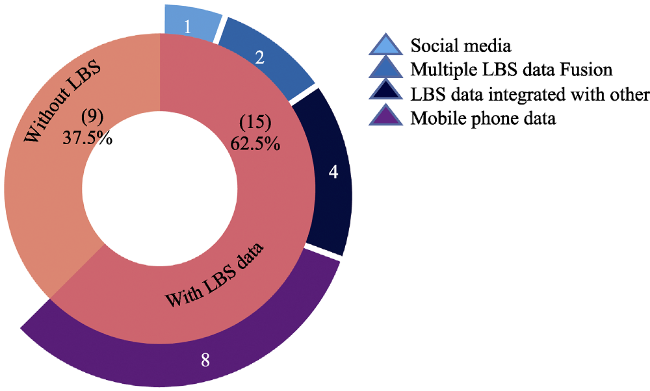
Figure 8 Categorization of articles used LBS data
Meanwhile, there are some unavoidable limitations in the use of LBS data. Both social media and mobile phone data, as well as the fusion of multiple LBS data, are unable to reflect suburbs, rural areas, and other areas with low population density and poor signal method measurement (Hecht and Stephens, 2014), as the amount of data are largely conditioned by ownership of a smartphone and access to an internet connection (Arribas-Bel, 2014). Additionally, the fusion of multiple LBS data or LBS data with other data is prone to duplication and redundancy, necessitating the assistance of a scientific fusion model (Tu et al., 2020; Xiao et al., 2021a).

3.3 The driving force of vitality

3.3.1 Composition of impact factors

We analysed the discovered impact factor for the four types of spatial entities: neighborhood, street, TOD, and park. Table 3 shows that the explored impact factors are primarily at the planning level, with three main domains: built environment, function, and social economic. The built environment is the most popular influencing factor. It has been studied well for each type of spatial entity, with a particular emphasis on spatial aspects such as size, density, accessibility, and connectivity (Zumelzu and Barrientos-Trinanes, 2019; Li et al., 2021; Wu et al., 2022b). Function is also a relatively well-studied influencing factor domain, focusing on the type, density, and variety of services (Guo et al., 2021; Niu et al., 2021; Xu and Chen, 2021). Furthermore, a few studies at the planning level have extended the vitality’s driving force mechanism to social economics, focusing on the impact of people’s socioeconomic conditions, such as population, employment, job, income, and property rights (Wu et al., 2018b; Kang, 2020).
Table 3 The discovered impact factor and proposed practice-implication
Type Impact factor Practice-implication
Neig-hbor-hood ·Planning:
1) Built environment:
Land use mix, Block size, Adaptability of building use, Transportation (Zumelzu and Barrientos-Trinanes, 2019; Wang and Vermeulen, 2021)
2) Social economics:
Gender, Household registration, Income, Property rights, Job, Population, Employment Density (Wu et al., 2018b; Kang, 2020)
·Planning:
∎Connect space and social organization
∎Aim to attract employment and industry
∎Promote public transport
∎Consider residents’ behaviors and activities on weekdays and weekends
∎Build more amenities
NA ·Design:
∎Convert front yards into terraces
·Management:
∎The main street plan is not always applicable to mall town vitality enhancement
∎The village revitalization policies could be differentiated according to the vitality grade
Street ·Planning:
1) Built environment:
Distance to transit, Destination accessibility, Land use, Road density, Building height and density, Road connection degree, Parking space; Compact city center (Guo et al., 2021; Li et al., 2021; Yang et al., 2021)
2) Function:
Functional density and diversity, Catering service (Li et al., 2021; Jiang et al., 2022; Wu et al., 2022b)
·Planning:
∎Increase small catering and 24-hour stores
∎Increase industry-city integration and reduce work-home separation
∎Build malls and shopping pedestrian street
∎Enhance the open intensity, volume ratio, density, and mixing degree
∎Optimize bus station density, the layout of bus lines, parking lots and subway stations
·Design:
Block scale, Store design, Green space, Proportion of sky seen in the street, Public seats (Newman and Burnett, 2013; Li et al., 2021; Yang et al., 2021)
·Design:
∎Make green space, street scale and openness at a reasonable level
∎Create pleaoptimizationsant walking spaces, store decorations, public seating, shielding elements, landscape, and open views
Management:
Consumption per person*, Opening hours*, Retail rent*, No over-regulation, Degree of walking barrier, Vehicle transit (Newman and Burnett, 2013; Zacharias, 2020; Jiang et al., 2022)
·Management:
∎Do not over-regulate street activity functionality
∎Strengthen seasonal preventive measures
∎Keep the tramway corridor unobstructed
TOD ·Planning:
1) Built environment:
Bus line density*, Distance to subway station, Distance to BRT, Walkability, Road density, Accessibility, Above-ground and underground connectivity, Commercial POI*, Horizontal built-up coverage (Xiao et al., 2021a; Xu and Chen, 2021)
2) Function:
Public transportation services, Functional mixture, Organization of business forms (Xiao et al., 2021a; 2021b; Xu and Chen, 2021)
·Planning:
∎Plan services based on a comprehensive view of the closely connected metro station areas
∎Enhance connectivity and functional mixture of the above-ground and underground space
∎Integrate medium- or low-rise buildings with high-centrality streets
·Design:
The visibility and accessibility of the spatial structure and
the layout of the entrances (Xu and Chen, 2021)
·Design:
∎Reserve adequate passageway at the store entrance
∎Design subway station entrances by combining the intensity and the direction of pedestrian flow
·Management:
∎Unify the operational entity
·Planning:
1) Built environment:
Location and accessibility of the park*, River properties (length, width, depth), Green space size*, Surrounding land use (Liu et al., 2021; Mu et al., 2021; Niu et al., 2021)
·Planning:
∎Plan multiple small-scale parks
∎Adopt high density development mode for residential land around the park
Park 2) Function:
Degree of functional mix, Diversity of services and activities
(Zhu et al., 2020; Niu et al., 2021)
3) Social economics:
Population density of the surrounding area (Zhu et al., 2020)
∎Enhance the publicity of waterfront space shoreline
∎Increase the diversity of public space
∎Layout service facilities reasonably
·Design:
Site design, High-quality green landscape (Liu et al., 2021;
Mu et al., 2021)
·Design:
∎Design more artificial recreation facilities
·Management:
Water quality (Mu et al., 2021)
·Management:
∎trengthen the maintenance and management of hygiene, water quality and facilities

Note: Based on current research findings, and * is the factor with nonlinear and synergistic effects on vitality.

There are few studies on design and management level factors. The design-level driving forces were derived primarily from the visual sensory perspective, and they were mainly centred on micro spatial aspects such as layout, scale, green space, and facility design. Most management-level influences concern commercial dimensions, such as per capital consumption, operating hours, retail rent, and event regulation (Newman and Burnett, 2013; Jiang et al., 2022). There are also managerial factors around spatial convenience and comfort, such as the vehicle transit, water quality, and degree of sidewalk barrier placement (Zacharias, 2020; Mu et al., 2021).

3.3.2 Influence mechanism

Most effects of various factors on vitality are presented in studies on linear influence (Table 3). Researchers discovered patterns of positive effects of land use mix, accessibility, and transportation convenience (Guo et al., 2021; Niu et al., 2021; Yang et al., 2021) on neighborhood-scale vitality. Studies on the factors’ nonlinear and synergistic effects on vitality are few.
Many studies on nonlinear effects remain at the hypothesis level. For example, Jiang et al. (2022) found that the impact of shop price and opening hours on vitality may be nonlinear, and it transforms from positive to negative when it exceeds a certain degree. Wu et al. (2022b) proposed testing Jacobs’ classical theory that ‘shorter streets are better for street vitality’ and by exploring the geographic areas where this theory applies, they empirically found that some short but low-vitality streets still exist in some high-vitality districts. Only one study demonstrated quantitatively that 12 TOD-ness variables have pervasive nonlinear effects on vitality in metro station areas, discovering that variables such as bus route density, metro frequency, and POI accessibility have a threshold, and their local effects on vitality transform from positive to negative (Xiao et al., 2021a).
Studies on synergistic effects are also relatively few. Some studies speculate that, with low park safety and management, high accessibility may affect park use negatively. Only Xiao et al. (2021a) confirmed quantitatively that the synergistic effects of factors on the vitality of the TOD area, for example the local effects, were amplified when the functional mixture was greater than 0.8 and the distance to CBDs was above 1 kilometre.

3.3.3 Practice-implication

Statistically (Table 3), there are many suggestions for planning practice, most of which are based on the quantitative analysis of the influencing factors. For example, based on the discovery that frequent public services within dense transportation networks can increase neighborhood vitality, Kang et al. (2020) argued that community planning should promote more amenities and public transportation. Because of the driving force analysis result that the promotion of street centrality increases local interaction effects when the average building height is low, Xiao et al. (2021a) suggested adopting the development model that combines high centres with middle and low-level buildings near the TOD station. Mu et al. (2021) proposed that planning multiple small parks in densely populated urban areas is beneficial to increasing community vitality based on the analysis that distance from home was one of the most important factors associated with the spatial vitality of the parks.
In the absence of quantitative analysis of influencing factors, the current literature also have a few implications for design and management, often as a result of surveys or problem-oriented discussions. At the design level, Zumelzu et al. (2019) suggested transforming front yards into territories based on the survey that the transformation of outdoor spaces into public terraces can create use adaptability for retail service and trade diversity, which would strengthen pedestrian vitality. At the management level, Dong et al. (2021) proposed that a subway station requires a unified operation subject due to the difficulty of connecting metro-led underground space, which would limit its urban vitality. Although some implications may lack scientific support of the quantitative analysis of influencing factors, they still provide high and specific guidance for vitality enhancement.

4 Discussion

In this section, we identified the gaps between research and practice and discussed the research content and technical methods that can fill those gaps. First, we discovered that the gaps between current research and practice are primarily due to the diversity of research subjects, the authenticity and comprehensiveness of vitality measurement, and the multi-domain of impact factor analysis, all of which are summarized in Table 4 and elaborated in terms of subject, methods, and driving forces.
Table 4 Gaps between research and practice with suggested content and methods
Gaps To fill the gap
Suggested research content Suggested methods
Subject Location type: suburban ·Vitality assessment in suburban communities __
Space type: for specific population group ·Spaces like youth-populated university towns and worker-settled industrial parks, among others
Dimension:
non-spatial vitality
·Non-spatial vitality, such as public activity vitality, and commercial vitality, among others
Time intervals:
night-time
·Precise neighborhood night-time vitality measurement methods and driving factors ·A pre-analysis of people’s night-time behavioral initiatives
·Separate small-scale night-time flow of people
Assessment goals:
implementation-adaptive
·Aim to adapt to specific types practices, planning guidelines, or policy management ·Combine with local urban renewal action plans
·Survey and analysis of the specific practical guidelines
Methods Vitality measurement: interaction and real
perception
·Measurement of the small-scale and real-perception behavioral interactions ·Machine-learning simulated ‘human perception of spatial vitality’ evaluation model
Data: for vulnerable groups ·Data and measure reflecting vulnerable groups ·Combine monitoring data, GPS location data, and preference surveys
Driving forces Design aspects:
multi-sensory spatial design factors
·Explore impact factors in multi-sensory spatial design aspects: visual, auditory, and tactile ·Visual aspects: visual algorithms through streetscape data and machine learning
·Auditory, tactile, and gustatory: field monitoring and surveys
Management aspects: management factors other than commercial dimension ·Explore impact factors of management dimensions, such as safety, health, event organization, and services for vulnerable groups. ·Combine management preference surveys and digital operational data from the community
Mechanism:
synergistic effects
·Examine the synergistic impact of one key factor with other factors, and multiple factors within and across dimensions. ·Strengthen the predication of the synergistic impact of indicators

4.1 How to expand the research subject

The neighborhood-scale vitality discussed in the current literature mainly focuses on assessing the general public space in city centers, as well as the all-time vitality from the spatial dimension, and optimizing methods to be more accurate (see Figures 2-6). Considering the implementation requirements, multi-modal, multi-dimensional, multi-temporal, and implementation-adaptive vitality evaluation are needed.

4.1.1 Multi-modal vitality assessment

Although neighborhood-scale vitality covers a wide range of topics (Figures 2 and 3), some topics are underrepresented. Regarding a neighborhood’s location type, research on suburban areas is lacking. Given the increasing number of suburban communities, which often have problems of poverty, ethnic diversity, and lack of convenient facilities (Airgood-Obrycki, 2019; Liu et al., 2022), there is an urgent need for additional research in these areas. In terms of the space type, few studies concentrate on the space for specific population groups. Regarding the people-oriented objective of vitality enhancement, we can further explore spaces like youth-populated university towns, worker-settled industrial parks, villager and tourist-dominated scenic areas, and older-adult-inhabited old communities. Complementing these specific space analysis studies will increase the relevance of classifying practical decision-making.

4.1.2 Multi-dimensional vitality assessment

As neighborhood-scale vitality is influenced by urban activities and interactions (Yue et al., 2017), it is typically multi-dimensional and must be promoted from multiple perspectives. The current evaluation focuses primarily on the built environment from a spatial perspective, while non-spatial research is limited to economics, organization, protection, and development (Wang and Vermeulen, 2021; Liu et al., 2022; Van Leuven, 2022) (Figure 4). Studies on the specific dimension of vitality should be increased and they should focus on topics such as public activity vitality, commercial vitality, and vitality under energy consumption constraints, among others. We need to explore various characteristics and influencing factors in a targeted manner and from different perspectives to provide effective guidance for specific small-scale vitality improvement.

4.1.3 Multi-temporal vitality assessment

To promote community vitality, studies should present guidelines, planning, and design strategies in different time intervals. At present, the timing difference of vitality mainly depends on the division of time points. The difference in vitality between weekends and weekdays has received considerable attention, and the influencing factors of these two periods are found as often caused by commuting to work or school (Kang, 2020; Yang et al., 2021). However, no special research on night vitality at the community level has been conducted. Night-time is when most employed and school-aged people return to their communities and can participate in community-wide public social activities. Although night-time vitality has been explored at the urban scale (Zhang et al., 2021; Kim, 2020; Wu et al., 2022a; Wu et al., 2023), the precise neighborhood night-time vitality measurement methods and driving factors still require further investigation. This may require a pre-analysis of residents’ various night-time behavioral initiatives and resolving the technical challenge concerning how to separate small-scale night-time flow of people. Besides, the vitality of the neighborhood during times of emergency or crisis, such as typhoons, rainstorms, and infectious diseases, is worth investigating. Some studies have been conducted to examine the changes in perceived urban vitality, health environment and urban life attitudes during pandemic periods (Paköz and Işık, 2022). However, the factors influencing neighborhood vitality in various crisis periods remain unknown and should be investigated by the crisis category to provide suggestions for communities to cope with various future emergencies.

4.1.4 Implementation-adaptive goals for vitality assessment

The current literature focuses on the optimization of the evaluation method itself, with relatively few evaluation studies aimed at the studies’ adaptability to practices like design, planning, and policy. Considering that these directions are important guarantees for improving vitality, they require immediate reinforcement. Thus, future research can be combined with local urban renewal action plans, such as near-zero energy consumption communities, child-friendly communities, and the revitalization of historical districts, to optimize the assessment goals to be adaptive to specific types of practices, planning guidelines, or policy management.
Although the guidelines and policies are usually comprehensive and lack direct breakthroughs, specific objectives can still be identified through analysis, expert interviews, and satisfaction surveys of certain types of neighborhood-scale practices. For example, some studies noticed the newly emerging ‘opening up gated residential communities’ management policy in China, and combined it with a GPS-based activity survey to investigate whether the policy’s effects on urban morphology will affect neighborhood vitality (Wu et al., 2018b). Some studies on the vitality evaluation of underground space around TOD areas conducted an in-depth analysis of the Guidelines for Planning and Designing of Areas along Urban Rail Transit and discovered that the contents of underground spaces are scattered in different parts of the guidelines, with no systematic guidance in separate chapters (Dong et al., 2021), thus finding a research gap in practice. Therefore, based on a particular policy plan for special city renewal, future research can determine the indirect impact on neighborhood-scale vitality and propose strategies for optimizing practice guidelines.
Therefore, concerning the subjects, there is a need to
·Expand vitality assessment to a multi-modal one, especially in suburban communities and neighborhood spaces for particular population groups
·Extend spatial vitality assessment to a multi-dimensional one, specifically from various non-spatial perspectives, to depict specialized aspects of community organization and social interaction in depth
·Explore multi-temporal vitality particularly to precisely measure neighborhood nighttime vitality and crisis-time vitality, which may require a pre-analysis of the residents’ various special-time behavioral initiatives, and resolve the technical challenge regarding how to separate small-scale people flow
·Expand assessment of goals to implementation-adaptive assessment, which may require an in-depth survey and analysis of the specific practical guidelines and policies to determine their indirect impact on neighborhood-scale vitality, and propose strategies for optimizing practices.

4.2 How to improve the methods

4.2.1 Methods reflecting real-perception social interactions

The current neighborhood-scale vitality measurement is based primarily on the flow of people or activity per unit area (Kang, 2020; Jiang et al., 2022) (Figure 7). Such methods can only explain the density of people flow over a specific period and cannot explain behaviour interaction in small-scale spaces or the real perception of spatial vitality. As social interactions can essentially reflect urban vitality (Yue et al., 2017), there is still a need to investigate its accurate measurement at the neighborhood scale and overcome its complexity and difficulty in quantification. We believe that using machine-learning techniques and simulations to infer and analyse social interaction spatial scenarios could be the technical direction to break the bottleneck. In the street vitality evaluation, some studies have trained a conventional neural network as a visual evaluation model based on an on-site photo and vitality scoring survey to imitate the investigators’ perception of vitality (Qi et al., 2020). Regarding social interactions metrics in the future, machine-learning-based simulation and vitality identification for multiple small-scale space types in the neighborhood can be extended.

4.2.2 Data reflecting the perceptions of vulnerable groups

At present, LBS data are widely used to characterize pedestrian flow density (Figure 8), but because very few children and older adults use cell phones or online platforms, location data cannot effectively characterize this population. However, vitality enhancement initiatives are usually focused on space for such individuals, particularly in older neighborhoods and communities surrounding kindergartens and elementary schools. Therefore, future research needs to investigate the data and methods that accurately characterize the flows and social interactions among vulnerable groups, thereby expanding the range of individuals covered by existing studies.
Some studies have investigated the behaviour of vulnerable individuals by analyzing travel survey data via telephone interviews (Marquet and Miralles-Guasch, 2016) or by allowing children and older adults to wear sports monitoring and GPS devices to aid in on-site investigation (Akinci et al., 2022; Bai et al., 2023). Some studies also use older-adult-interested service facilities and the GIS Network Analysis tool to determine the attractiveness of walking for seniors (Gaglione et al., 2022). Therefore, investigating the integration of action trajectories and social preferences to scientifically reflect the flow of vulnerable group members and their social interactions is necessary.
Therefore, there is a need for research on methods to
·Measure the real-perception behavioral interactions, which may require the machine-learning simulated ‘human perception of spatial vitality’ evaluation model, and thus reason and identify massive spatial-temporal interaction scenarios.
·Measure the perceptions of vulnerable groups, which may necessitate novel methods for combining monitoring data, GPS location data, and preference surveys.

4.3 How to enhance the driving force research

Currently, studies on the driving force for vitality focus primarily on the linear impact of single factors, from a planning perspective. However, research on design and management influence, and multi-indicator synergistic impact is lacking.

4.3.1 How design influences vitality

The proposed design factors in the current literature are primarily from a visual sensory standpoint, with aspects such as layout, scale, green space, and facility design (Table 3), and the literature on the influencing factors of multi-sensory spatial design remaining relatively scarce. We suggest that future research can focus on various sensory design elements in design standards and specifications, from visual, auditory, and tactile senses, and explore, for example, the impact of microscopic color, paving, water features, greenery, and special facility designs on vitality. By examining the appropriate range of spatial design factors and proposing targeted enhancements to design standards and specifications, studies will offer direct and potent practical guidance for the implementation of vitality enhancement practices.
However, design factors are difficult to quantify due to their subjectivity, making this a difficult barrier to overcome. The impact of spatial design on neighborhood-scale vitality remains at a qualitative level. For example, Hossini et al. (2015) analysed the influence of landscape design elements on the vitality of university open space through extensive research, as well as the theory and methods of landscape design, revealing that safe and clean green lawns, continuous pavement, malls, and comfortable outdoor furniture can influence the vitality of a campus. Khalili et al. (2018) qualitatively described the parameters that contribute to the vitality of women’s public events. They studied unobtrusive behaviors in females’ public events through interviews, observations, and photographs and found that pause spaces in commercial spaces that are not fenced and that allow people to move freely at low speeds can provide suitable opportunities for women to engage in bargaining activities and increase the likelihood of social interaction.
In the future, the following directions regarding the quantitative driving force of design can be considered: 1) design factors from visual aspects, which may necessitate visual algorithms through streetscape data and machine learning. For example, Li et al. (2021) used deep learning and computer vision algorithms to extract quantitative information about street canopies from street view images and map the spatial distribution of green view rates. 2) Design factors for auditory, tactile, and gustatory sensations, which can be obtained through field monitoring and surveys. For example, Aletta et al. (2016) conducted sound experiments in public spaces, by recording and monitoring audio and human behaviour, and discovered how ambient sounds and music modulate people’s behaviors. Muleya et al. (2020) created a multi-sensory public-space-quality measurement tool through field measurements, sample questionnaires, and assignment analysis and realized the quantitative design of the six senses: visual, auditory, tactile, gustatory, olfaction, and active engagement.

4.3.2 How management influences vitality

The proposed management-level influencing factors are mainly related to the commercial dimension, for example, the retail rent, per capita consumption, and opening hours of community businesses (Table 3). Research on the factors influencing the management of safety, health, event organization, and services for vulnerable groups remains scarce. We suggest that future research can focus on the following management dimensions: 1) those regarding social security, including the number of security personnel, intensity of management, and coverage of monitoring systems. 2) Those regarding health management, among other things, including water quality, waste management, and road drainage. 3) Those regarding activity organization, including the frequency of organized activities, depth of their content, and their age-group coverage. 4) Those regarding service management for vulnerable groups including the number of mother-and-child care rooms, public reading spaces for older adults and children, the response time for meal delivery services, and the number of older adults’ beds, among other things.
Although these factors also face a bottleneck that is difficult to quantify, many studies have attempted to address it. Sharkova and Sanchez (1999) used statistical data to analyse the effects of residential stability, degree of racial integration, and incidence of crime on community vitality. Mushkani and Ono (2021) examined the effects of visitor access, opening hours, and security management on park vitality through a survey of visitor ratings of various park management measures. At present, some metropolises have applied the Management Cockpit—a centralized management information system—to schedule and manage individual data and thus provide a ‘one-stop’ decision support for administrators (Frei et al., 2016; Huang and Huang, 2020). Future research can integrate various community operation data and management-measure preference survey to investigate the impact of operation management factors on community vitality and guide management and operations in facilitating the implementation of vitality enhancement.

4.3.3 The synergistic effects of multiple indicators on vitality

At present, only one TOD regional study on neighborhood-scale vitality evaluation has considered the synergistic impact of factors, including the impact of bus line density and street bypass ratio, building height, and street centrality (Xiao et al., 2021a). In practice, it is often impossible to improve a certain index alone. How to coordinate various influencing factors to achieve the ultimate goal of vitality improvement is the difficult part during implementation. Therefore, it is necessary to explore the synergistic impact of multiple influencing factors on vitality, under practical constraints. The difficulty is mainly in the pre-judgment of the synergistic impact of indicators. We suggest that future research can focus on these synergistic effects: (1) what are the indicators of individual factors with synergistic effects on vitality? For instance, it is commonly believed that land use diversity has a positive effect on urban vitality. Nonetheless, Lv et al. (2022) discovered that the actual impact of this indicator on vitality varied across regions in the same city. This demonstrates that the effect of mixed land use on the vitality of the neighborhood scale must consider the synergistic effect of other influencing factors, which warrants further investigation. (2) What synergistic effect do the same dimensional indicators have under the total amount of constraint? For example, under the constraint of constant total space, various types of land use at the community scale synergistically influence vitality; therefore, exploring the relationship between the land use ratios of residential, commercial, transportation, cultural, and green space in various types of communities is also of high guiding significance for vitality-oriented practical operations. (3) Synergy effect of indicators across dimensions without constraints: For example, Liu et al. (2021) explored the synergistic effect of space planning and management on vitality, and they found that, in waterfront parks, when the safety management is poor, high accessibility would inhibit vitality instead. We can further explore the synergy of design, planning, policy, operation, and other dimensions, making the investigation of the vitality impact mechanism more realistic and conducive to guiding practice.
Therefore, there is a need to
·Explore impact factors in multi-sensory spatial design aspects. This may call for novel visual algorithms based on streets view data and machine learning, whereas auditory, tactile, and gustatory computations can be accomplished through field monitoring and surveys.
·Explore impact factors of management dimensions, such as safety, health, event organization, and services for vulnerable groups. It may be necessary to combine management preference surveys with digital operational data from the community.
·Examine the synergistic effects of multiple indicators on vitality. This may require strengthening the predication of the synergistic impact of indicators, focusing on the synergistic impact of one key factor with other factors, and multiple factors within and across dimensions.

5 Conclusions

The current literature focuses primarily on urban vitality evaluation instead of implementation. This study aims to fill the research gap by exploring the content and methods of vitality assessment that can make urban vitality research more compatible with policy, planning, and design practice. For the review, we chose the neighborhood scale, which has a daily intervention level for vitality enhancement. As such, the study’s results can be applied more effectively in relevant practice. Through the review of subjects, methods, and driving forces, we discovered that the gaps between current research and practice are primarily due to the diversity of research subjects, the authenticity and comprehensiveness of vitality measurement, and the multi-domain of impact factor analysis. Thus, we classified the following expandable aspects for future research: (1) Multi-modal, multi-dimensional, multi-temporal, and implementation-adaptive vitality evaluation; (2) methods reflecting high-quality social interactions and the perceptions of vulnerable groups; (3) how design and urban management impacts vitality; and (4) the synergistic effects of multiple indicators on vitality.
Although the small amount of literature in this study regarding the discussion of neighborhood-scale vitality evaluation associated with implementation makes the study limited; the suggested targeted and practical future paths may clarify how to deepen research on neighborhood-scale vitality to provide scientific guidance on vitality enhancement implementation, and will help global research to accelerate the vitality implementation process. Scholars can further use this as a starting point, along with cutting-edge computer methods, to conduct more applicable research on vitality enhancement.
[1]
Adewumi A S, Onyango V, Moyo D et al., 2018. A review of selected neighbourhood sustainability assessment frameworks using the Bellagio STAMP. International Journal of Building Pathology and Adaptation, 37(1): 108-118.

DOI

[2]
Airgood-Obrycki W, 2019. Suburban status and neighbourhood change. Urban Studies, 56(14): 2935-2952.

DOI

[3]
Akinci Z S, Marquet O, Delclòs-Alió X et al., 2022. Urban vitality and seniors’ outdoor rest time in Barcelona. Journal of Transport Geography, 98: 103241.

[4]
Aletta F, Lepore F, Kostara-Konstantinou E et al., 2016. An experimental study on the influence of soundscapes on people’s behaviour in an open public space. Applied Sciences, 6(10): 276.

DOI

[5]
Arribas-Bel D, 2014. Accidental, open and everywhere: Emerging data sources for the understanding of cities. Applied Geography, 49: 45-53.

DOI

[6]
Bai P, Schipperijn J, Rosenberg M et al., 2023. Where are preschoolers active in childcare centers? A hot-spot analysis using GIS, GPS and accelerometry data. Childrens Geographies, 21(2): 1-17.

[7]
Barker V, Giles H, Noels K et al. 2001. The English-only movement: A communication analysis of changing perceptions of language vitality. Journal of Communication, 51(1): 3-37.

DOI

[8]
Barrios Jr S, 2008. Urban sprawl and neighbourhood vitality in Toronto: A GIS and remote sensing analysis, Toronto, Canada: Ryerson University.

[9]
Beaulieu L J, Gibbs R, 2005. The Role of Education: Promoting the Economic & Social Vitality of Rural America. Mississippi State, USA: Southern Rural Development Center. http://www.srdc.msstate.edu/publications/archive/235.pdf

[10]
Brozovsky J, Gustavsen A, Gaitani N, 2021. Zero emission neighbourhoods and positive energy districts: A state-of-the-art review. Sustainable Cities and Society, 72: 103013.

[11]
Cerin E, Nathan A, Van Cauwenberg J et al., 2017. The neighbourhood physical environment and active travel in older adults: A systematic review and meta-analysis. International Journal of Behavioral Nutrition and Physical Activity, 14(1): 1-23.

DOI

[12]
Chhetri P, Stimson R J, Western J, 2006. Modelling the factors of neighbourhood attractiveness reflected in residential location decision choices. Studies in Regional Science, 36(2): 393-417.

DOI

[13]
Chion M, 2009. Producing urban vitality: The case of dance in San Francisco. Urban Geography, 30(4): 416-439.

DOI

[14]
Dong Y H, Peng F L, Guo T F, 2021. Quantitative assessment method on urban vitality of metro-led underground space based on multi-source data: A case study of Shanghai Inner Ring area. Tunnelling and Underground Space Technology, 116: 104108.

[15]
Frei M, Von Bergen P, Boernert E et al., 2016. Management cockpits:Concept, benefits and challenges. Proceedings of IMCIC-ICSIT, Orlando, USA: International Institute of Informatics and Cybernetics, 139-144.

[16]
Gaglione F, Gargiulo C, Zucaro F, 2022. Where can the elderly walk? A spatial multi-criteria method to increase urban pedestrian accessibility. Cities, 127: 103724.

[17]
Gómez-Varo I, Delclòs-Alió X, Miralles-Guasch C, 2022. Jane Jacobs reloaded: A contemporary operationalization of urban vitality in a district in Barcelona. Cities, 123: 103565.

[18]
Grazieschi G, Asdrubali F, Guattari C, 2020. Neighbourhood sustainability: State of the art, critical review and space-temporal analysis. Sustainable Cities and Society, 63: 102477.

[19]
Guo X, Chen H, Yang X, 2021. An evaluation of street dynamic vitality and its influential factors based on multi-source big data. ISPRS International Journal of Geo-Information, 10(3): 143.

DOI

[20]
He Q, He W, Song Y et al., 2018. The impact of urban growth patterns on urban vitality in newly built-up areas based on an association rules analysis using geographical ‘big data’. Land Use Policy, 78: 726-738.

DOI

[21]
Hecht B, Stephens M, 2014. A tale of cities:Urban biases in volunteered geographic information. Proceedings of the international AAAI conference on web and social media, Palo Alto, California USA: Association for the Advancement of Artificial Intelligence Press, 197-205.

[22]
Hollenstein L, Purves R, 2010. Exploring place through user-generated content: Using Flicker tags to describe city cores. Journal of Spatial Information Science, (1): 21-48.

[23]
Hossini S B, Azemati S, Elyasi N et al., 2015. The effect of the vitality level of university campuses on increasing social interactions and makin. Procedia-Social and Behavioral Sciences, 170: 225-233.

DOI

[24]
Huang D, He H, Liu T, 2021. City size and employment dynamics in China: Evidence from recruitment website data. Journal of Geographical Sciences, 31(12): 1737-1756.

DOI

[25]
Huang Q, Huang Y, 2020. The Significance of Urban Cockpit for Urban Brain Construction. The 11th International Conference on E-business, New York, USA: Association for Computing Machinery, 70-73.

[26]
Jacobs A B, 1993. Great Streets Cambridge. Cambridge, MA, USA: MIT Press.

[27]
Jiang Y, Han Y, Liu M et al., 2022. Street vitality and built environment features: A data-informed approach from fourteen Chinese cities. Sustainable Cities and Society, 79: 103724.

[28]
Jin X, Long Y, Sun W et al., 2017. Evaluating cities’ vitality and identifying ghost cities in China with emerging geographical data. Cities, 63: 98-109.

DOI

[29]
Kang C D. 2020. Effects of the human and built environment on neighborhood vitality: Evidence from Seoul, Korea, using mobile phone data. Journal of Urban Planning and Development, 146(4): 05020024.

[30]
Khalili A, Fallah S N, 2018. Role of social indicators on vitality parameter to enhance the quality of women’s communal life within an urban public space (case: Isfahan’s traditional bazaar, Iran). Frontiers of Architectural Research, 7(3): 440-454.

DOI

[31]
Kim Y, Cubbin C, Oh S, 2019. A systematic review of neighbourhood economic context on child obesity and obesity-related behaviours. Obesity reviews, 20(3): 420-431.

DOI PMID

[32]
Kim Y L, 2020. Data-driven approach to characterize urban vitality: How spatiotemporal context dynamically defines Seoul’s nighttime. International Journal of Geographical Information Science, 34(6): 1235-1256.

DOI

[33]
Koliou M, Van de Lindt J W, McAllister T P et al., 2020. State of the research in community resilience: Progress and challenges. Sustainable and Resilient Infrastructure, 5(3): 131-151.

DOI

[34]
Lambert A, Vlaar J, Herrington S et al., 2019. What is the relationship between the neighbourhood built environment and time spent in outdoor play? A systematic review. International Journal of Environmental Research and Public Health, 16(20): 3840.

DOI

[35]
Lang W, Deng J, Li X, 2020. Identification of “growth” and “shrinkage” pattern and planning strategies for shrinking cities based on a spatial perspective of the Pearl River Delta region. Journal of Urban Planning and Development, 146(4): 05020020.

[36]
Lavrusheva O, 2020. The concept of vitality. Review of the vitality-related research domain. New Ideas in Psychology, 56: 100752.

[37]
Li M, Liu J, Lin Y et al., 2021. Revitalizing historic districts: Identifying built environment predictors for street vibrancy based on urban sensor data. Cities, 117: 103305.

[38]
Li X, 2021. Examining the spatial distribution and temporal change of the green view index in New York City using Google Street View images and deep learning. Environment and Planning B: Urban Analytics and City Science, 48(7): 2039-2054.

[39]
Li X, Li Y, Jia T et al., 2022. The six dimensions of built environment on urban vitality: Fusion evidence from multi-source data. Cities, 121: 103482.

[40]
Liu S, Ge J, Bai M et al., 2022. Toward classification-based sustainable revitalization: Assessing the vitality of traditional villages. Land Use Policy, 116: 106060.

[41]
Liu S, Lai S Q, Liu C et al., 2021. What influenced the vitality of the waterfront open space? A case study of Huangpu River in Shanghai, China. Cities, 114: 103197.

[42]
Long Y, Huang C, 2019. Does block size matter? The impact of urban design on economic vitality for Chinese cities. Environment and Planning B: Urban Analytics and City Science, 46(3): 406-422.

[43]
Lv G, Zheng S, Hu W. 2022. Exploring the relationship between the built environment and block vitality based on multi-source big data: An analysis in Shenzhen, China. Geomatics, Natural Hazards and Risk, 13(1): 1593-1613.

DOI

[44]
Lynch K, 1984. Good City Form. Cambridge, Massachusettes, USA: MIT Press.

[45]
Markantoni M, Woolvin M, 2015. The role of rural communities in the transition to a low-carbon Scotland: A review. Local Environment, 20(2): 202-219.

DOI

[46]
Marquet O, Miralles-Guasch C, 2016. Introducing urban vitality as a determinant of children’s healthy mobility habits: A focus on activity engagement and physical activity. Childrens Geographies, 14(6): 656-669.

[47]
Merriam-Webster. https://www.merriam-webster.com/dictionary/vitality2022-07-03.

[48]
Moher D, Liberati A, Tetzlaff J et al., 2009. Preferred reporting items for systematic reviews and meta-analyses: the PRISMA statement. Annals of Internal Medicine, 151(4): 264-269.

DOI PMID

[49]
Montgomery J, 1998. Making a city: Urbanity, vitality and urban design. Journal of Urban Design, 3(1): 93-116.

DOI

[50]
Mu B, Liu C, Mu T et al., 2021. Spatiotemporal fluctuations in urban park spatial vitality determined by on-site observation and behavior mapping: A case study of three parks in Zhengzhou City, China. Urban Forestry & Urban Greening, 64: 127246.

[51]
Muleya N, Campbell M, 2020. A multisensory approach to measure public space quality in the city of Bulawayo, Zimbabwe. Town and Regional Planning, 76: 56-71.

DOI

[52]
Mushkani R A, Ono H, 2021. The role of land use and vitality in fostering gender equality in urban public parks: The case of Kabul city, Afghanistan. Habitat International, 118: 102462.

[53]
Newman L L, Burnett K, 2013. Street food and vibrant urban spaces: Lessons from Portland, Oregon. Local Environment, 18(2): 233-248.

DOI

[54]
Niu Y, Mi X, Wang Z, 2021. Vitality evaluation of the waterfront space in the ancient city of Suzhou. Frontiers of Architectural Research, 10(4): 729-740.

DOI

[55]
Paköz M Z, Işık M, 2022. Rethinking urban density, vitality and healthy environment in the post-pandemic city: The case of Istanbul. Cities, 124: 103598.

[56]
Pan H, Yang C, Quan L et al., 2021. A new insight into understanding urban vitality: A case study in the Chengdu-Chongqing area twin-city economic circle, China. Sustainability, 13(18): 10068.

DOI

[57]
Qi Y, Chodron Drolma S, Zhang X et al., 2020. An investigation of the visual features of urban street vitality using a convolutional neural network. Geo-spatial Information Science, 23(4): 341-351.

DOI

[58]
Ryan R M, Frederick C, 1997. On energy, personality, and health: Subjective vitality as a dynamic reflection of well-being. Journal of Personality, 65(3): 529-565.

DOI PMID

[59]
Salvo G, Lashewicz B M, Doyle-Baker P K et al., 2018. Neighbourhood built environment influences on physical activity among adults: A systematized review of qualitative evidence. International Journal of Environmental Research and Public Health, 15(5): 897.

DOI

[60]
Sellström E, Bremberg S, 2006. The significance of neighbourhood context to child and adolescent health and well-being: A systematic review of multilevel studies. Scandinavian Journal of Public Health, 34(5): 544-554.

DOI PMID

[61]
Serin B, Kenny T, White J et al., 2018. Design Value at Neighbourhood Scale. Glasgow, UK: UK Collaborative Centre Forhousing Evidence.

[62]
Sharifi A, 2016. A critical review of selected tools for assessing community resilience. Ecological Indicators, 69: 629-647.

DOI

[63]
Sharifi A, Murayama A, 2013. A critical review of seven selected neighborhood sustainability assessment tools. Environmental Impact Assessment Review, 38: 73-87.

DOI

[64]
Sharkova I V, Sanchez T W, 1999. An analysis of neighborhood vitality: The role of local civic organizations. Portland, USA: Center for Urban Studies Publications and Reports.

[65]
Song X, Wen M, Shen Y et al., 2020. Urban vacant land in growing urbanization: An international review. Journal of Geographical Sciences, 30(4): 669-687.

DOI

[66]
Stern D N, 2010. Forms of vitality:Exploring Dynamic Experience in Psychology, the Arts, Psychotherapy, and Development. Oxford, UK: Oxford University Press.

[67]
Tu G, 2020. Analysis and decision-making of regional economic vitality and its influencing factors. Science and Technology, 2(14): 50-73.

DOI

[68]
Tu W, Zhu T, Xia J et al., 2020. Portraying the spatial dynamics of urban vibrancy using multisource urban big data. Computers, Environment Urban Systems, 80: 101428.

[69]
Van Leuven A J, 2022. The impact of main street revitalization on the economic vitality of small-town business districts. Economic Development Quarterly, 36(3): 193-207.

DOI

[70]
Wan N, Lin G, 2013. Life-space characterization from cellular telephone collected GPS data. Computers, Environment and Urban Systems, 39: 63-70.

DOI

[71]
Wang F, Zhao M, Meng Q, 2020. Analysis of the vitality measurement and correlation factors of urban waterfront space. IOP Conference Series:Earth and Environmental Science, Online: IOP Publishing, 012013.

[72]
Wang H, Dai Z, 2021. Research on the influencing factors of urban economic vitality in the Yangtze River Economic Zone based on factor analysis. Open Journal of Social Sciences, 9(7): 516-528.

[73]
Wang L, Zheng W, He S et al., 2022. Assessing urban vitality and its determinants in high-speed rail station areas in the Yangtze River Delta, China. Journal of Transport and Land Use, 15(1): 333-354.

DOI

[74]
Wang M, Vermeulen F, 2021. Life between buildings from a street view image: What do big data analytics reveal about neighbourhood organisational vitality? Urban Studies, 58(15): 3118-3139.

DOI

[75]
Warnke J, 2005. Mobility and migration: The challenge to community vitality in the Eastern Townships of Quebec. Journal of Eastern Townships Studies, 26: 65-79.

[76]
Wikipedia. https://en.wikipedia.org/wiki/Neighbourhood2022-06-25.

[77]
Wu C, Ye X, Ren F et al., 2018a. Check-in behaviour and spatio-temporal vibrancy: An exploratory analysis in Shenzhen, China. Cities, 77: 104-116.

DOI

[78]
Wu C, Ye Y, Gao F et al., 2023. Using street view images to examine the association between human perceptions of locale and urban vitality in Shenzhen, China. Sustainable Cities and Society, 88: 104291.

[79]
Wu C, Zhao M, Ye Y, 2022a. Measuring urban nighttime vitality and its relationship with urban spatial structure: A data-driven approach. Environment and Planning B: Urban Analytics and City Science, 50(1): 130-145.

[80]
Wu J, Ta N, Song Y et al., 2018b. Urban form breeds neighborhood vibrancy: A case study using a GPS-based activity survey in suburban Beijing. Cities, 74: 100-108.

DOI

[81]
Wu W, Ma Z, Guo J et al., 2022b. Evaluating the effects of built environment on street vitality at the city level: An empirical research based on spatial panel Durbin model. International Journal of Environmental Research and Public Health, 19(3): 1664.

DOI

[82]
Wu W, Niu X, Li M, 2021. Influence of built environment on street vitality: A case study of West Nanjing Road in Shanghai based on mobile location data. Sustainability, 13(4): 1840.

DOI

[83]
Xiao L, Lo S, Liu J et al., 2021a. Nonlinear and synergistic effects of TOD on urban vibrancy: Applying local explanations for gradient boosting decision tree. Sustainable Cities and Society, 72: 103063.

[84]
Xiao L, Lo S, Zhou J et al., 2021b. Predicting vibrancy of metro station areas considering spatial relationships through graph convolutional neural networks: The case of Shenzhen, China. Environment and Planning B: Urban Analytics and City Science, 48(8): 2363-2384.

[85]
Xu Y, Chen X, 2021. Quantitative analysis of spatial vitality and spatial characteristics of urban underground space (UUS) in metro area. Tunnelling and Underground Space Technology, 111: 103875.

[86]
Yang Y, Ma Y, Jiao H, 2021. Exploring the correlation between block vitality and block environment based on multisource big data: Taking Wuhan City as an example. Land, 10(9): 984.

DOI

[87]
Yue Y, Zhuang Y, Yeh A G et al., 2017. Measurements of POI-based mixed use and their relationships with neighbourhood vibrancy. International Journal of Geographical Information Science, 31(4): 658-675.

DOI

[88]
Zacharias J, 2020. The contribution of a tramway to pedestrian vitality. TeMA-Journal of Land Use, Mobility and Environment, 13(3): 445-457.

[89]
Zhang Y F, Zhong W J, Wang D et al., 2021. Understanding the spatiotemporal patterns of nighttime urban vibrancy in central Shanghai inferred from mobile phone data. Regional Sustainability, 2(4): 297-307.

DOI

[90]
Zhu J, Lu H, Zheng T et al., 2020. Vitality of urban parks and its influencing factors from the perspective of recreational service supply, demand, and spatial links. International Journal of Environmental Research and Public Health, 17(5): 1615.

DOI

[91]
Zumelzu A, Barrientos-Trinanes M, 2019. Analysis of the effects of urban form on neighborhood vitality: Five cases in Valdivia, southern Chile. Journal of Housing and the Built Environment, 34(3): 897-925.

DOI

Outlines

/