
Journal of Geographical Sciences >
The effects of Taobao villages’ spatiotemporal agglomeration on urbanization: A case study of Quanzhou, Fujian
|
Lin Juan (1988-), PhD and Associate Professor, specialized in urban geography and urban economy. E-mail: fqlinjuan@foxmail.com |
Received date: 2022-04-25
Accepted date: 2022-12-30
Online published: 2023-07-24
Supported by
National Natural Science Foundation of China(41901146)
National Natural Science Foundation of China(42171207)
National Natural Science Foundation of China(42271254)
The agglomeration of the rural e-commerce industry represented by Taobao villages has reshaped the existing urban and rural spatial organization and proposed a new urbanization model. This study identified the spatiotemporal characteristics of Taobao villages in Quanzhou city and built panel regression models to examine the impact of these villages on urbanization level, which is measured via nighttime light (NTL). The results show that (1) while the number of Taobao villages in Quanzhou city has increased rapidly, it has also experienced sporadic growth and monocentric agglomeration, finally forming a polycentric agglomeration pattern; (2) Taobao villages display a significant near-city tendency, and the urbanization level of towns with Taobao villages is higher than that of towns without Taobao villages; (3) the panel regression model highlights that Taobao villages have a significant positive impact on urbanization level. Taobao villages near the city exhibit a greater effect; meanwhile, those that are far away from the city cannot improve their urbanization level unless they reach a considerable degree of agglomeration. Rural e-commerce will become an important direction for the transformation of urban fringe areas, which provides a certain reference for the development of new urbanization in China.
Key words: rural e-commerce; Taobao village; new urbanization; nighttime light; Quanzhou city
LIN Juan , LIN Mingshui , YOU Xiaojun , WU Shiyan . The effects of Taobao villages’ spatiotemporal agglomeration on urbanization: A case study of Quanzhou, Fujian[J]. Journal of Geographical Sciences, 2023 , 33(7) : 1442 -1460 . DOI: 10.1007/s11442-023-2137-3
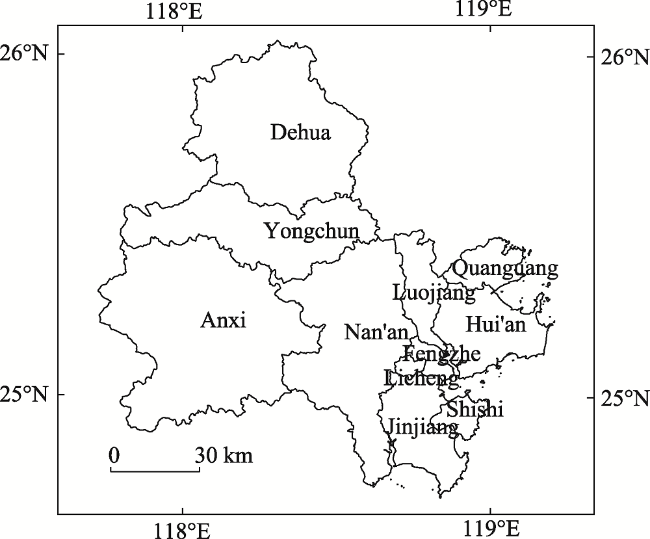
Figure 1 Location of Quanzhou city |
Table 1 Extraction urban built-up area through NTL data |
| Year | Urban built-up area | Extraction area | Rate of deviation (%) |
|---|---|---|---|
| 2014 | 197.6 | 197 | -0.30 |
| 2015 | 206.5 | 198 | -4.12 |
| 2016 | 214 | 205 | -4.21 |
| 2017 | 220 | 212 | -3.64 |
| 2018 | 226 | 228 | 0.88 |
| 2019 | 230 | 222 | -3.48 |
| 2020 | 235 | 245 | 4.26 |
Note: Data of urban built-up area come from annual statistical bulletin of Quanzhou |
Table 2 Indicator selection |
| Variable | Indicator | Data source | |
|---|---|---|---|
| Urbanization | Urb | Mean value of NTL | SNPP-VIIRS NTL |
| Rural e-commerce | TVs | Number of Taobao villages | Aliresearch 2014-2020 |
| TTs | Number of Taobao towns | ||
| Industrial base | Sec | Number of industrial enterprises above the scale | Quanzhou Statistical Yearbook 2015-2021 |
| Ter | Number of accommodation and catering enterprises | ||
| Social services | Sto | Number of stores | |
| Fin | Number of financial institutions | ||
| Control variables | Pop | Population | Quanzhou Statistical Yearbook 2015-2021 |
| Ass | Assets |
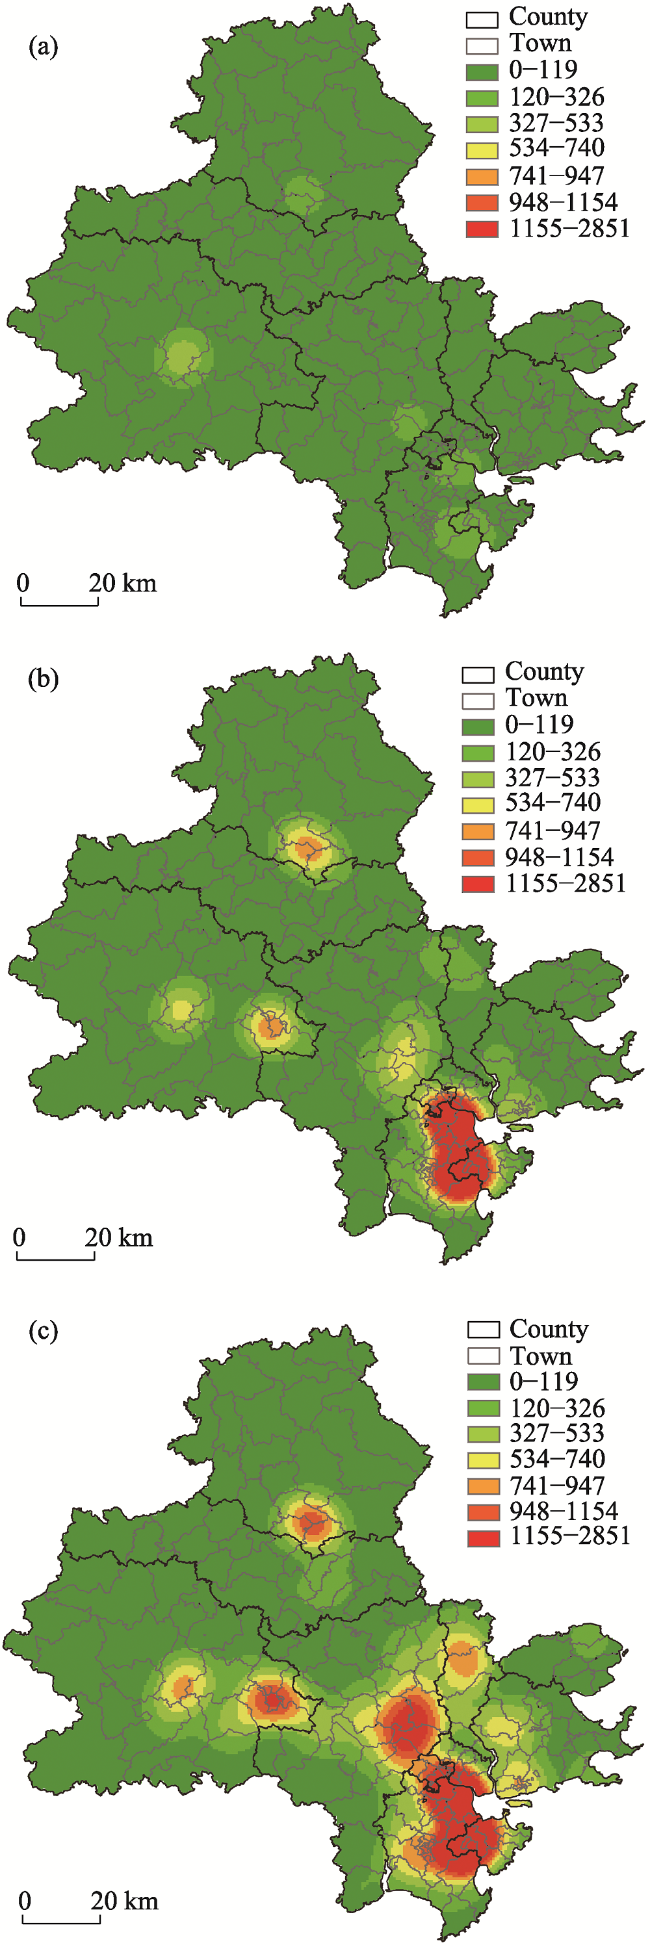
Figure 2 Kernel density estimation of Taobao villages in Quanzhou city in 2014 (a), 2017 (b), and 2020 (c) |
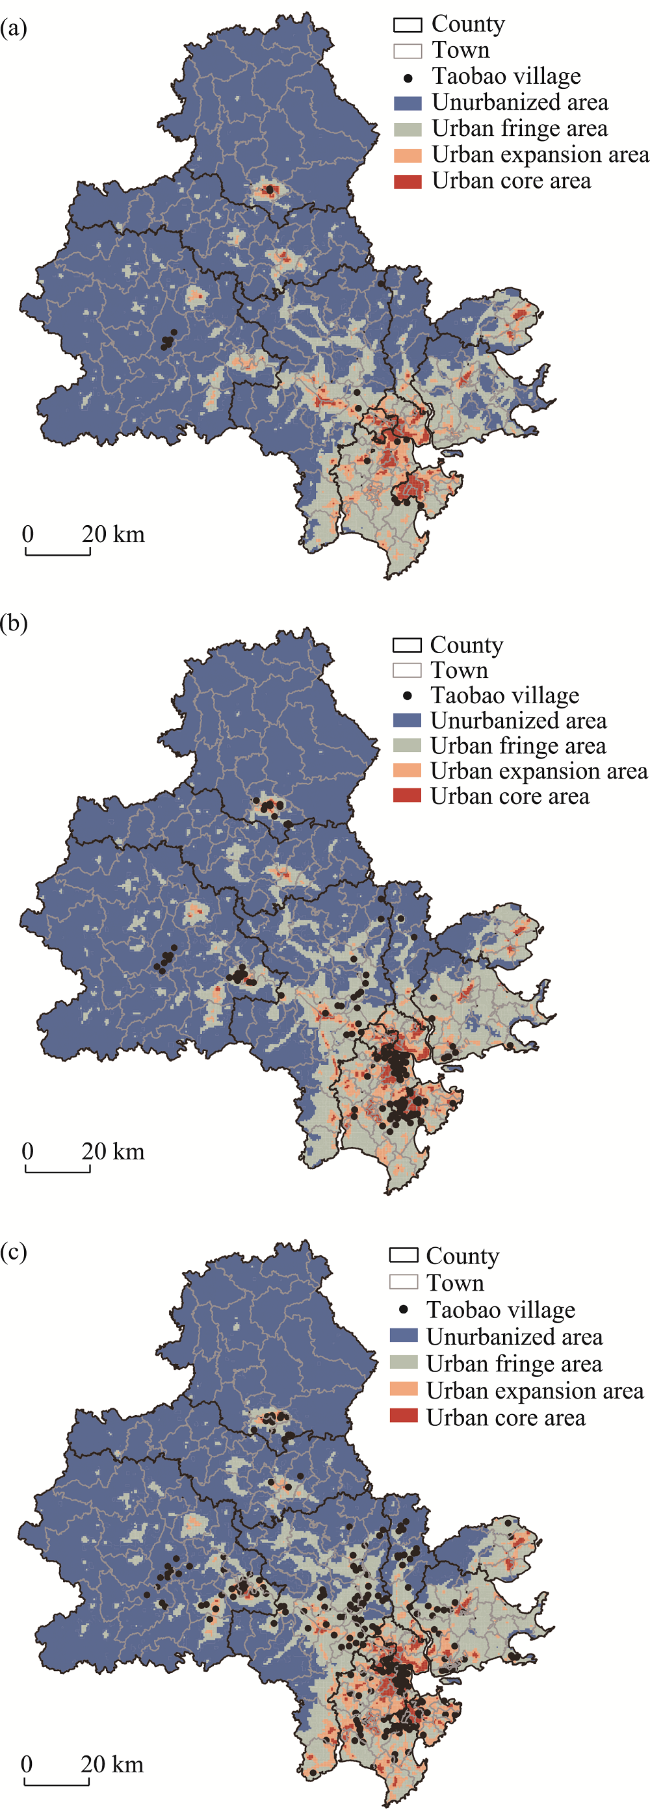
Figure 3 Distribution of Taobao villages in 2014 (a), 2017 (b), and 2020 (c) |
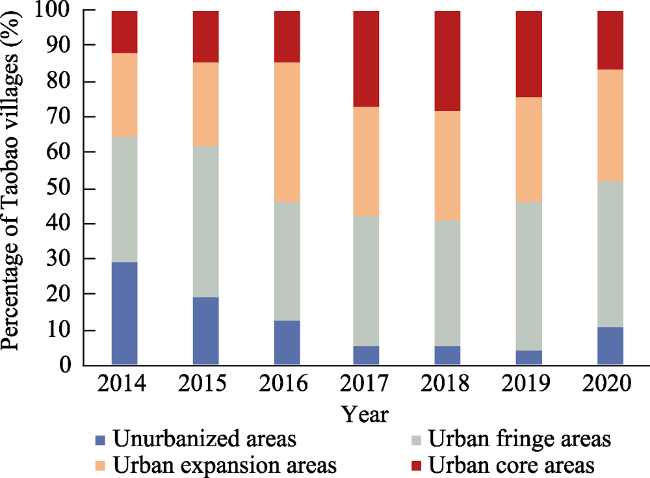
Figure 4 Distribution of Taobao villages in different urban areas |
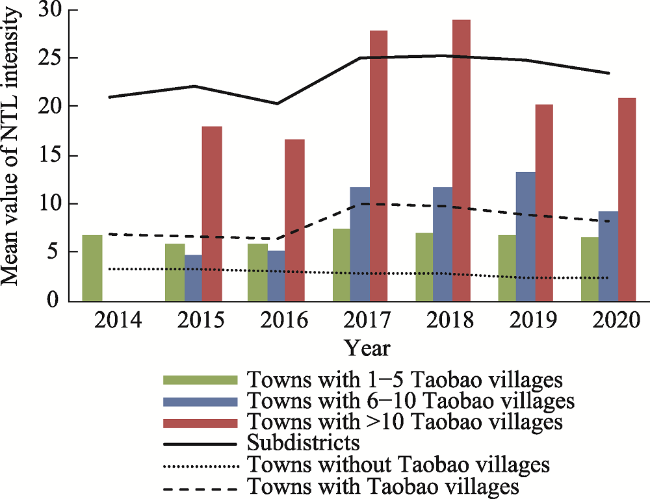
Figure 5 Relationship between NTL and Taobao villages |
Table 3 Panel fixed effects model |
| Variable | All towns | Towns near city | Towns far from city | ||||
|---|---|---|---|---|---|---|---|
| Coef. | Std. Err. | Coef. | Std. Err. | Coef. | Std. Err. | ||
| Rural e-commerce | TVs | 0.124*** | 0.04 | 0.128* | 0.08 | 0.80 | 0.05 |
| 3.26 | 1.85 | 1.11 | |||||
| TTs | 0.823*** | 0.16 | 0.965* | 0.52 | 0.769*** | 0.15 | |
| 5.05 | 1.85 | 5.24 | |||||
| Industrial base | Sec | 0.015*** | 0.01 | 0.004 | 0.16 | 0.021*** | 0.01 |
| 2.72 | 0.27 | 4.47 | |||||
| Ter | -0.001 | 0.01 | 0.001 | 0.01 | -0.013*** | 0.01 | |
| -0.65 | 0.14 | -3.48 | |||||
| Social services | Sto | 0.001*** | 0.01 | 0.014 | 0.01 | 0.008*** | 0.01 |
| 3.69 | 0.63 | 5.67 | |||||
| Fia | 0.036*** | 0.02 | 0.015 | 0.04 | 0.457*** | 0.14 | |
| 2.32 | 0.37 | 3.29 | |||||
| Control variables | Pop | 0.018** | 0.02 | 0.037* | 0.02 | 0.008 | 0.01 |
| 2.29 | 1.73 | 1.08 | |||||
| Ass | -0.001 | 0.01 | 0.001 | 0.01 | -0.001 | 0.01 | |
| -0.74 | 0.38 | -1.38 | |||||
| _cons | 3.896*** | 0.41 | 8.011*** | 1.24 | 2.376*** | 0.34 | |
| 9.60 | 6.45 | 6.95 | |||||
| Samples | 1029 | 301 | 728 | ||||
| F | 191.95*** | 173.16*** | 130.39*** | ||||
| R2 | 0.18 | 0.13 | 0.31 | ||||
Note: *, ** and *** respectively mean significance at the level of 5%, 1% and 0.1%. |
| [1] |
|
| [2] |
AliResearch (2014). China Taobao villages research report. http://www.aliresearch.com/cn/presentation
|
| [3] |
|
| [4] |
|
| [5] |
|
| [6] |
|
| [7] |
|
| [8] |
|
| [9] |
|
| [10] |
|
| [11] |
|
| [12] |
|
| [13] |
|
| [14] |
|
| [15] |
|
| [16] |
|
| [17] |
|
| [18] |
|
| [19] |
|
| [20] |
|
| [21] |
|
| [22] |
|
| [23] |
|
| [24] |
|
| [25] |
|
| [26] |
|
| [27] |
|
| [28] |
|
| [29] |
|
| [30] |
|
| [31] |
|
| [32] |
|
| [33] |
|
| [34] |
|
| [35] |
|
| [36] |
|
| [37] |
|
| [38] |
|
| [39] |
|
| [40] |
|
| [41] |
|
| [42] |
|
| [43] |
|
| [44] |
|
| [45] |
|
| [46] |
|
| [47] |
|
| [48] |
|
| [49] |
|
| [50] |
|
| [51] |
|
| [52] |
|
| [53] |
|
| [54] |
|
| [55] |
|
| [56] |
|
| [57] |
|
| [58] |
|
| [59] |
|
| [60] |
|
| [61] |
|
| [62] |
|
| [63] |
|
| [64] |
|
| [65] |
|
| [66] |
|
| [67] |
|
/
| 〈 |
|
〉 |