Research Articles

Urban expansion and intra-urban land evolution as well as their natural environmental constraints in arid/semiarid regions of China from 2000-2018

  • PAN Tao , 1, 2 ,
  • KUANG Wenhui 2 ,
  • SHAO Hua , 3, * ,
  • ZHANG Chi 3, 4 ,
  • WANG Xiaoyu 1 ,
  • WANG Xinqing 1
Expand
  • 1. School of Geography and Tourism, Qufu Normal University, Rizhao 276826, Shandong, China
  • 2. Key Laboratory of Land Surface Pattern and Simulation, Institute of Geographic Sciences and Natural Resources Research, CAS, Beijing 100101, China
  • 3. State Key Laboratory of Desert and Oasis Ecology, Xinjiang Institute of Ecology and Geography, CAS, Urumqi 830011, China
  • 4. Shandong Provincial Key Laboratory of Water and Soil Conservation and Environmental Protection, College of Resources and Environment, Linyi University, Linyi 276000, Shandong, China
*Shao Hua, Professor, specialized in urban geography and microbiology. E-mail:

Pan Tao (1987-), Associate Professor, specialized in urban land use. E-mail:

Received date: 2022-05-28

  Accepted date: 2023-03-24

  Online published: 2023-07-24

Supported by

Natural Science Foundation Youth Program of Shandong Province(ZR2021QD134)

Humanity and Social Science Youth Foundation of the Ministry of Education of China(21YJCZH111)

National Natural Science Foundation of China(31770515)

Abstract

Rapid urbanization has occurred in arid/semiarid China, threatening the sustainability of fragile dryland ecosystems; however, our knowledge of natural environmental constraints on multiscale urban lands in this region is still lacking. To solve this issue, this study retrieved 15-m multiscale urban lands. Results indicated that urban area increased by 68% during 2000-2018, and one-third of the increase was contributed by only three large cities. The coverage of impervious surface area (ISA) and vegetated area (VA) increased by 16.6% and 1.38%, respectively. Such land-cover change may be helpful in suppressing wind erosion and sand storms. We also found that the newly urban lands had relatively lower ISA and higher VA than the old urban lands, indicating an improved human settlement environment. Strong environmental constraints on urban expansion were identified, with cities in oasis urban environments (OUEs) that had water supply expanding 150% faster than cities in desert urban environments (DUEs). Urban development was also constrained by terrain, with 73% of the ISA expansion occurring in relatively flat areas. Overall, the aggregated pattern of urbanization and the increase in ISA and VA in the newly urbanized lands have improved water-use efficiency and ecological services and benefited desert ecosystem protection in arid/semiarid China.

Cite this article

PAN Tao , KUANG Wenhui , SHAO Hua , ZHANG Chi , WANG Xiaoyu , WANG Xinqing . Urban expansion and intra-urban land evolution as well as their natural environmental constraints in arid/semiarid regions of China from 2000-2018[J]. Journal of Geographical Sciences, 2023 , 33(7) : 1419 -1441 . DOI: 10.1007/s11442-023-2136-4

1 Introduction

Urban expansion and intraurban land structural evolution are vital issues in the research field of global land use/cover (Bren d’Amour et al., 2017) and climate change (Seto, 2009). Urban area expansion and structural change usually have profound impacts on ecosystem services (Breuste et al., 2013) and human well-being (Li et al., 2013; Fang 2015). Currently, acute urbanization is taking place throughout the world and has already become one of the principal global land use/cover changes since the beginning of the 21st century (Pielke, 2005; Deng et al., 2009). Divergent urbanization attracted over half of the global population to live in urban regions by 2008, and this proportion will reach 66% by 2050 (Grimm et al., 2008). In particular, most demographic transitions from rural settlements to urban areas occurred in developing nations, such as China. Under the backdrop of rapid economic development and large-scale population migration(Li et al., 2014; Tang et al., 2018; Fang, 2023), the urbanization rate in China was 57% in 2016 and projected to increase to 70% (2035) and nearly 80% (2050) (Chen et al., 2013; Bai et al., 2014), inspiring many studies on the space-time evolutionary features of China’s urban land expansion (Chen, 2007; Deng et al., 2015a; Kuang et al., 2017). However, most of the studies focused on mega-cities or metropolitan regions in southern and eastern China, where acute economic development and warm-wet climate have attracted the largest population of the nation (Long et al., 2018); however, urbanization in the dryland of northwestern China has received little attention despite its strong interactions with natural environments and ecosystems.
Arid/semiarid China has experienced rapid urbanization since 2000. Populations have increased dramatically in large cities, such as Hohhot, Yinchuan and Urumqi, and rapid urban expansion threatens the fragile dryland ecosystems in this region (Zhang et al., 2015). Compared to humid/semi-humid areas where urbanization patterns are mainly influenced by socioeconomic factors (Newman et al., 2014), land development in arid/semiarid China may be more easily constrained by environmental resources, esp. water availability. The economic connections among different cities in arid regions are relatively weak due to the intervening desert background, and the attraction effect of cities on population is usually limited at the local scale. However, cities in arid/semiarid China are found in both oasis areas and desert areas (Deng et al., 2015b; Zhang et al., 2015). In oasis areas, cities usually have abundant water supplies from major rivers or due to relatively high precipitation. Historically, the oasis cities in arid China acted as regional centers of agriculture, trading and other labor-intensive services. This background contributed to their large population and fast expansion in the 21st century. In desert areas, cities are usually established in regions with abundant groundwater resources and aqueducts. Most desert cities only emerged recently around mining or energy resource industrial areas, indicating that urban expansion is driven by industrial development. Therefore, the oasis and desert areas may have different urbanization patterns. Characterizing the urban expansion pattern and intraurban land dynamics could improve our understanding of the unique mechanisms that shaped the urbanization pattern in arid/semiarid China and provide insights into the environmental consequences of urbanization on arid/semiarid ecosystems.
High-resolution remote sensing satellite images, such as Spot, Google, and QuickBird, have been extensively used in urban land classification (Jebur et al., 2014). Building shadows and high spectral heterogeneity within the same land-cover type, however, make it difficult to achieve high classification accuracy using automatic classification approaches. Moderate spatial resolution remote sensing images, such as Landsat TM/ETM+/OLI, are still widely used in large-scale urban land mapping, considering their swath width, high spectral resolution and low cost (Li et al., 2014). For the land cover classification method using Landsat images, Ridd (1995) proposed that urban land surface can be divided into three types, namely, impervious surface area, vegetation, and soil (i.e., the V-I-S model). Lu (2014) further decomposed the mixed pixels in Landsat images within humid urban regions by combining the V-I-S model and linear spectral mixture analysis (LSMA). However, in arid regions, the large amount of bare soil within/beyond cities made the separation between ISA and bare soil a challenge due to the similar spectral characteristics in these two land use types using the previous method. Zhang (2015) promoted a methodology that integrated the special index and LSMA to investigate and compare the urban land cover classification accuracy in arid regions of America (i.e., Phoenix) and China (i.e., Urumqi). This synergetic approach has been refined and applied to urban land cover detection analysis in subsequent studies, such as Li (2016) and Pan (2019).
At present, the relationship between urbanization, namely urban expansion and intra-urban land cover changes, and natural environments in arid regions usually contained two aspects. On one side, urbanization disturbs the already-stressed desert ecosystems and competes with the desert ecosystems for water and soil resources; on the other side, environmental factors such as the water supply, terrain condition and vegetation coverage constrain land development in arid/semiarid areas (Lu et al., 2018). Most of the previous studies in arid/semiarid China focused on the first process (i.e., the urbanization impacts on ecosystems), but few considered the second process (i.e., the environmental constraints on urbanization). There have been only a few studies that investigated the geographical constraints on urbanization in arid and semi-arid regions of China (Pan et al., 2017). However, these studies mainly focused on the effect of socio-economic factors on urbanization such as gross domestic product, employment and social goods, population density and government policy. Furthermore, previous investigations mostly focused on the dynamics of urban areas, while knowledge about intra-city land-cover structure, such as the coverage of impervious surface and green spaces, may help us understand the interactions between urban development and environmental sustainability. Therefore, the study of environmental constraints on multi-scale urbanization in arid/semiarid China is urgently needed.
To address the abovementioned limitations, the objectives of this study are to (1) establish an approach for hierarchical urban lands, including urban landscape patch scale and subpatch land structure scale; (2) reveal the evolved patterns of urban expansion and intraurban land-cover changes in arid/semiarid China during the period of 2000-2018; and (3) investigate the environmental constraints on urban land development and intraurban land structure in arid/semiarid regions, including the impacts of water supply (oasis urban environment vs. desert urban environment) and terrain (i.e., slope), which have been generally overlooked in previous studies. The findings provide important knowledge of urban land changes under different water supply and terrain environments in arid/semiarid China.

2 Methods

2.1 Study area

Arid/semiarid region of China (between 27°10′52″-51°09′29″N and 73°46′22″- 122°42′25″E) (Cui and Shao, 2005; Rao et al., 2006) stretches across northwestern China, reaching east to the Da Hinggan Mountains and south to the Qinghai-Tibet Plateau and the Loess Plateau (Figure 1). This region covers 453.68 km2 of dryland, accounting for 47.26% of China’s land territory. However, the area’s population only accounts for 4% of the national population. The region has a temperate arid/semiarid climate because it is located deep inside the Eurasian continent, and much of its land is in the rain shadows of high mountain ranges. The regional mean annual precipitation is usually less than 300 mm. The complex terrain covers a broad range of plateaus, plains, mountains, hills, and basins, accompanied by elevation variations ranging from -197 m to 8776 m. Most of the plains and basins are covered by desert vegetation (shrubs and dry grasslands) and dotted with oases. The Mongolian Plateau is dominated by steppe. Forests and alpine meadows are found in the mountainous areas. The soils have relatively low organic matter content and are characterized by relatively high salinity compared with the soils in other parts of China. In arid/semiarid China (Cao, 2011), administratively central cities are also regional centers of political, economic, and cultural activities, attracting large urban populations. Therefore, this study focuses on all the administrative center cities (Table 1) in the study area, using them to represent the urbanization process of arid/semiarid China.
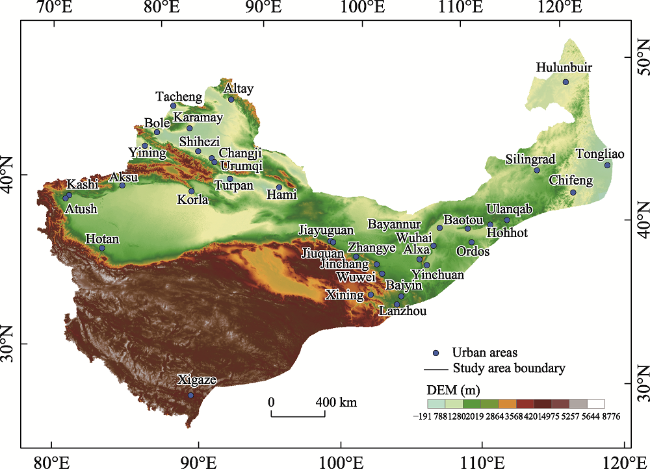
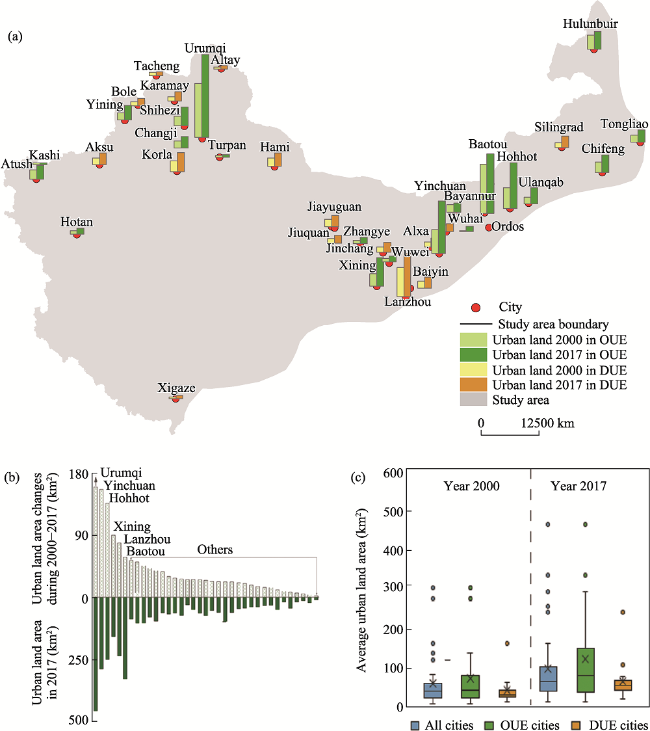
Figure 1 Geographic information of arid and semiarid regions of China
Table 1 Detailed information of the 36 cities in this study
Order Name Location Landsat number Order Name Location Landsat number
1 Urumqi 43.87°N, 87.58°E 143/029 19 Jiayuguan 39.08°N, 98.28°E 135/032
2 Baotou 40.61°N, 109.97°E 127/032 20 Baiyin 36.53°N, 104.16°E 130/035
3 Yinchuan 38.48°N, 106.21°E 129/032 21 Jinchang 38.49°N, 103.15°E 132/033
4 Hohhot 40.82°N, 111.65°E 127/032 22 Bayannur 40.76°N, 107.41°E 129/032
5 Lanzhou 36.07°N, 103.79°E 130/035 23 Karamay 45.58°N, 84.89°E 145/028
6 Xining 36.62°N, 101.77°E 132/035 24 Alxa Left 38.84°N, 105.68°E 130/033
7 Shihezi 44.33°N, 86.05°E 144/029 25 Wuhai 39.68°N, 106.81°E 129/032
8 Korla 41.75°N, 86.15°E 143/031 26 Jiuquan 39.71°N,98.51°E 135/032
9 Hulunbuir 49.20°N, 119.79°E 123/026 27 Bole 44.88°N, 82.09°E 146/029
10 Chifeng 42.27°N,118.93°E 122/031 28 Zhangye 38.95°N, 100.47°E 133/033
11 Ulanqab 40.99°N, 113.12°E 125/032 29 Wuwei 37.93°N, 102.63°E 132/034
12 Yining 43.93°N, 81.29°E 147/029 30 Hotan 37.11°N, 79.93°E 146/034
13 Kashi 39.44°N, 76.01°E 149/033 31 Erdos 39.59°N, 109.76°E 127/032
14 Hami 42.86°N, 93.53°E 138/030 32 Tacheng 46.74°N, 82.97°E 146/028
15 Tongliao 43.63°N, 122.26°E 120/030 33 Xigaze 29.26°N, 88.88°E 139/040
16 Changji 44.00°N, 87.27°E 143/029 34 Altay 47.82°N, 88.13°E 143/027
17 Aksu 41.17°N, 80.27°E 147/031 35 Turpan 42.96°N, 89.11°E 141/030
18 Silingrad 43.94°N, 116.06°E 124/029 36 Atush 39.72°N, 76.15°E 149/032

2.2 Methods

Urbanization in arid and semiarid regions of China in this study was conducted at two scales, including urban expansion and the intraurban land cover structure. At the urban boundary scale (i.e., pixel level), we used visual classification to identify the urban area from high-resolution remote-sensing images (see the detailed descriptions in Section 2.2.2). At the intraurban land cover structure scale (pixel and subpixel levels), we used the vegetation- impervious surface-soil (V-I-S) model and linear spectral mixture analysis (LSMA) to estimate the fractions of four urban land components, including the water, impervious surface area (ISA), vegetated area (VA), and soil in each pixel of Landsat ETM+/OLI images. For land-cover change detection, the fractions of different urban land types, multiple index, decision tree classification, and supervised classification were applied to generate intraurban land type maps of water, ISA, VA, and soil for 2000 and 2018. Then, urban expansion and land-cover/landscape changes from 2000-2018 were assessed. The urban evolution process and discrepancy under the backgrounds of oasis and desert urban environments were compared. We also revealed the terrain effect on urban land development.

2.2.1 Data collection and preprocessing

Free accessibility of Landsat platform provided all the required product for land use mapping. Good observations are not always available in each month due to the limited 16-day revisit cycle, cloud coverage, bad strips, and shadows in Landsat images. We filtered good-observations from June to September. All good observations were free downloaded from USGS platform (https://earthexplorer.usgs.gov/). To promote the comparability of surface reflectance in these two different sensors, all Landsat ETM+ and OLI images were pre-processed through the processes of radiometric calibration and atmospheric correction on the ENVI platform. We also filtered the temporal and spatial characteristics of these images to match the used Landsat ETM+ and OLI images in the same growing season. Then, both data were comparable. Spatial resolution of remotely sensed images was an important indicator for accurately evaluating land data, which was especially vital for complex arrangements of intra-urban land-cover landscape studies. Gram-Schmidt spectral sharpening was proved to be an effective fusion technology to integrate Landsat images multispectral data and panchromatic data to create a higher resolution product. According to this method, the native 30-m pixels were fused into 15-m data through the panchromatic and multi-spectral bands in Landsat images. Meanwhile, Google archive images in the summer of 2000 and 2018 throughout all the studied cities were also collected using the 91 bitmap software platform (http://www.91weitu.com/), which was authorized by the vendor of DigitalGlobe and Google. The downloaded Google images in this study belonged to the level sixteenth in the Google maps with 2-m spatial resolution.
In addition to remote-sensing imagery from Landsat and Google, the urban administrative boundary and the Chinese arid/semiarid region boundary were provided from National Geomatics Center of China (http://www.ngcc.cn/). Meteorological station information was provided from National Meteorological Information Center of China (http://data.cma.cn/). The 30-m resolution elevation was provided from the GDEM (Global Digital Elevation Model) and resampled to 15-m. The slope was generated according to the elevation using the ArcGIS platform.

2.2.2 Delineating urban built-up boundaries by visual interpretation of human-computer interaction

Automatic classifications of urban built-up lands in arid/semiarid China were difficult to obtain with high accuracy due to the similar spectral features of ISA and bare soil. Furthermore, the urban built-up land was always treated as the impervious surface area. This means that other land cover types, such as vegetation, water bodies, and bare soil, were ignored, leading to the vacancy of urban land spatial continuity. Therefore, urban development boundaries should first be generated to serve as a foundation for the comparison of intraurban land cover morphology among different cities. The human-computer interactive visual interpretation approach was an effective way to delineate urbanized boundaries. To obtain accurate city boundaries in this study, first, the spatial locations of all the studied cities were captured according to the urban administrative boundary. Then, based on Google imagery from 2000 and 2018 (spatial resolution: 2 m, sensor: QuickBird, vendor: DigitalGlobe & Google), the urban land boundaries of all cities in 2000 and 2018 were manually delineated according to the criteria of the China Land Use/Cover Dataset (CLUD) (Liu et al., 2005; Liu et al., 2010; Liu et al., 2014; Kuang et al., 2016). The products were also cross-checked by multiple experts to guarantee high data quality.

2.2.3 Intra-urban land cover structure classification

In arid and semiarid regions, it was difficult to obtain high-accuracy urban land cover classification results due to the mixed pixel problems between the land use types of ISA and bare soil using the single classification approach. In this study, synergetic methods, including the technological process of the fully constrained least-squares solution (FCLS) of Landsat multispectral images, multiple variables for subpixel land cover, decision tree classification, and supervised classification, were conducted to classify urban land cover types. This means that we used spectral mixture analysis to unmix the Landsat multispectral image into a fractional/subpixel image scale. Then, the combination of the decision tree classifier, professional indicators, and subpixel land component was applied to classify the subpixel images into per-pixel-based results again. At the subpixel scale, these additional professional indicators were applied to address the Landsat image mixed pixel problem in the intraurban land cover of arid and semiarid regions. Finally, supervised classification was applied to separate the very small remaining areas of mixed land types by identifying remote sensing features from Google imagery. A detailed description is provided in Sections 2.2.3(1) to 2.2.3(3).
(1) FCLS of Landsat multispectral images
Although multispectral images can be decomposed into different land cover component data using different approaches, such as linear, nonlinear or multiple endmember methods, the fully constrained least-squares solution (FCLS) has been extensively adopted in research due to its advantages of simple operation, convenience of use, and credible results (Zhang et al., 2015). Thus, this model was applied in this study to unmix 15-m resolution Landsat ETM+/OLI multispectral data into four components, namely, the land cover components of low-albedo objects, high-albedo objects, vegetation objects and bare soil objects. Descriptions of the FCLS model were provided in previous literature (Silván-Cárdenas, 2010; Heylen et al., 2011; Pu et al., 2013).
In the FCLS model, the selection of endmembers for each land component was treated as the most significant input variable and determined the land cover classification accuracy. To obtain the best endmembers, minimum noise fraction (MNF) technology (Lu et al., 2014; Luo et al., 2016) was applied to make the Landsat multispectral data into the spectral band data, in which more than 90% of spectral information was concentrated into the first three bands. The first three bands of MNF data were then applied to select endmembers within urban lands. In arid/semiarid regions, it was vital to separate ISA from soil because a large amount of soil existed in interior cities. Therefore, it was difficult to directly identify the best endmembers from MNF bands. We applied 2-m Google imagery to identify initial endmembers at locations including the land types of bare soils (soil object), park green (VA object), concentrated water bodies (low-albedo object), and building roofs (high-albedo object). After that, the corresponding locations on Landsat imagery were checked to identify their spectral signature information. Later, these spectral features were compared with those of initial endmembers to obtain the best low-albedo object, soil object, VA object, and high-albedo object endmembers. Finally, according to these four input land endmembers, the FCLS model was applied to unmix Landsat multispectral imagery generating four components and an error image. The steps could only be applied to one Landsat image due to the spectral complexity of intra-urban landscape in arid/semiarid regions. We repeated the previous steps to obtain all sub-pixel land compositions. The samples of urban land composition spatial distribution were provided in Figure 2, such as the cities of Yining, Changji, Silingrad, and Hami.
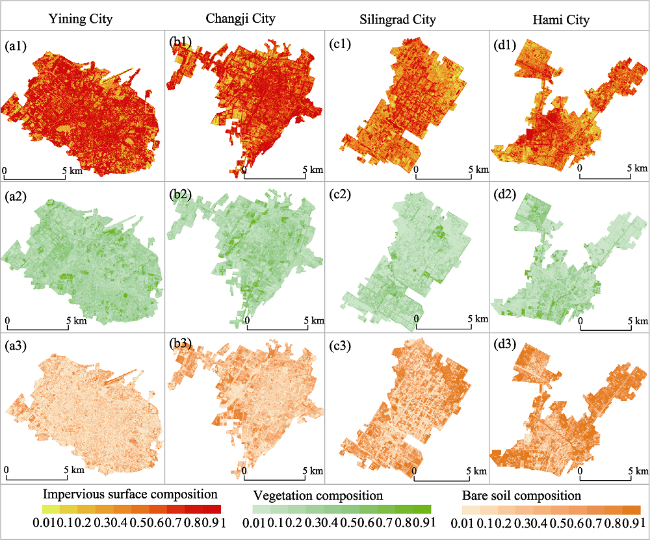
Figure 2 The sub-pixel land compositions of impervious surface area, vegetation, and soil in sampled cities of Yining, Changji, Silingrad, and Hami. Note: Cities of Yining and Changji are located in oasis environments, in contrast, cities of Silingrad and Hami are located in desert environments.
(2) Multiple variables for sub-pixel land covers
Remote-sensing spectral bands are usually applied for land use/cover classifications, while similar spectral signatures of certain land surface types, such as ISA and soil, are difficult to separate in arid/semiarid China because of the large amount of mixed mosaic areas at the Landsat pixel scale in interior cities. Thus, high-albedo compositions were mainly classified as bright ISA, although a certain amount of bare soil also existed in this component image. According to the analysis of intraurban land spectral signatures as well as their component values, LSDI (low-albedo and soil difference index, Equation 1) and GSDI (GV and soil difference index, Equation 2 (Zhang et al., 2015)) were applied to enhance the separation between ISA and soil. Similarly, low-albedo compositions mainly included the dark ISA, while the information of water bodies, shadows of buildings and tree canopies still coexisted in the low-albedo object, which were also difficult to directly separate. MNDWI (modified normalized difference water index, Equation 3, (Xu, 2006)) facilitated the extraction of water bodies from other land use/cover coverages, as the MNDWI increased the spectral signatures of shortwave infrared and green Landsat bands. Therefore, the professional indicators of LSDI, GSDI, and MNDWI were added to the intraurban land cover classification at the subpixel land scale.
$\text{LSDI=}{{f}_{Low}}-{{f}_{Soil}}$
$GDSI={{f}_{GV}}-{{f}_{Soil}}$
$\text{MNDWI}=({{\rho }_{green}}-{{\rho }_{MIR}})/({{\rho }_{green}}+{{\rho }_{MIR}})$
(3) Intra-urban land structure classification
When different subpixel land component data and auxiliary information (i.e., professional indicators) were combined to conduct land cover classification, the decision tree classifier was proven to be an available land use/cover classification approach (Sharma et al., 2013). We applied this method to obtain over 95% of the areas of land-cover types within intraurban regions, including ISA, VA, soil, and water. The spectral features (i.e., Landsat ETM+/OLI band digital number) for each land surface type were analysed based on Landsat multispectral data, component images, and index variables. After that, for the still mixed pixels, unsupervised classification was further applied to identify the mixed pixels in each land surface type. Specifically, unsupervised classification divided the mixed pixels into 50 classified categories for each Landsat image. A total of 3600 classified categories from Landsat ETM+/OLI images were obtained. Visual interpretation reclassified these recoded land types into four types using professional knowledge from 2-m Google imagery. These images were then combined into thematic intraurban land cover maps of ISA, VA, soil, and water. Then, intraurban land structural maps were generated.
In this study, we also obtained subpixel land use component data under the intraurban land cover structure, namely, the single subpixel land cover component obtained in Section 2.2.3(1) was masked by the ArcGIS platform using the land cover structure product in Section 2.2.3(3). As a result, bare soil and vegetation components were generated directly, and the ISA component was calculated through spatial superposition of low-albedo and high-albedo compositions.

2.2.4 Accuracy assessment for pixel land structure and sub-pixel land compositions

A data quality control scheme was employed to ensure accuracy. Hence, an accuracy assessment was applied to the pixel land-use structure and subpixel land composition. For pixel land use structure, a total of 14,400 sample points in 2000 and 2018 were randomly assigned to all the studied cities. The stratified random sampling approach was further applied to select sampling points in each city because the land-cover structure changed over time. The assessed accuracy indicators, including overall accuracy, confusion matrix, user’s accuracy, kappa coefficient, and producer’s accuracy, were provided for calculating accuracies. For subpixel land-cover composition, area verification was established according to a three-pixel window approach, in which the verified sample size was set as 3 pixels x 3 pixels (i.e., 45 m x 45 m). A total of 600 randomly selected samples were evenly allocated to the subpixel land compositions of ISA, VA, and soil. The samples from Landsat images were taken as actual values, and the samples from artificially digitized 2-m Google images were taken as reference values. Linear fitting and significance were used to calculate accuracies.

2.2.5 Indicators of environmental constraints and landscape patterns

(1) Oasis urban environment and desert urban environment
The oasis and desert environmental backgrounds in arid/semiarid China reflected the impacts of water supply on urban land development. The OUE (Figure 3a) was regarded as an area with abundant water supply, usually from rivers or due to relatively high annual precipitation. The DUE (Figure 3b) was regarded as an area with limited water supply that must depend on groundwater. According to our investigation, the OUE can support large agricultural areas and/or natural green spaces within which cities were developed. Most OUE cities were agriculture-oriented or service-oriented. In contrast, DUE cities are usually resource-related industrial cities (e.g., the mining industry) that emerge directly in deserts. In this study, we investigated the urban water environment in arid and semiarid regions of China. The constraints of water resources on urban development were analysed from two aspects: precipitation and surface water resources. We identified OUE cities based on the following two criteria. The first indicator was the cities’ mean annual precipitation during the study period. The second indicator was that an appropriate buffer area outside of city boundary should be covered by vegetation and water over 55% (Pan et al., 2019).
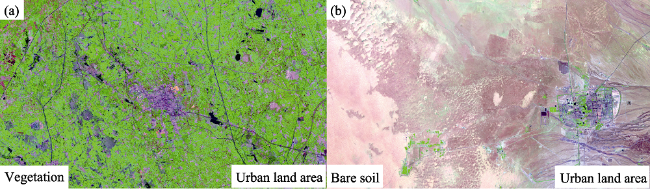
Figure 3 (a) A sample of an oasis urban environment, and the urban land is surrounded by green vegetation; (b) a sample of a desert urban environment, and the urban land is surrounded by bare soil. The background colors of (a) and (b) are true color syntheses from Landsat OLI images, with the R, G, and B layers of band 7, band 5, and band 3, respectively.
(2) The terrain effect
Because the terrain environments may influence urban expansion and intra-urban land cover structure changes, especially the terrain is fluctuating violently in arid/semi-arid China, we investigated how the average slope in an urban area affected urban land development in this region. For simplification, the slope was classified into four levels: slope ≤5° (level 1), slope$\in $(5°–10°] (level 2), slope$\in $(10°–15°] (level 3), and slope>15° (level 4), respectively. Cluster statistical analysis was used to assess the effect of slope on urban land development as well as the intra-urban land-cover structure (i.e., ISA, VA, and soil) across arid/semiarid China. Specifically, the effect of slope on the new urban land region and old urban land region, along with their corresponding intra-urban land cover structure changes in both urban regions across arid/semi-arid China, were first investigated.
(3) Landscape ecology indicators
Landscape indices were calculated to quantify the spatial composition and configuration of different urban land-cover types (Schneider et al., 2015; Pan et al., 2019). Based on a preliminary study, five landscape indices were selected for this study: patch density, landscape shape index, connectance index, largest patch index, and Shannon diversity index (Table 2). These ecological indicators were used to express the urban land cover landscape changes at land type and landscape scales.
Table 2 Intra-urban landscape ecology indicators
Abbreviation Index Expression
PD Patch Density $PD=\frac{{{n}_{i}}}{A}(10,000)(100)$
LPI Largest Patch Index $LPI=\frac{\underset{j=1}{\overset{n}{\mathop{max}}}\,({{a}_{ij}})}{A}(100)$
LSI Landscape Shape Index $LSI=\frac{0.25\sum\limits_{k=1}^{m}{e_{ik}^{*}}}{\sqrt{A}}or=\frac{0.25{{E}^{*}}}{\sqrt{A}}$
CONNECT Connectance index $connect=\left[ \frac{\sum\limits_{j\ne k}^{n}{{{c}_{ijk}}}}{\frac{{{n}_{i}}({{n}_{i}}-1)}{2}} \right](100)$
SHDI Shannon Diversity Index $SHDI=-\sum\limits_{i=1}^{m}{{{P}_{i}}In({{P}_{i}})}$

3 Results

3.1 Accuracy assessment of intra-urban land structure

The overall classification accuracy of the land-cover structure products was 90.76% and 91.82% in 2000 and 2018, with kappa coefficients of 0.84 and 0.85, respectively (Table 3). Misclassified information was mainly concentrated in the ISA and bare soil land types. The intricate artificial urban land objects and divergent surface colors led to wide-ranging spectral features in ISA, and thus, bright ISA presented spectral signatures similar to those of bare soil. This mixed pixel issue made it difficult to obtain good classification accuracy. The synergistic land cover structure classification approach, including the procedures of FCLS of Landsat multispectral images, multiple index variables, the decision tree classifier, and unsupervised classification, achieved high separation between ISA (producer’s accuracy (PA, 91%) and user accuracy (UA, 91%) in 2000; and PA (90%) and UA (93%) in 2018, respectively) and bare soil (PA (84%) and UA (82%) in 2000; and PA (87%) and UA (84%) in 2018, respectively). Furthermore, subpixel land composition verifications between the observation values and the reference values were good (Figure 4). Furthermore, vegetation composition achieved the highest R2 values of 0.91 and 0.93 in 2000 and 2018, respectively, followed by the R2 values of ISA and bare soil compositions.
Table 3 Validated indicators, including the transition matrix, overall classification accuracy, kappa statistics, reference pixels, classified pixels, number of correct pixels, producer’s accuracy, and user’s accuracy, were provided to calculate accuracies
Land-cover Ground truth pixels Reference Classified Number Producer’s User’s
ISA VA BS WB Pixels Pixels Correct Accuracy Accuracy
ISA 2734 42 207 25 3014 3008 2734 90.71% 90.89%
VA 21 2075 18 14 2173 2128 2075 95.49% 97.51%
BS 241 36 1295 6 1537 1578 1295 84.26% 82.07%
WB 18 20 17 431 476 486 431 90.55% 88.68%
Year: 2000, Overall Classification Accuracy = 90.76% (i.e., 6535/7200), Kappa Statistics = 0.84
ISA 2838 29 181 12 3145 3060 2838 90.24% 92.75%
VA 54 2033 20 3 2092 2110 2033 97.18% 96.35%
BS 229 22 1365 3 1570 1619 1365 86.94% 84.31%
WB 24 8 4 375 393 411 375 95.42% 91.24%
Year: 2018, Overall Classification Accuracy = 91.82% (i.e., 6611/7200), Kappa Statistics = 0.85

Abbreviations: WB, water body; BS, bare soil; VA, vegetated area; ISA, impervious surface area

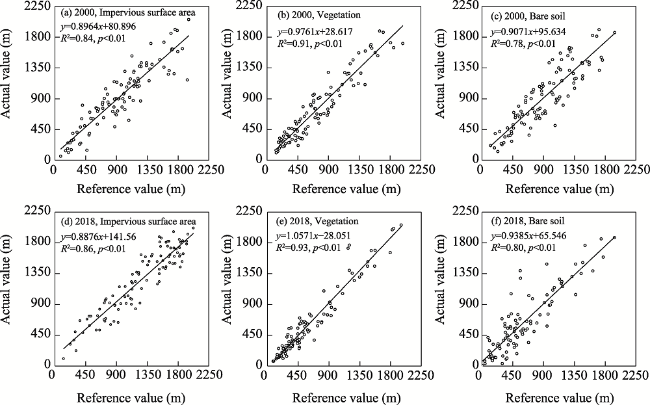
Figure 4 Sub-pixel land composition assessment of ISA, VA, and bare soil surfaces in 2000 and 2018

3.2 Urban expansion and urban land-cover/landscape changes from 2000-2018

3.2.1 Analysis of different scale urbanization process

For urban expansion in the study area, in 2018, the average urban area of all the cities in arid/semiarid China was 93.39±97.73 km2 (Figure 5c). Among these cities, Urumqi was by far the largest in terms of area (458 km2), followed by Baotou (330 km2) and Yinchuan (290 km2) (Figure 5b). During 2000-2018, the total area of all cities expanded from 2003 km2 to 3362 km2, increasing by 68% (Figures 5a and 5c). One-third of the increase was contributed by three large cities, including Urumqi, Hohhot, and Yinchuan, all of which are administrative and economic centers in arid/semiarid China (Figure 5b). The six largest cities accounted for 51% of the urban land area in 2018 and contributed to 50% of the urban expansion during 2000-2018 in the study area (Figure 5b). These facts indicated that the urbanization process in arid/semiarid China was dominated by a few large cities that played central roles in regional political and economic processes. This finding justified our approach of studying urbanization in arid/semiarid China by focusing on major cities.
Figure 5 (a) Changes in urban areas during 2000-2018 in all cities in arid/semiarid China. The height of the column indicates the area of urban land in each city. Note: OUE, oasis urban environment; DUE, desert urban environment; (b) The six largest cities account for 50% of the urban expansion during 2000-2018 and 51% of the urban areas in 2018 among the 36 major cities in arid/semiarid China; (c) The mean urban land area of all cities. The solid black lines represent the median values, the crosses represent the means; from bottom to top, the four horizontal lines are the lower edge, the lower quartile, the upper quartile, and the upper edge, respectively. The circular dots represent outliers.

3.2.2 Analysis of pixel and sub-pixel intra-urban land cover changes

For intraurban land cover changes in the study area, in 2018, the ISA, vegetated area, bare soil and water occupied 50.10%±8.91%, 15.09%±4.93%, 33.07%±11.94%, and 1.73%± 1.51% of the urban land, respectively (Figures 6 and 7). During 2000-2018, the ISA expanded from 1003.50 km2 to 2240.78 km2, and the fractional coverage of ISA in the urban areas increased by 16.55%. This indicated intensified land development in urbanized areas, where the average subpixel ISA fraction increased from 62.8%±2.8% to 69.5%±2.8% during the 18 years. The urban area also became greener. The vegetated area expanded by 251.58 km2, and its fractional coverage in urban areas increased by 1.4% during 2000-2018. In contrast, the bare soil area shrank by 131.15 km2, and its fractional coverage in the urban areas decreased by 17.27%. The water body areas in these arid/semiarid cities have been protected, and their areas remained almost unchanged during the study period. Our analysis demonstrated that the newly expanded urban land area had relatively lower fractions of ISA (65.66%) and higher vegetation coverage (66.80%) than the ISA (72.35%) and vegetation coverage (57.24%) of the old urban land area.

3.2.3 Analysis of the landscape patterns in all the studied cities and in different types of cities

While the increased vegetation coverage and reduced bare soil indicated an improved urban environment, the landscapes of all cities became more fragmented, indicating a degradation of urban habitats but also possibly an increased ecosystem service efficiency from green spaces (Figure 8). During 2000-2018, we found a 7% increase in land patch density (PD) and a 39% decline in patch connectivity (CONNECT). In particular, the fragmentation of the vegetated areas was intensive, as indicated by its 67% increase in PD, 66% decrease in largest patch index (LPI), and 40% decrease in CONNECT. Meanwhile, the expansion and merging of impervious surface patches resulted in a 75% increase in LPI for the ISA. This resulted in a 17% reduction in urban land diversity as measured by the SHDI. In addition, the urban landscapes became more complex, as indicated by the 24% increase in LSI. This implies that the interfaces between artificial (ISA) and natural habitats increased; thus, the influence of human disturbances may have increased.

3.3 Environmental constraints on urban expansion and intra-urban land structure changes

3.3.1 A comparison between the OUE cities and the DUE cities

During 2000-2018, the area of the OUE cities increased from 1395 km2 to 2366 km2, which was 150% faster than the expansion of the DUE cities (from 608.13 km2 to 996.17 km2) (Figure 5c). The intraurban land-cover dynamics were also different. On average, the OUE cities had higher ISA coverage (53.03%±8.21% vs. 43.41%±7.42%, in 2000) (Figures 6 and 7) and a faster increase in ISA coverage than the DUE cities (17.14% vs. 14.90%, during 2000-2018). The OUE cities also had higher vegetation coverage (17.10%±4.69% vs. 14.99%±6.44%) and faster increases in vegetation coverage (1.60%±4.71% vs. 0.83%± 3.40%) than the DUE cities. Furthermore, the coverage of bare soil in the OUE cities shrank by 18.11% (from 29.92%±11.23% to 11.81%±9.35%), decreasing faster than that in the DUE cities (15.02%). In summary, most of the cities in arid/semiarid China became larger, greener and greyer (higher ISA coverage), and the expansion and land/greenspace development of the DUE cities were slower than those of the OUE cities. In addition, the problem of landscape fragmentation was more severe in the DUE cities than in the OUE cities. For example, the mean PD of the DUE cities increased by 14.9%, while the mean PD of the OUE cities decreased slightly (-0.2%) during 2000-2018. The DUE cities also had fewer large greenspace patches than the OUE cities, as indicated by their smaller LPI (1.8 vs. 2.2) in 2018 (Figure 8).
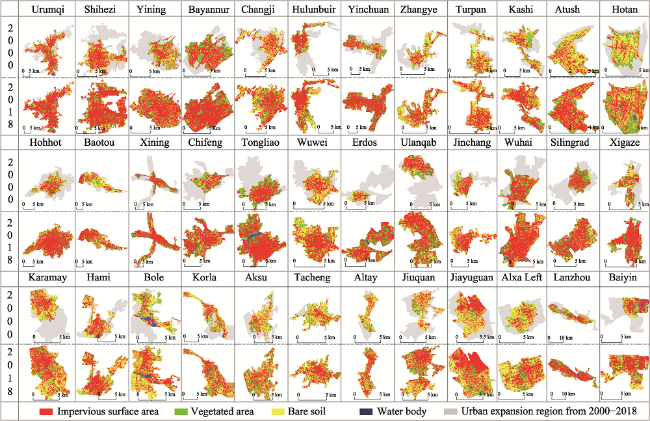
Figure 6 Urban expansion and land-cover changes across all cities in arid/semiarid China in 2000 and 2018. In this figure, to clearly compare the size of each city in the spatial pattern, we set the scale of each city to 5 kilometers. Meanwhile, the outer border size of each city is set to a square with the side length of 1.2 cm.
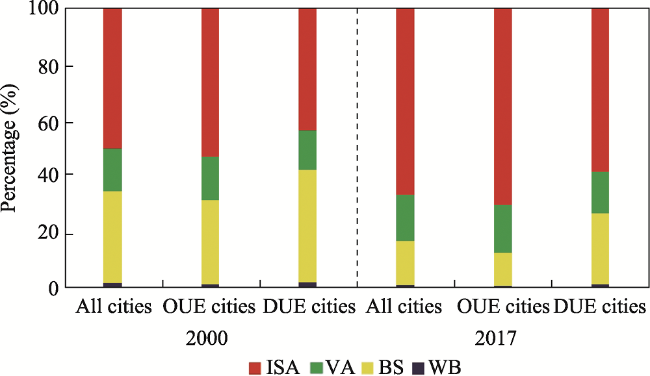
Figure 7 Fractional coverage of impervious surfaces area, vegetated area, bare soil, and water body in the study area in 2000 and 2018 (OUE: oasis urban environment, DUE: desert urban environment)
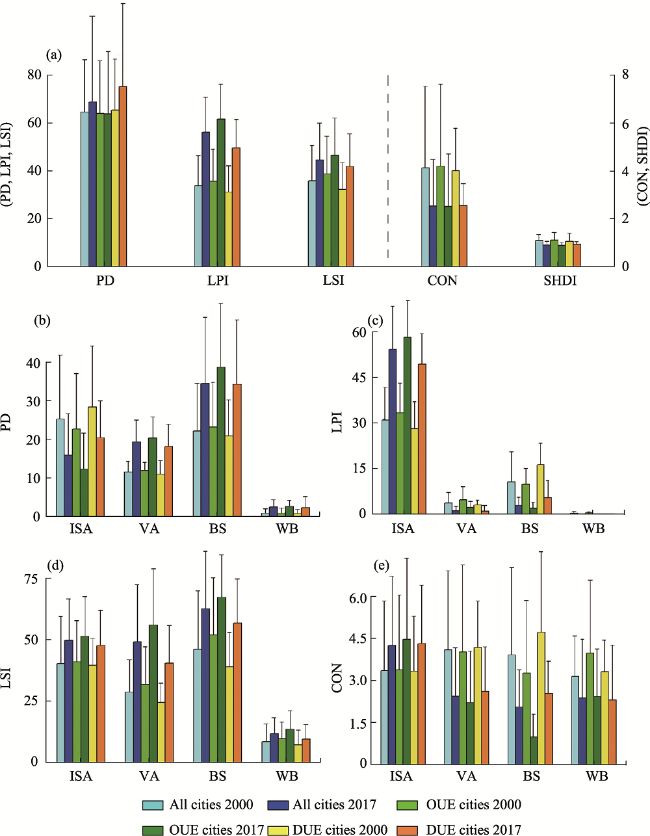
Figure 8 (a) Changes in landscape patterns in the study area during 2000-2018. (b)-(e) Comparison of the landscape patterns of impervious surface area (ISA), vegetated area (VA), bare soil (BS), and water body (WB) in 2000 and 2018 using the five landscape indices: (b) PD, (c) LPI, (d) LSI, and (e) CONNECT.

3.3.2 The terrain effects on urban/intra-urban land structure development

In 2000, 46% of the urban land in arid/semiarid China was flat (slope ≤5°), 39% had a gentle slope (5°<slope≤10°), and only 3% of the urban land had a slope > 15° (Table 4). Flat areas were more suitable for ISA development. The majority (62%) of the ISA was found in flat areas, and nearly 73% of the new ISA was developed in flat areas during 2000-2018. The urban greenspaces in arid/semiarid cities also tended to be found in flat areas. More than half (52%-53%) of the vegetated area had a slope <5°. The lands that were too steep for ISA development and vegetation cultivation were left bare. More than half of the bare soil in arid/semiarid cities was found on slopes. Because urban land tended to expand into flat areas, the mean slope (5.74°) of the arid/semiarid cities in 2018 was lower than that (6.06°) in 2000.
Table 4 Terrain effects on urban lands across all the studied cities in arid/semiarid China
Study area Units All land-cover types ISA Vegetated areas Bare soil
≤5° 5°-
10°
10°-15° >15° ≤5° 5°-
10°
10°-15° >15° ≤5° 5°-
10°
10°-15° >15° ≤5° 5°-
10°
10°-15° >15°
Urban land in 2000 Area (km2) 931 778 228 67 624 284 71 25 157 110 28 7 320 254 69 19
% 46 39 11 3 62 28 7 2 52 36 9 2 48 38 10 3
Expanded area Area (km2) 698 488 129 44 900 277 49 11 138 87 21 5 141 96 25 9
% 51 36 9 3 73 22 4 1 55 35 8 2 52 35 9 3
Urban land in 2018 Area (km2) 1629 1266 357 111 1524 562 119 36 295 197 49 13 266 196 53 16
% 48 38 11 3 68 25 5 2 53 36 9 2 50 37 10 3

4 Discussion

4.1 China’s arid/semiarid cities became greener with improved ecosystem services

Unlike in the humid regions of China, where urbanization led to shrinkage of greenspaces (Kuang, 2019), our study revealed expansions of both greenspace and ISA in arid/semiarid cities of China during 2000-2018 (Figure 6). The changes to a greyer (sealed soil) and greener (higher vegetation coverage) urban landscape might be helpful in reducing wind erosion, which causes serious air pollution in the arid/semiarid cities of China (Zhang et al., 2010). The expansion of greenspace could also improve ecosystem services such as heat regulation in desert cities (Young, 2010; Lehmann et al., 2014). These changes may be related to the shift towards a more sustainable urban development strategy by the Chinese government in recent years (Wang et al., 2015). Our analysis demonstrated that the majority (74.47%) of the increased vegetation area was found in the newly expanded urban areas after 2000, while the mean vegetation coverage of the old urban areas actually decreased from 60.4% to 57.2% during 2000-2018. In the face of intensified ISA development in downtown areas (Figure 7), it is paramount to protect valuable inner-city greenspaces.
In addition, we also found that the greenspace in the newly expanded urban areas was distributed among diverse land-use types including parks, residential areas, institutional areas, roadsides, etc., while the greenspace in the old urban areas was mainly concentrated in a few large parks. This new pattern of urban greenspace may enhance its provision of ecological services (e.g., air pollution suppression, heat regulation, aesthetic service, etc.) (Kuang et al., 2017). More scattered greenspace patches, however, also indicated more fragmented urban ecosystems. During 2000-2018, the connectivity of the urban greenspaces decreased by 40%, the largest patch index decreased by 66%, and the patch density increased by 66% (Figures 8b-8e). As the ISA expanded rapidly, the land diversity (as measured by SHDI) in the arid/semiarid cities declined 17% during 2000-2018 (Figure 8a). Such changes could have negative impacts on the habitats of wildlife (Huang et al., 2016). Therefore, it is critical to establish large greenspace reserves and develop ecological corridors to protect the wildlife in the urbanized area in arid/semiarid China.
Beside improving local ecosystem services, an increasingly green urban environment in arid/semiarid regions could also enhance ecosystem carbon sink, thus contributing to global carbon sequestration (Zhang et al., 2014). Our analysis demonstrated that the newly expanded urban greenspaces were mainly converted from previous bare soil in arid/semiarid China (Figure 7), resulting in the transition from low-carbon-density soil (~5.55 kg C m‒2 according to Shi et al. (2004)) in dryland to medium-carbon-density soil (~8.08 kg C m‒2 according to Shi et al. (2004)) in vegetated urban land. This was in contrast to the urbanization effects in humid areas of China, where new urban lands were mainly converted from cropland with high soil carbon density (~9.94 kg C m‒2 according to Shi et al. (2004)), leading to carbon losses. The expanding greenspace in arid/semiarid cities of China could be helpful in partially offsetting carbon emissions from cities (Grimm et al., 2008), which is conducive to achieving China’s goals of carbon peak before 2030 and carbon neutralization by 2060.

4.2 Environmental constraint effect on urban expansion and intra-urban land structure changes in arid/semiarid China

Urban expansion was influenced by environmental factors. Compared to urbanization in humid regions, it is possible that urban land expansion in arid/semiarid China was strongly constrained by environmental factors such as water deficit due to the dry climate and sparse river network backgrounds. Our analysis showed that the OUE cities, which had better water supply than the DUE cities, also had higher (>150%) urban expansion rates. Urban lands in the OUE cities not only had higher vegetation coverage but also had higher proportions of built-up lands (ISA) than the DUE cities (Figure 7). In 2018, 25.29% of the area in the DUE cities was occupied by bare soil. In contrast, bare soil only covered in 11.81% of the land in OUE cities. These findings suggests that land development in DUE cities has been seriously constrained.
During urban expansion, intra-urban land structure change such as impervious surface area (ISA) was constrained by terrain. As shown in our study, flat regions with slope less than 5° were more convenient for ISA development, because 62% of the ISA was found in flat regions in old urban lands in 2000 and nearly 73% of the newly constructed ISA in new urban lands from 2000-2018 was also developed in flat regions in arid/semiarid China. To discuss this issue in depth, we selected four cities for the comparative analysis of the terrain constraint on urban ISA spatial expansion form. Two cities (i.e., Xining and Lanzhou) were located in mountainous areas, but the terrain of the mountains was different in these two cities. The other two cities (i.e., Alxa and Karamay) were located in plain areas. The cities of Xining and Lanzhou, where urban ISA expansion strictly followed the directions of the valleys, developing an X-shaped spatial expansion form in Xining and a belt-shaped spatial expansion form in Lanzhou (Figures 9a and 9b). In comparison, the ISA in cities that located on plain regions such as the cities of Alxa and Karamay, expanded in all directions (Figures 9c and 9d) due to no obstacle of terrain in the surrounding area of the cities. This finding agreed well with the study of Lu (2018), who found strong slope constraints on urban ISA distributions in Vientiane (Laos), Lanzhou (China), and Ulaanbaatar (Mongolia). The constraint of slope on urban ISA expansion displayed that urban landscape planning and development should take into account environmental constraints, especially in mountainous areas.
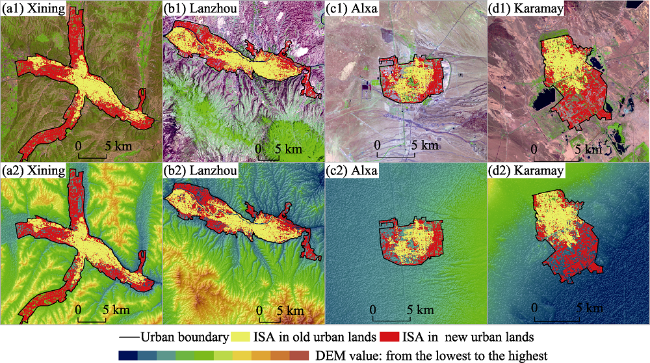
Figure 9 Terrain constraints on urban land development (i.e., ISA expansion) in Xining (a1, a2), Lanzhou (b1, b2), Alxa (c1, c2), and Karamay (d1, d2). Notes: To compare the different space sizes of each city, we set the scale of 10 kilometers. Meanwhile, the outer border size of each city was set to a square with the side length of 3.25 cm.
Besides, the impact of socio-economic factors on urban expansion and intra-urban land change should be also discussed. Previous studies displayed a 1223% increase in gross domestic product (GDP) and a 118.6% increase in urban population in dryland cities since 2000 in arid/semiarid China (Zhang et al., 2009; Liu et al., 2014; Pan et al., 2017; Ning et al., 2018). However, the area of urban development only increased by 68% in arid/semiarid China during 2000-2018. Here, we further investigated the relationship between socio-economic factors (i.e., GDP and population) and urban development in arid/semiarid China. The correlation between GDP and urban development passed the significance test (R2= 0.7393, p < 0.05), showing that the rapid economic development has promoted the expansion of urban area to a certain extent. Furthermore, population growth also significantly increased ISA (R2 = 0.8148, p < 0.05). A stronger fitting result (i.e., R2) appeared in the dynamic change of population and ISA to the dynamic change of GDP and urban expansion. This may mean that population growth may act as a more proactive role in promoting ISA change, considering that the increase of urban population required basic housing, transportation and business conditions such as residential area, roads and squares. All of them were based on ISA as the basic carrier.

4.3 Differentiated urban evolution forms and their effect in the context of arid and humid environments

This study found that one-third of urban expansion in arid/semiarid China was contributed by three large cities, including the Urumqi, Hohhot, and Yinchuan, all of which were administrative and economic centers (Figure 5b). Furthermore, the top six largest cities accounted for 51% of the urban land area in 2018 and contributed to 50% of the urban expansion during 2000-2018 in the study area (Figure 5b). It was clear that urban expansion in arid/semiarid China was mainly concentrated in a few big cities. This pattern was very different from the urbanization pattern at national scale, where the expansions of the Chinese top three cities (i.e., Beijing, Shanghai, Guangzhou) only accounted for 3% of the total urban land expansion in China at the same time.
The difference in urbanizations pattern between the arid/semiarid regions and the humid regions could be attributed to their differences in the economy and environmental constrains. While urbanization in the humid southeastern/coastal provinces of China, were boosted primarily by the rapid economic development supported by foreign and private investments since the market-oriented Economic Reform beginning in 1978 (Lin and Du, 2015), urbanization in arid/semiarid China were mainly boosted by the government’s investments under the impetus of China’s Western Development Strategy (WDS) campaign since 2000. It is no surprise that the top-down investments from the government agencies and state-owned companies tended to concentrate in the administrative centers and mainly stimulated land development in big cities that acted as political and economic centers in arid/semiarid China. In contrast, the bottom-up development of market-oriented economy in the southeast/coastal regions stimulated a wide-range expansion of mid/small-size cities/towns across humid China.
Water supply is a major constraint over urbanization in arid/semiarid China. China’s administrative policies tended to give high priority to guarantee water supply for economic and political centers (i.e., big cities), while many small cities/towns had to compete with the surrounding agricultural regions for water resources, thus restricting their development. While water supply is not a big problem in the humid regions, the cities in southeastern/coastal China had to compete with the nearby agriculture areas for land resources. Because the Chinese government has set strict red-lines to protect its cropland resource (He et al., 2018), many big cities in humid China cannot obtain adequate land resources for expansion. In comparison, the big cities, esp. the DUE cities, in arid/semiarid China can expand into the surrounding desert areas without limitation.
The aggregated urbanization pattern in arid/semiarid regions has multiple benefits. Large cities have higher economic efficiency (Zhang et al., 2015), and the centralized management of water resources could also enhance water-use efficiency in the arid/semiarid areas. It was more efficient for the government to build and maintain a few large aqueducts to support the expansions of a few large cities than to develop a large and complex aqueduct systems to support many small cities/towns across the vast arid/semiarid areas in China. Moreover, concentrating land development and urban population in a few big cities could effectively reduce human disturbance on the fragile desert ecosystems in northwestern China. Meanwhile, the expansion of large oasis cities can also generate stronger wet island effect which improves the urban livability in arid/semiarid regions (Hao and Li, 2016).

5 Conclusions

Based on Landsat ETM+ and OLI images, this study investigated urban expansion and intraurban land cover structure changes as well as their natural environmental constraints across all administrative center cities in arid and semiarid regions of China. The synergetic remote sensing methodology can address the Landsat image mixed pixel problem in arid areas, with overall urban land classifications of 90.67% and 91.82% in 2000 and 2018, respectively. Then, we found that urban expansion in arid/semiarid regions of China was dominated by a few large cities that played central roles in regional political and economic processes. The intraurban lands became greener and greyer (more greenspace and impervious surface (ISA)) and more fragmented during 2000-2018. The increase in vegetation coverage was mainly found in the newly expanded urban areas, while the vegetation coverage of old urban areas decreased from 60.4% to 57.2% during 2000-2018. In addition, the urban landscape became more fragmented. It is important to protect the valuable greenspace in old downtown areas and increase the connectivity among urban green patches. From the perspective of environmental constraints, the expansion and land/greenspace development in arid DUE cities were slower than those in OUE cities. The landscapes of the DUE cities became more fragmented compared with those of the OUE cities. The differences between the OUE and DUE cities indicated that urban expansion and land development in arid/semiarid cities were strongly constrained by water availability. Additionally, urban development was constrained by terrain, with 73% of the ISA expansion occurring in flat areas, while most of the undeveloped land (bare soil) was found on slopes. These findings indicated that urban landscape planning and modelling should take environmental constraints into account, especially in arid/semiarid regions and mountainous areas.
[1]
Bai X, Shi P, Liu Y, 2014. Society: Realizing China’s urban dream. Nature, 509(7499): 158-160.

DOI

[2]
Bren D C, Reitsma F, Baiocchi G et al., 2017. Future urban land expansion and implications for global croplands. Proceedings of the National Academy of Sciences, 114(34): 8939-8944.

DOI

[3]
Breuste J, Haase D, Elmqvist T, 2013. Urban landscapes and ecosystem services. Ecosystem Services in Agricultural and Urban Landscapes, 24(10): 83-104.

[4]
Cao S, 2011. Impact of China’s large-scale ecological restoration program on the environment and society in arid and semiarid areas of China: Achievements, problems, synthesis, and applications. Critical Reviews in Environmental Science and Technology, 41(4): 317-335.

DOI

[5]
Chen J, 2007. Rapid urbanization in China: A real challenge to soil protection and food security. Catena, 69(1): 1-15.

DOI

[6]
Chen M, Liu W, Tao X, 2013. Evolution and assessment on China’s urbanization 1960-2010: Under-urbanization or over-urbanization? Habitat International, 38(6): 25-33.

DOI

[7]
Cui Y, Shao J, 2005. The role of ground water in arid/semiarid ecosystems, Northwest China. Groundwater, 43(4): 471-477.

PMID

[8]
Deng J S, Wang K, Hong Y et al., 2009. Spatio-temporal dynamics and evolution of land use change and landscape pattern in response to rapid urbanization. Landscape and Urban Planning, 92(3/4): 187-198.

DOI

[9]
Deng X, Huang J, Rozelle S et al., 2015a. Impact of urbanization on cultivated land changes in China. Land Use Policy, 45(2): 1-7.

DOI

[10]
Deng Y, Liu S, Cai J et al., 2015b. Spatial pattern and its evolution of Chinese provincial population: Methods and empirical study. Journal of Geographical Sciences, 25(12): 1507-1520.

DOI

[11]
Fang C L, 2015. Important progress and future direction of studies on China’s urban agglomerations. Journal of Geographical Sciences, 25(8): 1003-1024.

DOI

[12]
Fang C L, 2023. How to promote the green development of urbanization in the Tibetan Plateau? Journal of Geographical Sciences, 33(3): 639-654.

DOI

[13]
Grimm N B, Faeth S H, Golubiewski N E et al., 2008. Global change and the ecology of cities. Science, 319(5864): 756-760.

DOI PMID

[14]
Hao X, Li W, 2016. Oasis cold island effect and its influence on air temperature: A case study of Tarim Basin, Northwest China. Journal of Arid Land, 8(5): 172-183.

DOI

[15]
He P, Gao J, Zhang W et al., 2018. China integrating conservation areas into red lines for stricter and unified management. Land Use Policy, 71(11): 245-248.

DOI

[16]
Heylen R, Burazerovic D, Scheunders P, 2011. Fully constrained least squares spectral unmixing by simplex projection. IEEE Transactions on Geoscience and Remote Sensing, 49(11): 4112-4122.

DOI

[17]
Huang J, Ji M, Xie Y et al., 2016. Global semi-arid climate change over last 60 years. Climate Dynamics, 46(9): 1131-1150.

DOI

[18]
Jebur M N, Mohd S H, Pradhan B et al., 2014. Per-pixel and object-oriented classification methods for mapping urban land cover extraction using SPOT 5 imagery. Geocarto International, 29(7): 792-806.

DOI

[19]
Kuang W, 2019. Mapping global impervious surface area and green space within urban environments. Science China Earth Sciences, 62(11): 1591-1606.

DOI

[20]
Kuang W, Liu J, Dong J et al., 2016. The rapid and massive urban and industrial land expansions in China between 1990 and 2010: A CLUD-based analysis of their trajectories, patterns, and drivers. Landscape and Urban Planning, 145(2): 21-33.

DOI

[21]
Kuang W, Yang T, Liu A et al., 2017. An EcoCity model for regulating urban land cover structure and thermal environment: Taking Beijing as an example. Science China Earth Sciences, 60(7): 1098-1109.

DOI

[22]
Lehmann I, Mathey J, Rößler S et al., 2014. Urban vegetation structure types as a methodological approach for identifying ecosystem services: Application to the analysis of micro-climatic effects. Ecological indicators, 42(10): 58-72.

DOI

[23]
Li C, Wang J, Wang L, et al., 2014. Comparison of classification algorithms and training sample sizes in urban land classification with Landsat thematic mapper imagery. Remote Sensing, 6(2): 964-983.

DOI

[24]
Li Y, Wang J, Liu Y et al., 2014. Problem regions and regional problems of socioeconomic development in China: A perspective from the coordinated development of industrialization, informatization, urbanization and agricultural modernization. Journal of Geographical Sciences, 24(6): 1115-1130.

DOI

[25]
Li Z, Deng X, Huang J et al., 2013. Critical studies on integrating land-use induced effects on climate regulation services into impact assessment for human well-being. Advances in Meteorology, 13(10): 1-14.

[26]
Lin B, Du K, 2015. Energy and CO2 emissions performance in China’s regional economies: Do market-oriented reforms matter? Energy Policy, 78(3): 113-124.

DOI

[27]
Liu J, Kuang W, Zhang Z et al., 2014. Spatiotemporal characteristics, patterns, and causes of land-use changes in China since the late 1980s. Journal of Geographical Sciences, 24(2): 195-210.

DOI

[28]
Liu J, Liu M, Tian H et al., 2005. Spatial and temporal patterns of China’s cropland during 1990-2000: an analysis based on Landsat TM data. Remote Sensing of Environment, 98(4): 442-456.

DOI

[29]
Liu J, Zhang Z, Xu X et al., 2010. Spatial patterns and driving forces of land use change in China during the early 21st century. Journal of Geographical Sciences, 20(1): 483-494.

DOI

[30]
Long B, Zhang B, He C et al., 2018. Is there a change from a warm-dry to a warm-wet climate in the inland river area of China? Interpretation and analysis through surface water balance. Journal of Geophysical Research: Atmospheres, 123(14): 7114-7131.

[31]
Lu D, Li G, Kuang W et al., 2014. Methods to extract impervious surface areas from satellite images. International Journal of Digital Earth, 7(2): 93-112.

DOI

[32]
Lu D, Li L, Li G et al., 2018. Examining spatial patterns of urban distribution and impacts of physical conditions on urbanization in coastal and inland metropoles. Remote Sensing, 10(7): 1101-1124.

DOI

[33]
Luo G, Chen G, Tian L et al., 2016. Minimum noise fraction versus principal component analysis as a preprocessing step for hyperspectral imagery denoising. Canadian Journal of Remote Sensing, 42(2): 106-116.

DOI

[34]
Newman M E, McLaren K P, Wilson B S, 2014. Long-term socio-economic and spatial pattern drivers of land cover change in a Caribbean tropical moist forest, the Cockpit Country, Jamaica. Agriculture, Ecosystems & Environment, 186(4): 185-200.

[35]
Ning J, Liu J, Kuang W et al., 2018. Spatiotemporal patterns and characteristics of land-use change in China during 2010-2015. Journal of Geographical Sciences, 28(3): 547-562.

DOI

[36]
Pan T, Du G, Dong J et al., 2019. Divergent changes in cropping patterns and their effects on grain production under different agro-ecosystems over high latitudes in China. Science of the Total Environment, 659(12): 314-325.

DOI

[37]
Pan T, Lu D, Zhang C et al., 2017. Urban land-cover dynamics in arid China based on high-resolution urban land mapping products. Remote Sensing, 9(7): 730-744.

DOI

[38]
Pielke R A, 2005. Land use and climate change. Science, 310(5754): 1625-1626.

PMID

[39]
Pu H, Xia W, Wang B et al., 2013. A fully constrained linear spectral unmixing algorithm based on distance geometry. IEEE Transactions on Geoscience and Remote Sensing, 52(2): 1157-1176.

DOI

[40]
Rao W, Yang J, Chen J et al., 2006. Sr-Nd isotope geochemistry of eolian dust of the arid-semiarid areas in China: Implications for loess provenance and monsoon evolution. Chinese Science Bulletin, 51(2): 1401-1412.

[41]
Ridd M K, 1995. Exploring a VIS (vegetation-impervious surface-soil) model for urban ecosystem analysis through remote sensing: Comparative anatomy for cities. International Journal of Remote Sensing, 16(12): 2165-2185.

DOI

[42]
Schneider A, Mertes C M, Tatem A J et al., 2015. A new urban landscape in East-Southeast Asia, 2000-2010. Environmental Research Letters, 10(3): 34-52.

[43]
Seto K C, Shepherd J M, 2009. Global urban land-use trends and climate impacts. Current Opinion in Environmental Sustainability, 1(1): 89-95.

DOI

[44]
Sharma R, Ghosh A, Joshi P K, 2013. Decision tree approach for classification of remotely sensed satellite data using open source support. Journal of Earth System Science, 122(4): 1237-1247.

DOI

[45]
Shi X Z, Yu D S, Warner E D et al., 2004. Soil database of 1:1,000,000 digital soil survey and reference system of the Chinese genetic soil classification system. Soil Survey Horizons, 45(4): 129-136.

[46]
Silván-Cárdenas J L, Wang L, 2010. Fully constrained linear spectral unmixing: Analytic solution using fuzzy sets. IEEE Transactions on Geoscience and Remote Sensing, 48(11): 3992-4002.

DOI

[47]
Tang C, He Y, Zhou G et al., 2018. Optimizing the spatial organization of rural settlements based on life quality. Journal of Geographical Sciences, 28(5): 685-704.

DOI

[48]
Wang X R, Hui C M, Choguill C et al., 2015. The new urbanization policy in China: Which way forward? Habitat International, 47(6): 279-284.

DOI

[49]
Xu H, 2006. Modification of normalised difference water index (NDWI) to enhance open water features in remotely sensed imagery. International Journal of Remote Sensing, 27(14): 3025-3033.

DOI

[50]
Young R F, 2010. Managing municipal green space for ecosystem services. Urban Forestry & Urban Greening, 9(4): 313-321.

[51]
Zhang C, Chen Y, Lu D, 2015. Mapping the land-cover distribution in arid and semiarid urban landscapes with Landsat Thematic Mapper imagery. International Journal of Remote Sensing, 36(17): 4483-4500.

DOI

[52]
Zhang C, Tian H, Pan S et al., 2014. Multi-factor controls on terrestrial carbon dynamics in urbanized areas. Biogeosciences, 11(24): 7107-7124.

DOI

[53]
Zhang W, Zhuang G, Huang K et al., 2010. Mixing and transformation of Asian dust with pollution in the two dust storms over the northern China in 2006. Atmospheric Environment, 44(28): 3394-3403.

DOI

[54]
Zhang Y, Yang D, Zhang X et al., 2009. Regional structure and spatial morphology characteristics of oasis urban agglomeration in arid area: A case of urban agglomeration in northern slope of Tianshan Mountains, Northwest China. Chinese Geographical Science, 19(8): 341-348.

DOI

Outlines

/