
Journal of Geographical Sciences >
Evaluation method and empirical application of human activity suitability of land resources in Qinghai-Tibet Plateau
|
Xu Yong (1964-), PhD and Professor, specialized in regional sustainable development and human-environment interactions. E-mail: xuy@igsnrr.ac.cn |
Received date: 2023-04-10
Accepted date: 2023-05-15
Online published: 2023-07-24
Supported by
The Second Tibetan Plateau Scientific Expedition and Research(2019QZKK0406)
The National Key Research and Development Program of China(2018YFD1100101)
The current suitability evaluation methods for land resources human activity in China suffer from theoretical deficiencies related to fundamental data accuracy, elevation and slope classification, and suitability class judgment. Empirical application of these methods is also hindered by excessive evaluation indicators, data acquisition difficulties, and limited applicability to high altitude regions. To address these issues, this paper proposes a technical evaluation framework for the Qinghai-Tibet Plateau (QTP) that employs selected key parameters varying with elevation and slope to establish grid-scale evaluation models for construction land suitability (CLS) and arable land suitability (ALS). A generalized algorithm is then proposed for key parameters such as air density, air temperature, slope suitability for construction, and soil erosion resistance of sloping arable land. Empirical research is conducted using Milin County in southeast Tibet as a case study, with interval measurements of 100 m in elevation and 1° in slope. The evaluation model is tested using grid accuracies of 30 m, 50 m, 100 m, 250 m, 500 m, and 1000 m. The results reveal that: Firstly, the CLS and ALS can be categorized into five classes: highly suitable, suitable, moderately suitable, marginally suitable, and unsuitable, with varying area ratios under different grid accuracies. Secondly, existing construction lands in Milin County are mainly distributed in suitable, highly suitable, and moderately suitable CLS classes, accounting for over 94% of the total area studied under different grid accuracies. While arable land is mainly distributed in suitable, highly suitable, and moderately suitable ALS classes, accounting for over 96%. Thirdly, the empirical research in Milin County indicates that the evaluation method, quantitative model, and parameters algorithm for evaluating human activity suitability of land resources on the QTP are feasible and applicable, with a recommended grid accuracy within 100 m and a maximum of 250 m. Fourthly, the paper establishes a correspondence between land suitability (including construction land and arable land) and topographic factors (elevation and slope) that can be applied to the QTP. Finally, some professional defects in the evaluation methods of available land resources in Major Function Zoning and “Double Evaluations” of Territorial Spatial Planning in China when applied to the QTP are identified.
XU Yong , WANG Lijia , YANG Hua . Evaluation method and empirical application of human activity suitability of land resources in Qinghai-Tibet Plateau[J]. Journal of Geographical Sciences, 2023 , 33(7) : 1397 -1418 . DOI: 10.1007/s11442-023-2135-5
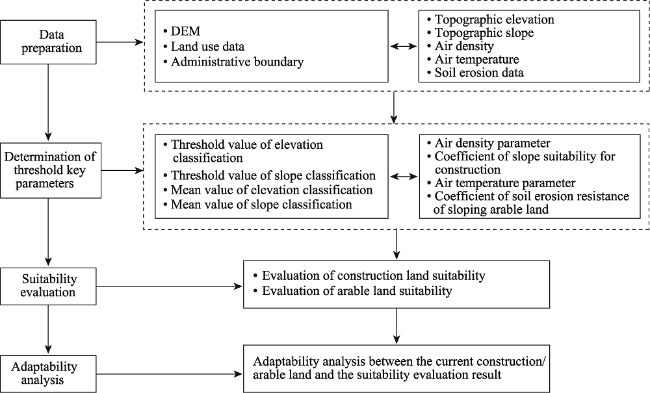
Figure 1 Analytical framework |
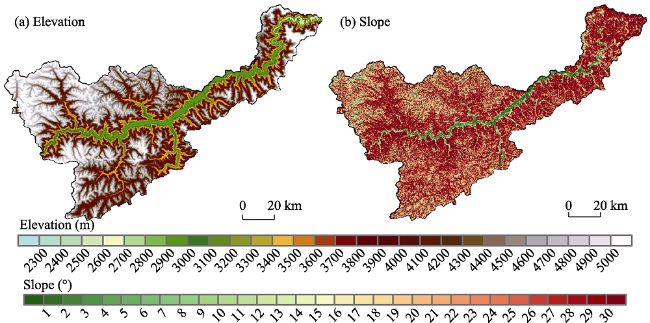
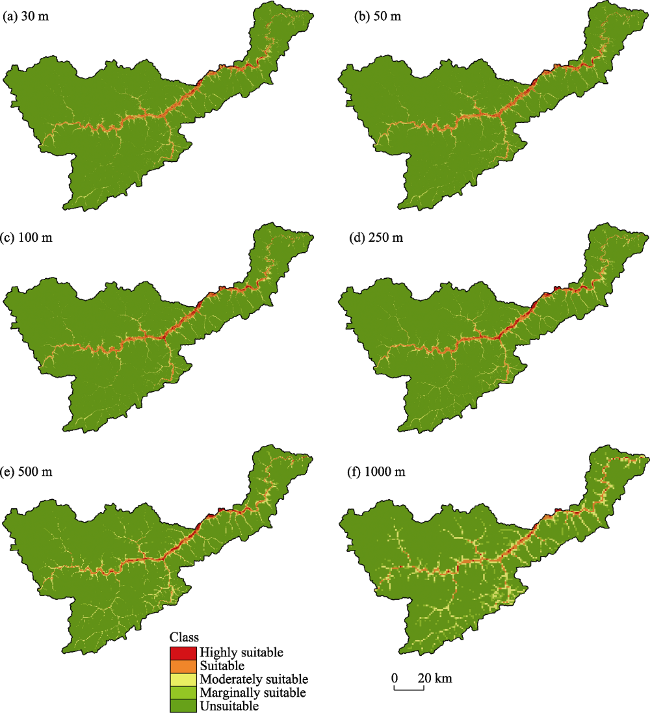
Figure 2 Topographic elevation (a) and slope (b) classification in Milin County, Tibet |
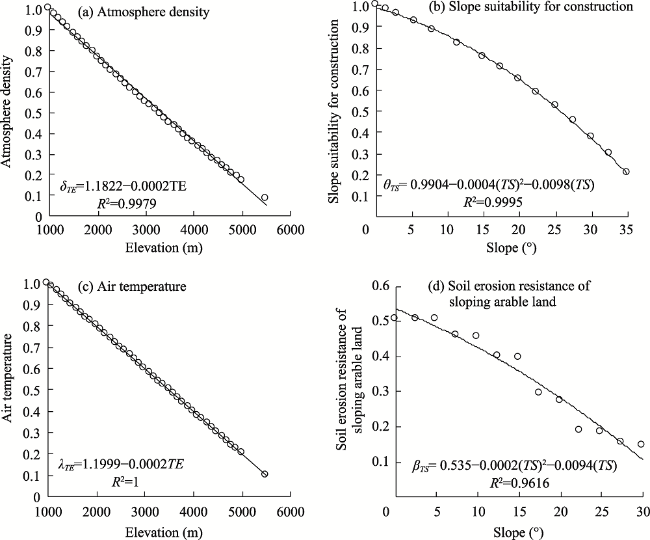
Figure 3 Fitting curve of key parameters with elevation and slope |
Table 1 Classes area of construction land suitability under different grid accuracy |
| CLS classes | CLS value | 30 m | 50 m | 100 m | 250 m | 500 m | 1000 m | ||||||
|---|---|---|---|---|---|---|---|---|---|---|---|---|---|
| Area (km2) | Ratio (%) | Area (km2) | Ratio (%) | Area (km2) | Ratio (%) | Area (km2) | Ratio (%) | Area (km2) | Ratio (%) | Area (km2) | Ratio (%) | ||
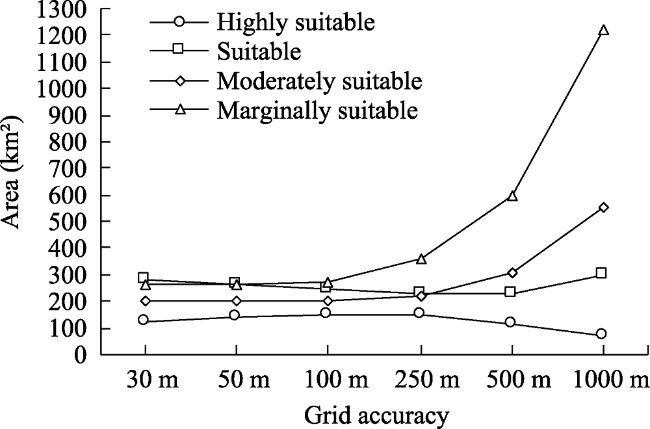
| Highly suitable | ≥0.58 | 120.41 | 1.26 | 135.95 | 1.43 | 152.77 | 1.60 | 147.39 | 1.55 | 118.23 | 1.24 | 70.30 | 0.74 |
| Suitable | (0.58,0.48] | 277.97 | 2.92 | 267.33 | 2.80 | 246.20 | 2.58 | 228.79 | 2.40 | 228.64 | 2.40 | 295.09 | 3.10 |
| Moderately suitable | (0.48,0.38] | 201.93 | 2.12 | 199.91 | 2.10 | 199.34 | 2.09 | 219.98 | 2.31 | 310.34 | 3.26 | 553.25 | 5.80 |
| Marginally suitable | (0.38,0.28] | 263.95 | 2.77 | 264.69 | 2.78 | 273.75 | 2.87 | 364.36 | 3.82 | 599.31 | 6.29 | 1218.69 | 12.79 |
| Unsuitable | <0.28 | 8666.56 | 90.93 | 8662.95 | 90.89 | 8658.77 | 90.85 | 8570.30 | 89.92 | 8274.30 | 86.82 | 7393.50 | 77.57 |
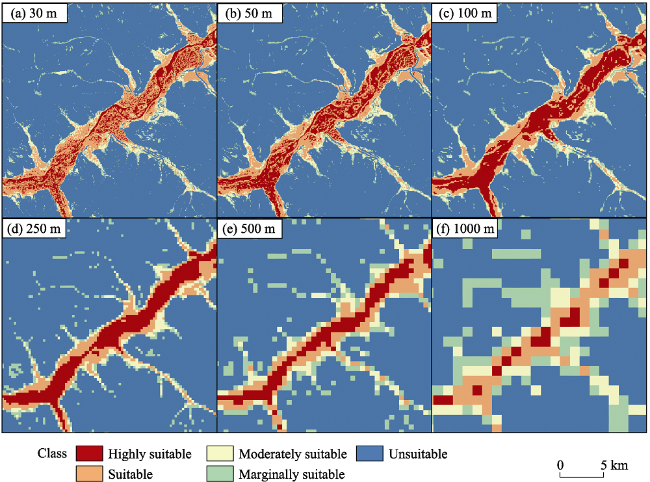
Figure 5 Partial map of construction land suitability under different grid accuracy |
Figure 6 Classes area change of construction land suitability under different grid accuracy |
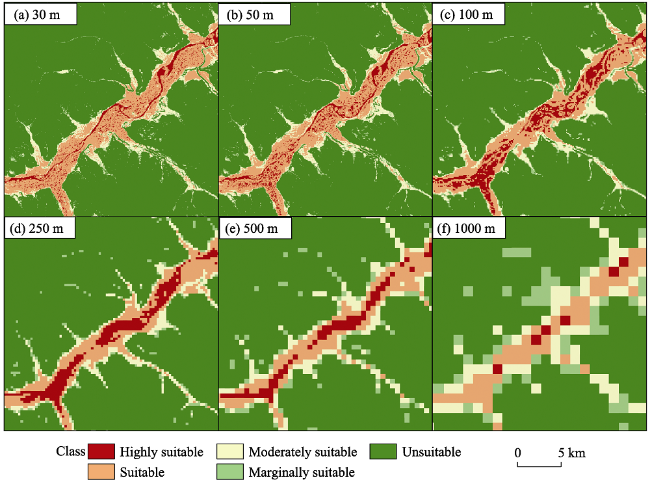
Figure 7 Distribution of arable land suitability under different grid accuracy |
Table 2 Classes area of arable land suitability under different grid accuracy |
| ALS classes | ALS value | 30 m | 50 m | 100 m | 250 m | 500 m | 1000 m | ||||||
|---|---|---|---|---|---|---|---|---|---|---|---|---|---|
| Area (km2) | Ratio (%) | Area (km2) | Ratio (%) | Area (km2) | Ratio (%) | Area (km2) | Ratio (%) | Area (km2) | Ratio (%) | Area (km2) | Ratio (%) | ||
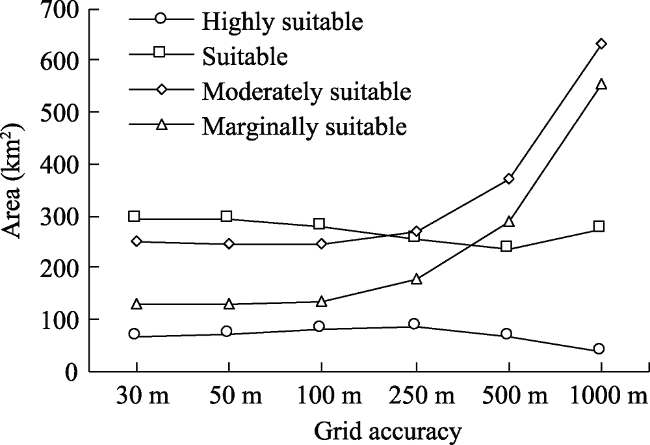
| Highly suitable | ≥0.32 | 68.41 | 0.72 | 72.74 | 0.76 | 83.64 | 0.88 | 85.01 | 0.89 | 69.01 | 0.72 | 36.68 | 0.38 |
| Suitable | (0.32, 0.274] | 292.14 | 3.07 | 293.62 | 3.08 | 278.86 | 2.93 | 256.68 | 2.69 | 237.79 | 2.49 | 271.82 | 2.85 |
| Moderately suitable | (0.274, 0.21] | 249.31 | 2.62 | 246.27 | 2.50 | 246.53 | 2.59 | 267.41 | 2.81 | 370.66 | 3.89 | 633.13 | 6.64 |
| Marginally suitable | (0.21, 0.18] | 128.89 | 1.35 | 130.16 | 1.37 | 136.66 | 1.43 | 178.39 | 1.87 | 288.00 | 3.02 | 551.70 | 5.79 |
| Unsuitable | <0.18 | 8792.08 | 92.25 | 8788.03 | 92.21 | 8785.14 | 92.18 | 8743.33 | 91.74 | 8565.37 | 89.87 | 8037.49 | 84.33 |
Figure 8 Partial map of arable land suitability under different grid accuracy |
Figure 9 Classes area change of arable land suitability under different grid accuracy |
Table 3 Existing construction land area in CLS classes under different grid accuracy |
| Class | Urban, rural, industrial and mining land | Transportation land | ||||||||||
|---|---|---|---|---|---|---|---|---|---|---|---|---|
| 30 m | 50 m | 100 m | 30 m | 50 m | 100 m | |||||||
| Area (km2) | Ratio (%) | Area (km2) | Ratio (%) | Area (km2) | Ratio (%) | Area (km2) | Ratio (%) | Area (km2) | Ratio (%) | Area (km2) | Ratio (%) | |
| Highly suitable | 2.44 | 23.01 | 2.78 | 26.17 | 3.08 | 28.99 | 2.61 | 12.17 | 3.24 | 15.13 | 3.87 | 18.06 |
| Suitable | 6.78 | 63.85 | 6.52 | 61.34 | 5.96 | 56.07 | 8.36 | 39.03 | 7.82 | 36.47 | 6.97 | 32.52 |
| Moderately suitable | 1.01 | 9.52 | 0.94 | 8.85 | 1.07 | 10.04 | 3.71 | 17.31 | 3.68 | 17.18 | 3.81 | 17.76 |
| Marginally suitable | 0.24 | 2.28 | 0.23 | 2.21 | 0.35 | 3.27 | 1.88 | 8.78 | 1.96 | 9.16 | 2.31 | 10.78 |
| Unsuitable | 0.14 | 1.33 | 0.15 | 1.43 | 0.17 | 1.63 | 4.87 | 22.72 | 4.73 | 22.06 | 4.48 | 20.88 |
| Total | 10.62 | 100 | 10.62 | 100 | 10.62 | 100 | 21.43 | 100 | 21.43 | 100 | 21.43 | 100 |
Table 4 Area of arable land and garden land in ALS classes under different grid accuracy |
| Class | Arable land | Garden land | ||||||||||
|---|---|---|---|---|---|---|---|---|---|---|---|---|
| 30 m | 50 m | 100 m | 30 m | 50 m | 100 m | |||||||
| Area (km2) | Ratio (%) | Area (km2) | Ratio (%) | Area (km2) | Ratio (%) | Area (km2) | Ratio (%) | Area (km2) | Ratio (%) | Area (km2) | Ratio (%) | |
| Highly suitable | 4.96 | 6.96 | 7.39 | 10.38 | 11.08 | 15.55 | 0.69 | 6.95 | 0.90 | 9.15 | 1.39 | 14.05 |
| Suitable | 53.45 | 75.05 | 51.36 | 72.11 | 45.99 | 64.57 | 7.69 | 77.74 | 7.55 | 76.38 | 6.81 | 68.89 |
| Moderately suitable | 11.41 | 16.02 | 10.96 | 15.39 | 11.77 | 16.52 | 1.28 | 12.91 | 1.23 | 12.43 | 1.39 | 14.04 |
| Marginally suitable | 0.73 | 1.02 | 0.75 | 1.05 | 1.20 | 1.69 | 0.12 | 1.24 | 0.11 | 1.06 | 0.17 | 1.70 |
| Unsuitable | 0.67 | 0.94 | 0.76 | 1.07 | 1.18 | 1.66 | 0.11 | 1.16 | 0.10 | 0.98 | 0.13 | 1.32 |
| Total | 71.23 | 100 | 71.23 | 100 | 71.23 | 100 | 9.89 | 100 | 9.89 | 100 | 9.89 | 100 |
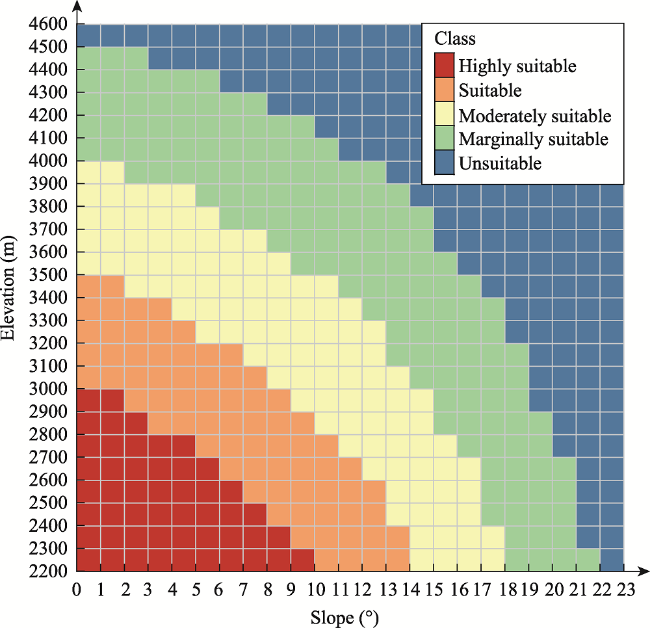
Figure 10 Corresponding pedigree between CLS classes and elevation and slope |
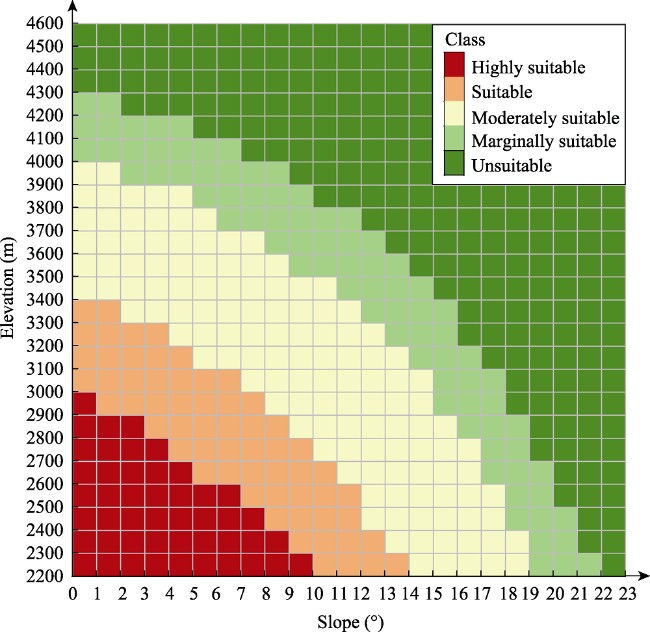
Figure 11 Corresponding pedigree between ALS classes and elevation and slope |
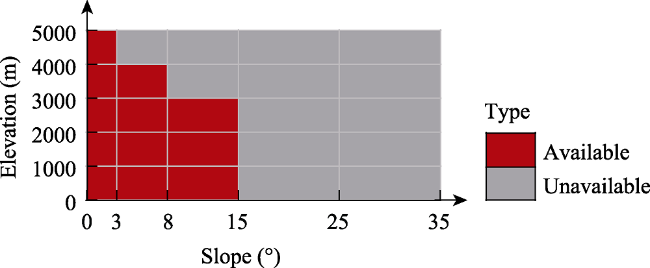
Figure 12 Corresponding pedigree between available land resources and elevation and slope of the MFZ |
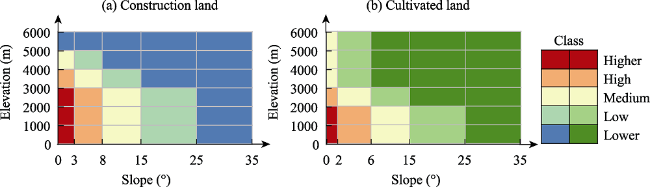
Figure 13 Corresponding pedigree between land resources availability and elevation and slope oriented to urban construction (a) and agriculture function (b) of the Territory Spatial Planning |
| [1] |
|
| [2] |
|
| [3] |
|
| [4] |
|
| [5] |
|
| [6] |
|
| [7] |
General Office of the State Council of the People’s Republic of China GOSCPRC, 2011. Major function oriented zoning of China. http://www.gov.cn/zwgk/2011-06/08/content_1879180.htm2011-06-30/ 2021-12-29. (in Chinese)
|
| [8] |
|
| [9] |
|
| [10] |
Ministry of Natural Resources of the People’s Republic of China MNRPRC, 2020. Assessment guidelines for resource and environmental carrying capacity and territorial development suitability. http://www.gov.cn/zhengce/zhengceku/2020-01/22/content_5471523.htm2020-01-19/ 2021-12-29. (in Chinese)
|
| [11] |
|
| [12] |
|
| [13] |
|
| [14] |
|
| [15] |
|
| [16] |
Xinhua News Agency XNA, 2017. Provincial spatial planning pilot program issued by General Office of the Central Committee of the Communist Party of China and General Office of the State Council of the People’s Republic of China. http://www.gov.cn/zhengce/2017-01/09/content_5158211.htm2017-01-30/ 2021-12-29. (in Chinese)
|
| [17] |
|
| [18] |
|
| [19] |
|
| [20] |
|
| [21] |
|
| [22] |
|
| [23] |
|
| [24] |
|
| [25] |
|
| [26] |
|
| [27] |
|
| [28] |
|
/
| 〈 |
|
〉 |