Research Articles

Regeneration patterns and drivers of different underutilized lands in the rust belt city of developing country: An empirical case study for Northeast China

  • LI Wenbo , 1 ,
  • LI Han 1 ,
  • YAN Zhuoran 1 ,
  • HU Bingqing 1 ,
  • ZHU Yuanli 2 ,
  • YANG Yuewen 1 ,
  • WANG Dongyan 1
Expand
  • 1. College of Earth Sciences, Jilin University, Changchun 130061, China
  • 2. School of Public Policy and Management, China University of Mining and Technology, Xuzhou 221116, Jiangsu, China

Li Wenbo (1990-), Associate Professor, with a specialty in management and planning of land resources. E-mail:

Received date: 2022-05-18

  Accepted date: 2023-03-24

  Online published: 2023-07-24

Supported by

National Natural Science Foundation of China(42001223)

Abstract

Rust belt cities are largely threatened by a waste of urban space at their core; however, in developing countries where land resources are widely used as instruments for macroeconomic stabilization, urban periphery is also at risk of being underutilized due to land hoarding. Such geographic differences entail new knowledge about how, where, and why underutilized lands are regenerated in the city. Furthermore, rapid urban growth imposes development disparity and mixed underutilization issues on cities in developing countries; therefore, how the geo-information obtained by the regeneration of different underutilized lands differs will be valuable for urban planners and policymakers to make prudent trade-offs. To fill these gaps, we conducted a sequential investigation into the regeneration of underutilized lands in a representative rust belt city - Changchun City in Northeast China, in an attempt to measure the regeneration pattern and analyze the underlying determinants using the Classification and Regression Trees analysis. The results indicated that, of all underutilized lands, increments of vacant lot and remnant cultivated land continued to plague the expanding urban periphery during 2016-2019. In a way, reduced underutilized lands alleviated land use conflicts at the city core. Nearly 23% of the underutilized areas had been regenerated, dominated by realty development, with most converted to residential lands, ecological lands and industrial lands. On the contrary, conversion to transportation lands and parking lots seemed to avoid the rapidly expanding sites. The regeneration rates in a certain area can be increased by a multitude of factors, including denser, simply structured land underutilization, abundant ecosystem services nearby and accessibility to public infrastructures. Site conditions such as residential density and accessibility may have fueled the regeneration associated with residential purposes, while regeneration of industrial development was closely associated with the underutilization density and parcel regularity. This research provides an empirical paradigm for delivering regeneration geo-information across different underutilized lands, particularly for rust belt cities that are caught between a shrinking core and speculative periphery.

Cite this article

LI Wenbo , LI Han , YAN Zhuoran , HU Bingqing , ZHU Yuanli , YANG Yuewen , WANG Dongyan . Regeneration patterns and drivers of different underutilized lands in the rust belt city of developing country: An empirical case study for Northeast China[J]. Journal of Geographical Sciences, 2023 , 33(7) : 1377 -1396 . DOI: 10.1007/s11442-023-2134-6

1 Introduction

Rust belt cities are often linked to underutilization of land resources as they are unlikely to appeal to people or profitable industries (Pottie-Sherman, 2020), prompting an increase in urban vacancy and loss of urban vitality (Kremer et al., 2013; Fu et al., 2020). Measures applied to urban regeneration, such as the Large Lot Program in the city of Chicago (Gobster et al., 2020a) and the Law on the Improvement and Vitalization of the City Center by the Japanese government (Kobayashi and Ikaruga, 2016), have been laid down in many countries in an attempt to revitalize these cities. Globally, the cumulative experience suggests that highly efficient use of urban space and regeneration plans that consider specific demands of the ambient urban fabric are imperative for rust belt cities to address the challenges of city crime, social justice and well-being improvement (Arribas-Bel and Gerrits, 2015; Pettygrove and Ghose, 2018).
Previous studies have demonstrated that it is necessary to build a knowledge base about how, where, and why these underutilized lands are regenerated to inform the planning and decision-making processes associated with urban regeneration (Frantál et al., 2015). Cities include multiple elements that may exert different influences on whether one underutilized land parcel will be regenerated or how it should be developed (Foo et al., 2013). For instance, higher rates of regeneration are considered to be closely associated with densely built-up areas and the development projects are mainly controlled by population density and socio-economic structure (Frantál et al., 2015). Therefore, geographical unevenness of various urban elements shapes the regeneration pattern of underutilized land (Foo et al., 2013; Kim, 2018; Foster et al., 2019). Acquiring detailed geo-information about the occurrence and resolution of underutilized lands will not only provide clues to the optimization of previous practices, but also the prevention of future land abandonment (Gobster et al., 2020b; Zhao et al., 2021). Most importantly, such rigorous spatial-statistical analysis has been acknowledged as a more visual and explicit pathway to acquire this valuable information (Foo et al., 2013; Frantál et al., 2015).
Initial studies in the field were mainly focused on rust belts in developed countries (Foo et al., 2013; Abe et al., 2014; Gobster et al., 2020a, 2020b; Pottie-Sherman, 2020), and rarely discussed this issue in an environment where lands are predominantly state-owned and commonly used as instrument for macroeconomic stabilization (Koroso et al., 2020). As most economic growth is expected to occur in urban areas of developing countries (Jiang and O’Neill, 2017), rust belt cities in these areas will be additionally plagued by peripheral acts of land speculation, which delimits them with distinguishing land use conflicts that may require new knowledge about urban regeneration. In contrast, underutilized lands could be displayed in many forms under different land administration systems, including brownfields (Frantál et al., 2015), urban villages (Zhao et al., 2021) and vacant lots (Gobster et al., 2020a), and would show distinct potentials even under similar conditions; for instance, the area size could limit the regeneration of vacant land but may not be a barrier for brownfield redevelopment (Kremer et al., 2013; Frantál et al., 2015; López et al., 2021). Aside from historical or cultural areas, which often call for micro-renewal strategies (Liu et al., 2019; Xi et al., 2021), urban function zones are in many cases confronted with multiple underutilization issues (Loures and Vaz, 2018; Li et al., 2019). Therefore, a thorough understanding of the similarities and differences of the geo-information delivered by different underutilized lands is needed to regulate the regeneration as expected by urban planners. Despite this, many empirical cases were only dedicated to examining the regeneration pattern of individual category rather than mixed underutilized lands.
Therefore, to shed light on the regeneration of rust belt cities plagued with land underutilization at both their core and periphery, we conducted a sequential investigation in Changchun City from 2016 to 2019, with the aim to a) measure the regeneration patterns of different underutilized lands and b) identify their underlying determinants. The present study abided by the same research framework used in our previous work (Li et al., 2019), in which the underutilized lands were categorized as vacant lot (VL), urban village (UV), abandoned industrial land (AIL) and remnant cultivated land (RCL). The results of the current study serve as a paradigm for the comprehensive regeneration of underutilized lands of rust belt cities in developing countries under similar land administration systems.

1.1 Rust belt cities in Northeast China under the policy-shift of urbanization

Northeast China was one of the earliest regions to be urbanized ever since the People’s Republic of China was founded (Liu et al., 2016; Li et al., 2019). During the First Five-year Plan period (1953-1957), 57 out of 156 national heavy industry projects were being placed in this region. Initially, the industrial production was centered on steel forging and machinery manufacturing (Xie et al., 2016; Li et al., 2019). Later on, industries that were engaged in exploitation of petroleum, coal or forestry resources were also developed due to the regional natural endowment as well as a nation-wide demand for raw materials (Liu et al., 2021). Therefore, the urbanization pattern in Northeast China was originally characterized by resource-based cities such as Hegang and Yichun, or industrial cities such as Shenyang and Changchun (Yu et al., 2019; Wei et al., 2020). The subsequent reform and opening-up policy led to the initiation of a large-scale rapid urbanization process all over China, under which the urbanization rates of all three provinces in Northeast China increased successively to 50% in the early 2000s (Bai et al., 2018; Yu et al., 2019). Meanwhile the rapid economic growth yielded a dozen new first-tier cities in the central and eastern areas, which resulted in large-scale migrations from places that are normally considered unpromising, such as Northeast China (Xie et al., 2016; Li et al., 2019; Yi et al., 2021).
Following widespread industrial decline and city shrinkage, a certain amount of urban lands were directly abandoned at the city core, representing a typical problem associated with rust belt cities worldwide (Song et al., 2021; Tong et al., 2021). Like many other developing countries where large areas of land are used for economic development (Ahmad et al., 2020; Koroso et al., 2020), a mass of built-up land was created at the city periphery at an unprecedented speed, some of which remained idle for years (Li et al., 2019). The limited population growth leads to difficulty in consuming these peripheral land resources, especially for small- or medium-sized cities that have even more severe population outflow (Li et al., 2019; Tong et al., 2021). To mitigate this issue, in 2020, China adopted a strategic adjustment in regard to future urbanization development, which involved controlling weight and building body (Chen et al., 2019; Song et al., 2021). Controlling weight states that the urbanization development for cities faced with potential population outflow should no longer depend on massive peripheral occupation, while building body implies that they should instead turn to interior underutilized lands for prospective urban growth. This policy-shift will undoubtedly change the future urbanization process for rust belt cities in Northeast China. The resulting increase in land use efficiency is designed to convert the pursuit of quantitative to qualitative urban growth (Wang et al., 2020). Moreover, zoning control methods such as demarcation of suburban prime farmlands and urban growth boundary have been introduced to control the weight (Wu et al., 2017; Wang et al., 2022). Nevertheless, the body building, especially for rust belt cities, still lacks effective measures that work to regenerate a variety of underutilized urban lands since their identification, distribution and occurrence remain unclear or inconsistent (Loures and Vaz, 2018). Similar challenges were also spotted for cities in Southeast Asia (Ardiwijaya et al., 2015) or Latin America (Sperandelli et al., 2013).

1.2 Regeneration pattern and mechanism of different underutilized lands

Underutilized land is a broad and elusive concept that can be interpreted as a land resource that is inadequately developed at the current stage (Wang et al., 2021). Underutilized land mainly consists of two parts, the first of which refers to lands that are not utilized to their full capacity or for specific purposes (Lai and Zhang, 2016), while the second describes unutilized lands that have few anthropogenic activities, and can also be depicted as derelict (Hofmann et al., 2012), abandoned (Wang et al., 2021), or vacant (Song et al.., 2020). The range of implications covered by underutilized land may be diverse and controversial. Although the resources of underutilized land are widely considered harmful for the capacity or environment of a city, they have great potential for urban improvement once the transition has been made (Smith et al., 2017; Li et al., 2019). For most developing countries, urban morphology is susceptible to economic growth and mass migration from rural areas. Rapid changes across the urban space make it difficult to resolve waste of land resources in the city given that the subsequent underutilization issues often occur faster than they can be diminished (Ahmad et al., 2020; Korkmaz and Balaban, 2020). Therefore, certain urban areas will face multiple underutilization issues and more complex challenges in attaining a universal and equilibrated development (Kim, 2018). Accordingly, regeneration of such areas with mixed underutilized lands requires pinpointing the mechanism of how underutilized land responds to the factors that confine its own potential or suitability (Newman et al., 2018; Ahmad et al., 2020), and more importantly, how will underutilized lands be characterized by the response of different features to similar ambient conditions.
First, it has been confirmed that regeneration of underutilized land is subject to multiple influencing factors, including ownership (Kim et al., 2020), location (Foo et al., 2013), and land use attributes (Frantál et al., 2015), each of which can exert different influences on whether the land will be regenerated or how it should be developed. For instance, vacant lands are more persistent in adjacent low-income neighborhoods (Foo et al., 2013) but will be easily developed when they are under better stewardship (Gobster et al., 2020b). By identifying the underlying drive forces, policymakers and urban planners can improve the regeneration by rearranging multi-layered urban elements to work in its favor (Foo et al., 2013; Kim, 2018). Determining the aforementioned mechanism relies on the support of location-specific information, which require the regeneration pattern to be measured as opposed to simply observing surveyed statistics of local cases (Frantál et al., 2015; Korkmaz and Balaban, 2020). Second, as underutilized lands can be produced and diminished for different reasons, an environment beneficial for the regeneration of one specific underutilized land may well be detrimental or non-essential for another; one such example, is the parcel size, which has been continually included in previous studies (Kremer et al., 2013; Frantál et al., 2015; López et al., 2021). In such cases, when dealing with arising multi-underutilization issues alongside the urban core-periphery gradients in developing countries, making trade-offs and sorting orders of priority for the regeneration of different underutilized lands are crucial for establishing comprehensive regeneration programs. To achieve this, understanding the discrimination and links between these diversified mechanisms is a research gap that still needs to be bridged.

2 Materials and methods

2.1 The studied area

Changchun City is one of the most representative rust belt cities in Northeast China (Figure 1), and is also known as the oriental Detroit since it was the cradleland of the China First Automobile Works (FAW) corporation and similarly experienced a later economic decline (Kuang and Yan, 2019). The recession of industrial units was accompanied by a certain number of land parcels within the abandoned cities, heavily lowering the efficiency of urban land use. Meanwhile, the rapid urbanization also imposed underutilization issues on periph-eral urban lands. To quantify the spatial distribution of underutilized lands, we conducted an investigation into the underutilized lands in the central urban area (CUA) 3 years ago. To illustrate how, where, and why the previously identified underutilized lands were regenerated, we conducted a sequential investigation into underutilized urban lands using the same identification method. Here, the CUA was defined as a concentrated built-up area surrounding the city core, as determined by visual interpretation. The CUA was further divided by five city loops from the inside out according to the historical development of Changchun City (Figure 1). Outward extending roads and city loops were not regarded as the basis for delineating the CUA.
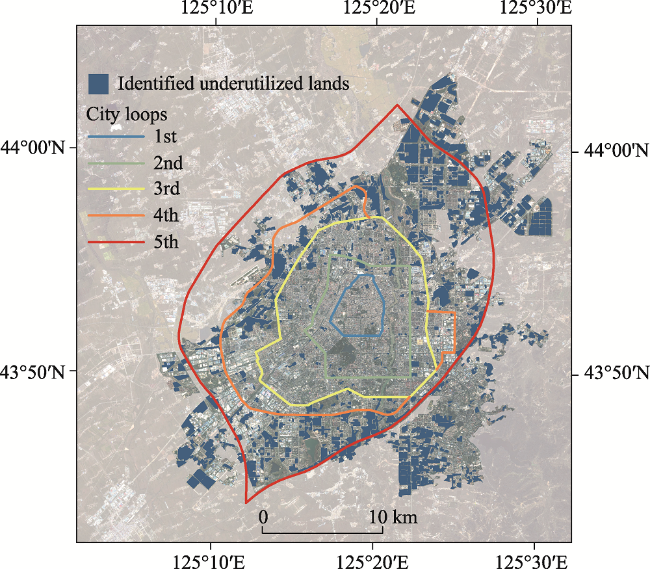
Figure 1 Location of the study area (Changchun City, Northeast China). City loops are circular traffic arteries determined by urban planning.

2.2 Identification of underutilized lands and types of regeneration

In the present study, underutilized land was defined as parcels that were occupied for, but not currently serving urban purposes. The following four categories of underutilized land were included, in line with the previous research work: vacant lot, urban village, abandoned industrial land, and remnant cultivated land (Li et al., 2019). Each of the four categories could be qualitatively identified from high-resolution images and verified via field surveys. Additionally, we used Gaofen satellite images in 2016 and 2019 with the same resolution (1 m) to delineate underutilized land parcels in accordance to their interpretation marks. The delineated parcels were verified twice in the following 2 years. If the field surveys confirm that there has been no sign of ongoing building projects and the parcel remained unchanged, then it was defined as underutilized land. According to the investigation, regeneration of underutilized lands can be broadly classified to five types in terms of the ultimate state of land use, including residential land (RL), industrial land (IL), ecological land (EL), parking lot (PL), and transportation land (TL); the visual changes of which (from images or photos) are displayed in Figure 2.
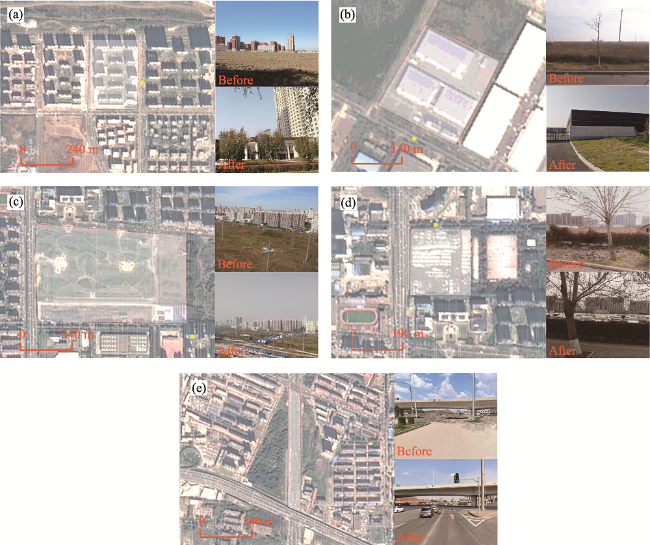
Figure 2 Regeneration types and interpretation marks of underutilized lands in the studied area: (a) regeneration to residential land (RL), (b) regeneration to industrial land (IL), (c) regeneration to ecological land (EL), (d) regeneration to parking lot (PL), and (e) regeneration to transportation land (TL). The photos before conversion were taken during verification in 2017 or 2018, while the photos after conversion were taken in 2020 or 2021.

2.3 Regression analysis method

We performed Classification and Regression Trees (CART) analysis via Rstudio (1.3.1093) with the aim to reveal the regeneration mechanism of underutilized lands. CART analysis is a nonparametric and nonlinearity methodology used to construct tree structured rules, in which a tree is built by splitting the source set, constituting the root nodes of the tree, into subsets (Cabral et al., 2018). Gini Impurity (GI) is introduced to building trees to measure the quality of the split, and is given as,
$GI(D)=1–\text{ }\!\!~\!\!\text{ }\underset{i\text{=1}}{\overset{m}{\mathop \sum }}\,p_{i}^{\text{2}}$
where GI(D) is the Gini Impurity of data set D, which measures how often an element randomly chosen from D would be incorrectly classified in the subset; m is the number of subsets; and pi represents the probability of an item being correctly sorted into the subset i. GI(D) reaches its minimum when all cases in the node fall into a single target category.
We selected two dependent variables in the CART analysis; the regeneration rate was a continuous variable and the regeneration type was a discrete variable. The regression tree was used to identify the major contributing factors that influenced the overall regeneration rate of underutilized lands. The decision tree was applied to classify the factors that contributed to the specific regeneration type. CART analysis was conducted using the rpart package with ANOVA and CLASS. All the selected variable values were synchronized to 3 km × 3 km grids so that the driving mechanism could be analyzed on the same spatial scale.
In consideration of the land administration systems in the rust belt cities of Northeast China, we established a system of explanatory variables that might exert influences on the regeneration of underutilized land. The system comprised four perspectives of influencing factors, including land parcel attributes, site conditions, accessibility to public infrastructures, and urban planning impacts. The explanatory variables were listed in Table 1. All the selected continuous variables, either dependent or explanatory, were processed with normalization prior to CART analysis.
Table 1 Description of explanatory variables used for CART analysis
Category Explanatory variables Description
Attributes of land
parcel
Ave_SIZE, Ave_FRAC, UND_SI, UND_D Ave_SIZE and Ave_FRAC represent the average value of the size and fractal dimension of an individual land parcel within the grid, respectively. UND_SI and UND_D represent the Simpson Index and density of underutilized lands in each grid.
Site conditions COM_D, RES_D, GBS_D, Road_D The density of commercial lands, residential lands, green and blue space, and road networks.
Accessibility to public infrastructures D_BP, D_CR, D_HC, D_H, D_PL, D_PAR, D_SCH Distance to bank and post office, commercial center, hospitals and clinics, hotels, parking lots, parks, and schools.
Urban planning impacts Plan_RES, Plan_PUB, Plan_IND, Plan_GBS Proportion of planned residential area, public infrastructure area, industrial area, and green and blue space, which was derived from the Urban Planning for Changchun City from 2011 to 2020

3 Results and analysis

3.1 Spatiotemporal changes of different underutilized lands

Importantly, Figure 3 shows that the CUA of the studied area slightly expanded on both the northeastern and the southern sides. Clearly, these rapidly growing sites were widely dis-tributed with VLs or parcels that were still being cultivated (Figure 3b). Such underutilization continued to be the most significant issues plaguing the periphery of the selected rust belt city, especially given that the RCL was the only category that experienced an overall increase from 2016 to 2019 (Table 2). When taking the spatial arrangement of city loops as a reference, the amount of underutilized land increased from the inside out on both time nodes, except for the AIL, in which the maximum area was fixed between the second and the third city loops (Figures 3a and 3b). The AIL inside the loops decreased by 48.85 ha in almost all the intervals but had a low contribution to the variations of underutilized lands outside the loops. AIL is the most representable land resource left over by historical rise and decline of industries in rust belt cities, and tends to be distributed in close proximity to the city core. The AILs, UVs and VLs distributed in the inner city appeared to be difficult to eradicate (Table 2), rendering them persistent underutilization lands for rust belt cities. In contrast, the decrease of VLs (-478.27 ha), UVs (-281.13 ha) and RCLs (-220.72 ha) were much more prominent between the fourth and the fifth city loops. Although these parcels were previously underutilized at the periphery, they could also be resolved quickly at the rapidly growing sites. However, the 3-year urban expansion continued to incorporate the surrounding cultivated lands into the CUA, which could be overwhelming for peripheral areas since they were not directly contributing to the industrial or residential urban purposes, but instead forming a reservoir for VLs and RCLs, as illustrated by the substantial growth of RCLs (+1054.64 ha) outside the city loops.
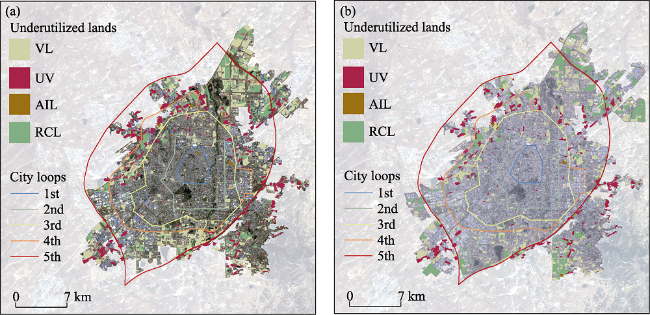
Figure 3 Spatial patterns of underutilized land in the studied area in (a) 2016 and (b) 2019
Table 2 Statistics of underutilized lands in the city loops shown in the studied area from 2016 to 2019 (in ha)
Time Underutilized
lands
City loops In total
Within the 1st 1st-2nd 2nd-3rd 3rd-4th 4th-5th Other areas
2016 VL 1.39 108.45 280.45 547.30 2213.77 1391.13 4542.49
UV 0 4.11 93.20 326.34 887.02 839.12 2149.79
AIL 7.82 1.23 46.79 34.28 13.85 0.00 103.97
RCL 0 0.00 59.55 348.98 1382.75 966.00 2757.28
2019 VL 1.39 74.45 174.36 510.92 1735.50 1311.55 3808.18
UV 0.00 2.39 75.74 229.92 605.89 771.48 1685.42
AIL 0.81 1.23 34.52 18.56 0.00 14.05 69.17
RCL 0.00 0.00 57.78 295.80 1162.03 2020.64 3536.25
Overall, the spatiotemporal changes of different underutilized lands demonstrated that peripheral VLs and RCLs continue to be problematic for rust belt cities with expansion pressure. This is not because these parcels were persistent, on the contrary, they diminished at fairly rapid rate, but because the expansion overestimated possible consumption by urban residents or industries. Meanwhile, certain measures taken by the local government helped to regenerate a large number of underutilized lands within the city loops, especially for VLs and AILs (Table 2), but the inner VLs, UVs and AILs still were noticeable in the core of rust belt cities.

3.2 Regeneration pattern of different underutilized lands in the CUA

During 2016-2019, 42.36% of AILs were being regenerated, among which, the regeneration proportion was the highest despite the total amount being the smallest, followed by VLs and RCLs (Table 3). Although UVs decreased by 464.36 ha, the regeneration rate was only 3.13%; most of the parcels were not actually regenerated, but instead converted to other underutilized lands, highlighting the persistence of UV in the selected rust city. However, the zero growth of UVs also showed that they were mostly carried over from the previous inefficient urbanization process. Recent rapid expansion did not make similar mistakes, instead requiring thorough demolition of incorporated rural settlements. Interestingly, a very small portion of VLs (285.84 ha) and UVs (0.47 ha) were recultivated after the parcels had been incorporated into the CUA for years, although this may be illegitimate given that stringent controls will not allow such reversed land use changes. Additionally, 396.62 ha of UV, 4.81 ha of AIL and 223.12 ha of RCL were converted to VLs (Table 3), accounting for approximately 16% of the total VL in 2019. However, as the land clearing was not accompanied by additional development measures until the time of the survey, the parcels were still cataloged as underutilized lands.
Table 3 Statistics for the regeneration of underutilized lands (in ha)
Underutilized lands Remain underutilized Regenerated
area
Increased
area
Regeneration rate
Unconverted to RCL to VL
VL 2706.08 285.84 - 1550.57 477.54 34.13%
UV 1685.42 0.47 396.62 67.27 0.00 3.13%
AIL 55.12 0 4.81 44.04 14.05 42.36%
RCL 2035.15 0 223.12 499.01 1214.79 18.10%

Note: Conversion from one underutilized land category to another is still deemed as underutilized, and conversions to RCL and VL were the primary internal conversion between underutilized lands in the studied area.

The Sankey diagram below demonstrated that nearly half the VL regeneration could be attributed to the development of realty market, as for the other underutilized lands; this was especially true for AILs given that 84.08% of the total were regenerated as RLs (Figure 4). In this case, conversion for residential purposes dominated the regeneration process of the studied area, with RLs accounting for 48.5% of the total regenerated area (Figure 4). Moreover, 589.49 ha of the total underutilized lands were regenerated as ELs, such as shrubs or little ponds that could either be counted as green or blue spaces for urban residents. The conversion to EL was the second largest outflow for almost all categories of underutilized land, though it primarily depended on the regeneration of VLs in terms of scale. Similarly, the regeneration of UVs and AILs largely involved conversion to RLs and ELs. The scale of conversion to ILs (388.85 ha) was less than half that of the RLs, indicating that the industrial development over the same period was overshadowed by the realty market. Parcels regenerated as TLs or PLs were negligible and relied heavily on the consumption of VLs.
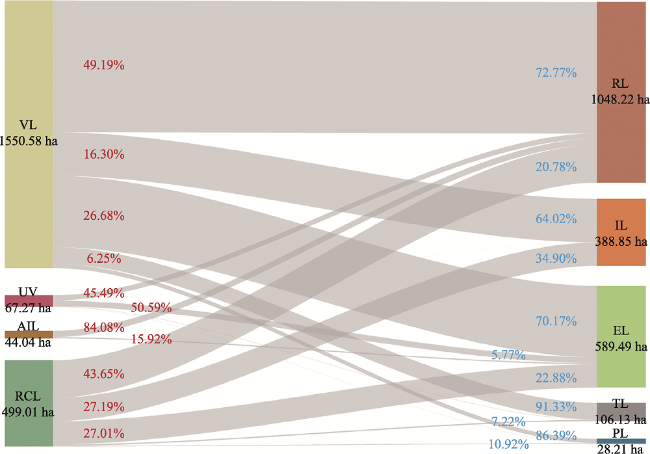
Figure 4 Sankey diagram indicating how the underutilized lands were regenerated. Only proportions over 5% were being labeled.
Spatially, the increase in underutilized lands were mainly clustered around the rapidly expanding sites (Figure 5a), but meanwhile these sites were also provided with higher regeneration probability, which was consistent with the preceding analysis. Initially, conversion to RLs and ELs was closely associated with the urban space, though the distribution of regenerated parcels for EL was more concentrated than that for RL (Figures 5b and 5d). The regeneration patterns for RL and EL conversions illustrated that they not only played a crucial role at the urban periphery, but were also optimal choice for the regeneration of underutilized lands around the city core. However, regenerated parcels for ILs tended to cluster at the rapidly expanding sites (Figure 5c), especially on the northeastern side, which had been planned as a mixed-function zone for residential and industrial development. PLs and TLs seemed to avoid the rapidly expanding sites, and were mostly situated closer to the city core (Figures 5e and 5f). Unfortunately, underutilized lands located in the northwestern and southeastern sides, where urbanization started early on but progressed inefficiently, lack large-scale regeneration during the same period (Figures 5b-5f). Moreover, the rotation angle of Lefever’s Standard Deviational Ellipses (LSDEs) showed that conversion to RL, IL, EL and TL shared similar development directions (Figures 5b, 5c, 5d and 5f), while the regenerated parcels for RL and IL were less concentrated, as exhibited by the Y standard distance of the LSDEs. The LSDEs further revealed that land parcels converted to PL were distributed in the opposite direction to the other underutilized lands, a direction that might incline to the inefficient urbanized areas (Figure 5e).
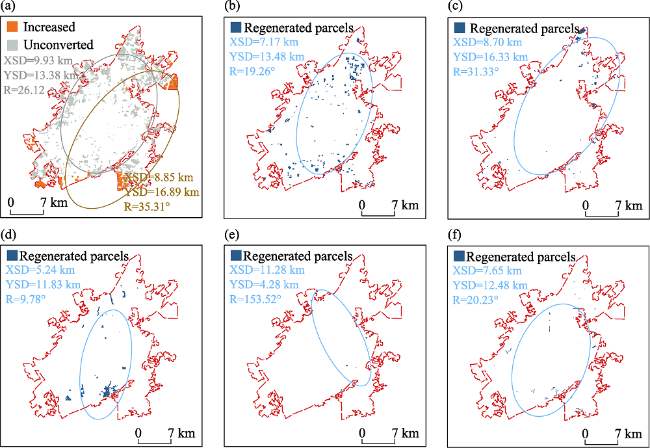
Figure 5 Spatial distribution of regenerated underutilized lands: (a) quantitative changes, (b) regeneration to RL, (c) regeneration to IL, (d) regeneration to EL, (e) regeneration to PL, and (f) regeneration to TL. Lefever’s Standard Deviational Ellipse was applied to illustrate the distributional characteristics of regeneration pattern, with XSD representing the X standard distance, YSD representing the Y standard distance and R representing the rotation angle.

3.3 Determinants underlying the regeneration of underutilized lands

Both the regression tree and the decision tree were provided with a relatively simple structure, as indicated by the TVC (Figure 6). The regression tree of regeneration rate showed good prediction (1-RE>0.6), but the prediction validity of decision tree built to explain the regeneration types was relatively low given that we used only the maximum proportion of the exact underutilized land to determine the regeneration type, which may have adversely affected the prediction validity of the decision tree. The results of CART analysis demonstrated that the density of underutilized lands (UND_D), rather than individual parcel size, primarily influenced whether the underutilized land would be regenerated or not (Figure 6a). Areas characterized by higher UND_D were more readily available in recent years, i.e. the rapidly expanding sites that had been placed with major regeneration projects. The diversity of underutilized land types may also be a crucial factor influencing the regeneration process, with a higher Simpson Index (UND_SI) indicating more complex underutilized land types and a more unfavorable environment for the parcels to be regenerated.
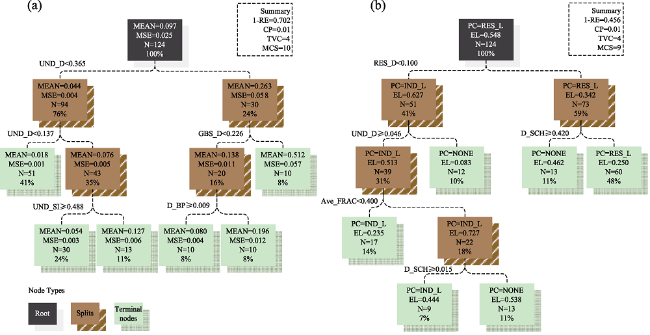
Figure 6 CART analysis results for regeneration scale and types of underutilized land: (a) regression tree of regeneration scale and (b) decision tree of regeneration types. RE: Relative error, 1-RE: Prediction validity of the model, CP: Complexity parameter for total nodes, TVC: Total variable count for a tree, MCS: Minimum count of samples involved at any node, MSE: Mean square error, CP: Complexity parameter for total nodes, N: Number of observations, EL: Expected loss, where a higher EL indicates more mis-classification. NONE in the decision tree indicates the unconverted underutilized type.
Other than the land parcel attributes, the density of green and blue spaces (GBS_D) and the distance to bank and post offices (D_BP) also influenced the regeneration (Figure 6a). The correlation diagram (Figure 7) showed strong positive relationships between almost all of the accessibility indices. As a CART model can be indifferent to the multicollinearity issue and will only include representatives from the variables that are positively correlated, here, D_BP could also be interpreted as better accessibility to public infrastructures. The regeneration of rust belt cities that were confronted with underutilization issues at both the core and periphery, appeared to be heavily reliant on peripheral regeneration programs. A higher density of underutilized lands, more green and blue spaces, and better accessibility to public infrastructures promoted the regeneration potential.
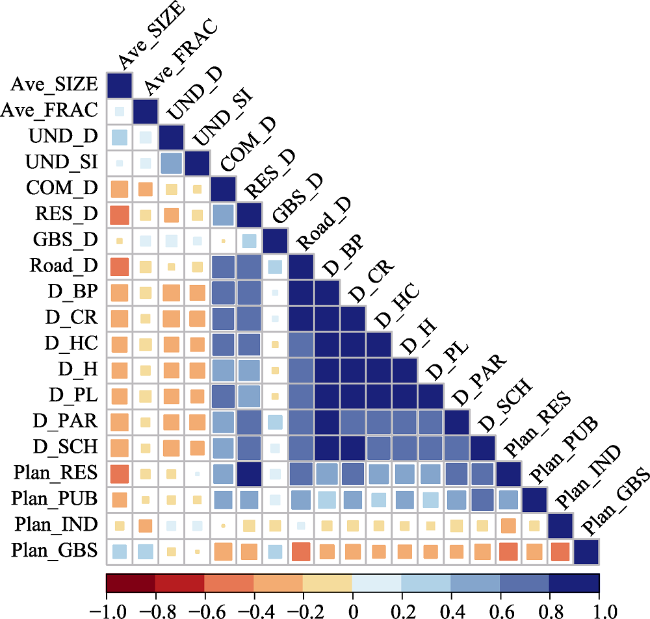
Figure 7 Correlation diagram of selected variables to build the CART model
The results of decision tree analysis suggested that the underutilized lands regenerated as RLs were primarily distributed in areas characterized by higher residential density (RES_D), a factor substituted for population density in the present study, which is consistent with most previous research results. Better accessibility to important public infrastructures such as schools (D_SCH) was also found to fuel the conversion to RLs (Figure 6b). However, the industrialization of underutilized lands was less apparent in areas with higher RES_D and did not appear to require good accessibility to public infrastructures (Figure 6b). Conversions to ILs were more sensitive to a higher UND_D and a more regular parcel shape (Ave_FRAC). Other regeneration types with small-scale regeneration areas were not included in the decision tree, nor were variables associated with urban planning as these could be directly attributed to planning failures given that they were less likely to be replaced with other explanatory variables (Figure 7).

4 Discussion

4.1 Differentiated regeneration patterns of heterogeneous underutilized lands

The urban core is, in many cases, identified as a major area suffering from the loss of urban vitality for traditional rust belt cities (Pottie-Sherman, 2020) and is often associated with problems such as rising crimes and land abandonment (Kremer et al., 2013). However, unlike rust belt cities in developed countries that have undergone a rapid expansion period, most cities in Northeast China represent one typical category that after once losing industries and status were somehow spurred on by the constant developing growth of economy (Xie et al., 2016). A heavy dependence on land finance triggered excessive land speculation, which caused the urban periphery to become another hotspot for land underutilization. According to our previous research, the identified underutilized lands could be broadly classified into three types in terms of their distribution: the long-standing inner lands (VL, AIL and UV), the underdeveloped peripheral lands (AIL and UV) and the newly incorporated lands (VL and RCL) at the rapid expanding sites (Li et al., 2019). The regeneration patterns suggested that the first two types were more persistent, especially for UVs in both regions. Moreover, a high regeneration rate but low increase in the area of AIL suggested that the revitalization measures adopted in the northeast rust belt might have contributed to the regeneration of inner urban space, as expected by the recent urbanization policy-shift (Song et al., 2021). Yet, the regeneration also confirmed that the industrialization process was only slightly encouraged during the revitalization, which explained the lowered the provincial ranking of industrial added value for Northeast China (Wu et al., 2019; Jia et al., 2021). Most importantly, the expansion of peripheral VL and RCL continued to be a priority for the selected city given that they were, according to our monitoring, still increasing despite the receding demand, although such a city is unlikely to seek massive increments of built-up land in the very near future.
Most underutilized lands were developed to RLs and ELs, with only a few being developed to TLs and PLs. The conversion evidenced that previous urbanization policies highlighted the development of realty business, not only prompting the increase in RLs but also their supporting green facilities. Nevertheless, the population outflow put a damper on the realty market, with cities such as Hegang having already experienced a severe price drop (Song et al., 2021; Zheng et al., 2021). Many areas that were planned to be residential remained underutilized or were even recultivated in recent years. This serves as a warning that future approval for RLs should be carefully examined for the fear of speculative markets that might increase underutilized lands at the urban periphery of such rust belt cites. The remaining underutilized parcels within the planned residential area could be partially rearranged to other public services to accommodate the limited population, while also enhancing human well-being.
Furthermore, the total amount of underutilized lands within the CUA decreased during the studied period, which translated into a more compact urban pattern under the policy-shift (Hu et al., 2021; Song et al., 2021). However, the large-scale increase of RCL still reflected the prolonged developing period for peripheral lands, which serves as a warning that the procedures between the approval and the actual supply of land resources should be reduced. Without this improvement, food security would be negatively impacted given that regions where these rust belt cities were located shoulder the responsibility for grain production, such as Des Moines (Olimb and Robinson, 2019), Dnipropetrovsk (Zhukov et al., 2018) and Harbin (Gao et al., 2023), especially considering that most of these parcels were dispensable and more easily caught in a vicious cycle of land degradation (Li et al., 2020). China recently proposed the Territorial Space Plan (TSP), which retired almost all the former land use planning designations, in which a red line between the urban area and its nearby countryside would be delineated to resolve the conflicts between urban growth and cultivated land conservation (Qiao et al., 2020). A lesson learned from previous expansion suggested that this line drawn by the TSP should consider the limited demands by urban residents and the current stocks of underutilized lands, so as to achieve the green transformation of these rust belt cities.

4.2 Policy implication for regulating the regeneration in rust belt cities

Rust belts are former manufacturing heartlands for a country that has experienced a decline in industry, population, and status (Pottie-Sherman, 2020), and cities in these regions are often in need of regeneration to promote social, food and environmental justice (Pettygrove and Ghose, 2018; Song et al.., 2020). Regeneration experience from developed countries demonstrates that knowledge about the underlying determinants is necessary to regulate the regeneration process (Frantál et al., 2015). Meanwhile, it is important to identify the primary threats when dealing with underutilized lands in developing countries (Li et al., 2019; Ahmad et al., 2020). First, unlike the conclusion of previous studies (Lee et al., 2021; López et al., 2021), the results of CART analysis indicated that overall density rather than individual size of underutilized land was more crucial determinant of whether a parcel would be regenerated or not. In which case, peripheral underutilized lands that were more concentrated tended to have greater potential than the inner lands as if there was a cluster effect of the regeneration. Additionally, a less diversified structure and an environment with adequate ecosystem services and accessibility to public infrastructures were also identified as major contributing factors for regenerating underutilized lands. This implied that, if urban planners intended to promote the regeneration of long-standing inner lands or underdeveloped peripheral lands, the local living environment and surrounding supporting facilities would have to be improved prior to the regeneration. Underdeveloped urban peripheries in particular were in demand for such measures because these areas were generally in disrepair (Xie et al., 2016; Li et al., 2019), and comprehensive renewal was considered more applicable.
Our results also proved that general influencing factors associated with underutilized land regeneration, such as distance to the city center or parcel size (Frantál et al., 2015), did not always work in regeneration processes; instead, they had to be linked to the specific locational conditions and the regeneration types. Site conditions like higher residential density and better accessibility to public infrastructures were identified as the key determinants for the conversion to RL. However, the conversion to IL was more sensitive to a higher density of underutilized lands and more regular parcel shape, but not to better accessibility. The disparity in the favorable environment of different types of regeneration illustrates a possible pathway for regulating underutilized lands, which could be achieved by selectively reconstructing urban elements that might be influential. Aside from this, most regeneration studies rarely mentioned commercial centers given that peripheral lands are less attractive and inner lands were often fragmented or too small (Yang et al., 2019; Sun and Yu, 2021), as revealed by the present study.
It seems that the selected factors associated with urban planning failed to play an important role in elevating regeneration rate or contributing to any specific regeneration type. This could be attributed to two main reasons. The first is that the practice of urban planning usually lags behind its own base period; indeed, the urban planning applied in the present study was intended to arrange urban function zones during 2011 and 2020, but it was not approved by the State Council until 2017. The second is that some obligatory targets prescribed by urban planning often conflicts with other plans such as integrated land use planning (Song et al., 2011). The coordination between these plans takes time and effort, and, as a result, will often delay or alter the original decision (Qiao et al., 2020). One such example is the former site of a roller tractor manufacturer that had been abandoned for a dozen years and was mentioned in our previous study (Li et al., 2019). In this case, many theoretical plans had been proposed regarding how to regenerate the land parcel, and the local government had already introduced a regeneration plan to convert it to a cultural museum exhibiting its own developing history. Nevertheless, 3 years later, when we visited the site, there were no signs of regeneration; instead, it had gradually become a renowned photography spot (Figure 8), highlighting the importance of community engagement in promoting the regeneration of underutilized lands (Kim et al., 2020). Hopefully, the emergence of TSP will not only resolve the conflicts between different development purposes but also reinforce the efficiency of planning targets that are associated with city development.
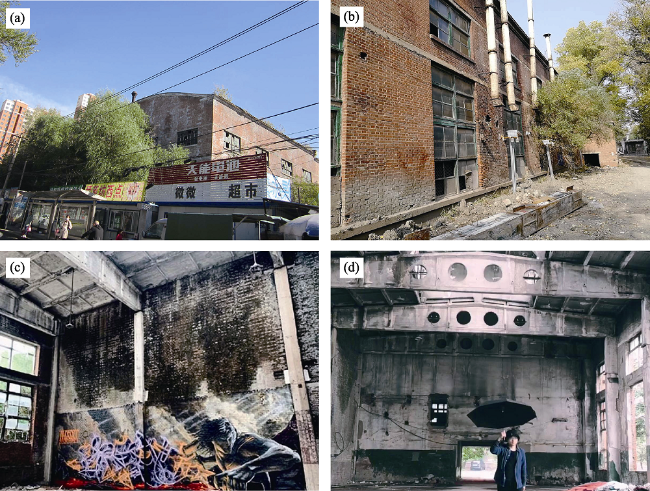
Figure 8 Old site of Changchun Tractor Manufacturing Plant, which remained underutilized in recent years: (a) and (b) were photographs taken by the authors in 2017 and 2020, respectively, while (c) and (d) are photos of interior graffiti taken by a social media influencer collected from the Internet.

5 Conclusions

Regenerating underutilized lands is of crucial significance for achieving Target 11.1 of the Sustainable Development Goals, the aim of which is to ensure access to adequate, safe and affordable housing and basic services to all. In this study, we conducted a sequential investigation to examine the regeneration of underutilized lands in Changchun City, a representative rust belt city in Northeast China confronted with underutilization issues at its core and speculative peripheries.
(1) From 2016-2019, 22.62% of the underutilized lands were being regenerated, while the expanding sites continued to be hotspots for the increase in VLs and RCLs. Even so, the total area of underutilized lands showed a decreasing trend with the recent policy-shift of urban development that valued inner regeneration over outward expansion.
(2) RCLs were the only category experiencing growth, and UVs were identified as the most persistent underutilized lands. Industrial development in this period was overshadowed by realty marketing, and peripheries characterized by inefficient urbanization were found to be the most difficult regions to be regenerated.
(3) Our case confirmed that the density of underutilized land was crucial for determining whether a parcel would be regenerated, while accessibility to ecological services and public infrastructures may have also been influential. Site conditions like residential density and accessibility to public infrastructures were identified as contributing factors for the conversion to RL. However, the conversion to IL was more sensitive to the density and regularity of underutilized land.
The present spatial-statistical analysis reflected the defects in previous management of urban land resources of these declining resource- or industry-based cities in developing countries. First, excessive occupation of land resources threatened intensive land use in urban areas and the grain production in their nearby countryside. Second, it is difficult to reconcile similar targets shared by different planning, and late implementation is often fatal to regeneration purposes. Third, the extent of community participation may be underestimated for such cities since it has previously shown promising prospects in facilitating the regeneration of underutilized urban areas. We believe that the connections between population demand and land supply, between different planning associated with city development, and between policy makers and stakeholders need to be rebuilt in order to achieve the green transition of rust belt cities in developing countries.
[1]
Abe S, Nakagawa D, Matsunaka R et al., 2014. Study on the factors to transform underused land focusing on the influence of railway stations in central areas of Japanese local cities. Land Use Policy, 41(11): 344-356.

DOI

[2]
Ahmad N, Zhu, Y M, Lin H L et al., 2020. Mapping the obstacles to brownfield redevelopment adoption in developing economies: Pakistani perspective. Land Use Policy, 91(2): 104374.

[3]
Ardiwijaya V S, Sumardi T P, Suganda E et al., 2015. Rejuvenating idle land to sustainable urban form: Case study of Bandung metropolitan area, Indonesia. Procedia Environmental Sciences, 28(6): 176-184.

DOI

[4]
Arribas-Bel D, Gerrits M, 2015. From manufacturing belt, to rust belt, to college country: A visual narrative of US urban growth. Environmental Planning A, 47(6): 1241-1253.

[5]
Bai Y P, Deng X Z, Jiang S J et al., 2018. Exploring the relationship between urbanization and urban eco-efficiency: Evidence from prefecture-level cities in China. Journal of Cleaner Production, 195(27): 1487-1496.

DOI

[6]
Cabral A I R, Silva S, Silva P C et al., 2018. Burned area estimations derived from Landsat ETM+ and OLI data: Comparing genetic programming with maximum likelihood and classification and regression trees. ISPRS Journal of Photogrammetry and Remote Sensing, 142(8): 94-105.

DOI

[7]
Chen M X, Ye C, Lu D D et al., 2019. Cognition and construction of the theoretical connotations of new urbanization with Chinese characteristics. Journal of Geographical Sciences, 29(10): 1681-1698.

DOI

[8]
Foo K, Martin D, Wool C et al., 2013. The production of urban vacant land: relational placemaking in Boston, MA neighborhoods. Cities, 30(5): 156-163.

[9]
Foster A, Newell J P, 2019. Detroit's lines of desire: Footpaths and vacant land in the Motor City. Landscape and Urban Planning, 189(9): 260-273.

DOI

[10]
Frantál B, Greer-Wootten B, Klusáček P et al., 2015, Exploring spatial patterns of urban brownfields regeneration: The case of Brno, Czech Republic. Cities, 44 (4): 9-18.

DOI

[11]
Fu J P, Xiao G R, Wu C Y, 2020. Urban green transformation in northeast China: A comparative study with Jiangsu, Zhejiang and Guangdong provinces. Journal of Cleaner Production, 273(32): 122551.

[12]
Gao J B, Liu L L, Guo L H et al., 2023. The effects of climate change and phenological variation on agricultural production and its risk pattern in the black soil area of northeast China Journal of Geographical Sciences, 33(1): 37-58.

DOI

[13]
Gobster P H, Hadavi S, Rigolon A et al., 2020a. Measuring landscape change, lot by lot: Greening activity in response to a vacant land reuse program. Landscape and Urban Planning, 196(4): 103729.

[14]
Gobster P H, Rigolon A, Hadavi S et al., 2020b. The condition-care scale: A practical approach to monitoring progress in vacant lot stewardship programs. Landscape and Urban Planning, 203(11): 103885.

[15]
Hofmann M, Westermann J R, Kowarik I et al., 2012. Perceptions of parks and urban derelict land by landscape planners and residents. Urban Forestry and Urban Greening, 11(3): 303-312.

DOI

[16]
Hu Y K, Wang Z Y, Deng T T, 2021. Expansion in the shrinking cities: Does place-based policy help to curb urban shrinkage in China? Cities, 113(6): 103188.

[17]
Jia R N, Fan M T, Shao S et al., 2021. Urbanization and haze-governance performance: Evidence from China’s 248 cities. Journal of Environmental Management, 288(13):112436.

[18]
Jiang L W, O’Neill B C, 2017. Global urbanization projections for the shared socioeconomic pathways. Global Environmental Change, 42(1): 193-199.

DOI

[19]
Kim G, 2018. An integrated system of urban green infrastructure on different types of vacant land to provide multiple benefits for local communities. Sustainable Cities and Society, 36(1): 116-130.

DOI

[20]
Kim G, Newman G, Jiang B, 2020. Urban regeneration: Community engagement process for vacant land in declining cities. Cities, 102(7): 102730.

[21]
Kobayashi T, Ikaruga S, 2016. Occurrence factors of large vacant lots in central districts and their utilization by local governments in Japan. Frontiers of Architectural Research, 5(4): 393-402.

DOI

[22]
Korkmaz C, Balaban O, 2020. Sustainability of urban regeneration in Turkey: Assessing the performance of the North Ankara Urban Regeneration Project. Habitat International, 95(1): 102081.

[23]
Koroso N H, Zevenbergen J A, Lengoiboni M, 2020. Urban land use efficiency in Ethiopia: An assessment of urban land use sustainability in Addis Ababa. Land Use Policy, 99(10): 105081.

[24]
Kremer P, Mcphearson T, Hamstead Zoé A, 2013. A social-ecological assessment of vacant lots in New York City. Landscape and Urban Planning, 120(12): 218-233.

[25]
Kuang W H, Yan, F Q. 2019. Urban structural evolution over a century in Changchun city, Northeast China. Journal of Geographical Sciences, 28(12): 1877-1895.

[26]
Lai Y N, Zhang X L, 2016. Redevelopment of industrial sites in the Chinese ‘villages in the city’: An empirical study of Shenzhen. Journal of Cleaner Production, 134(30): 70-77.

DOI

[27]
Lee R J, 2021. Vacant land, flood exposure, and urbanization: Examining land cover change in the Dallas-Fort Worth metro area. Landscape and Urban Planning, 209(5): 104047.

[28]
Li W B, Wang D Y, Li H et al., 2019. Quantifying the spatial arrangement of underutilized land in a rapidly urbanized rust belt city: The case of Changchun city. Land Use Policy, 83(4): 113-123.

DOI

[29]
Li W B, Wang D Y, Li Y F et al., 2020. A multi-faceted, location-specific assessment of land degradation threats to peri-urban agriculture at a traditional grain base in northeastern China. Journal of Environmental Management, 271(19): 111000.

[30]
Liu S W, Zhang P Y, Wang Z Y et al., 2016. Measuring the sustainable urbanization potential of cities in Northeast China. Journal of Geographical Sciences, 26(5): 549-567.

DOI

[31]
Liu Y, Wang X R, Jia J et al., 2021. Distribution, bioaccessibility, and health risk assessment of heavy metals in PM2.5 and PM10 during winter heating periods in five types of cities in Northeast China. Ecotoxicology and Environmental Safety, 214(8): 112071.

[32]
Liu Z, Wang S Y, Wang F, 2019. Isolated or integrated? Planning and management of urban renewal for historic areas in Old Beijing city, based on the association network system. Habitat International, 93(11): 102049.

[33]
Loures L, Vaz E, 2018. Exploring expert perception towards brownfield redevelopment benefits according to their typology. Habitat International, 72(2): 66-76.

DOI

[34]
López J I M, Kim G, Lei Y et al., 2021. An assessment method and typology for the regeneration of vacant land in Quito, Ecuador. Urban Forestry and Urban Greening, 62(6): 127130.

[35]
Newman G, Park Y, Bowman A O M et al., 2018. Vacant urban areas: Causes and interconnected factors. Cities, 72 (1): 421-429.

DOI

[36]
Olimba S K, Robinson B, 2019. Grass to grain: Probabilistic modeling of agricultural conversion in the North American Great Plains. Ecological Indicators, 102(8): 237-245.

DOI

[37]
Pettygrove M, Ghose R, 2018. From “Rust Belt” to “Fresh Coast”: Remaking the city through food justice and urban agriculture. Annals of the American Association of Geographers, 108(2): 591-603.

DOI

[38]
Pottie-Sherman Y, 2020. Rust and reinvention: Im/migration and urban change in the American Rust Belt. Geography Compass, 14(3): e12482.

[39]
Qiao W F, Hu Y, Jia K Y et al., 2020. Dynamic modes and ecological effects of salt field utilization in the Weifang coastal area, China: Implications for territorial spatial planning. Land Use Policy, 99(10): 104952.

[40]
Smith J P, Li X X, Turner B L, 2017. Lots for greening: Identification of metropolitan vacant land and its potential use for cooling and agriculture in Phoenix, AZ, USA. Applied Geography, 85(8): 139-151.

DOI

[41]
Song G L, Li Z, Zhang L, 2011. Institutional design for strategic environmental assessment on urban economic and social development planning in China. Environmental Impact Assessment Review, 31(6): 582-586.

DOI

[42]
Song X Q, Wen M M, Shen Y J et al., 2020. Urban vacant land in growing urbanization: An international review. Journal of Geographical Sciences, 30(4): 669-687.

DOI

[43]
Song Y, Zhu D L, Yeung G et al., 2021. Spatio-temporal evolution and driving mechanism of urban land use structure with the context of urban shrinkage: Evidence from Northeast China. Geographical Research, 40(5): 1387-1403. (in Chinese)

DOI

[44]
Sperandelli D I, Dupas F A, Pons N A D, 2013. Dynamics of urban sprawl, vacant land, and green spaces on the metropolitan fringe of São Paulo, Brazil. Journal of Urban Planning and Development-ASCE, 139(4): 274-279.

DOI

[45]
Sun S, Yu Y, 2021. Dimension and formation of placeness of commercial public space in city center: A case study of Deji Plaza in Nanjing. Frontiers of Architectural Research, 10(2): 229-239.

DOI

[46]
Tong Y, Liu W, Li C G et al., 2021. Understanding patterns and multilevel influencing factors of small town shrinkage in Northeast China. Sustainable Cities and Society, 68(5): 102811.

[47]
Wang S J, Cui Z T, Lin J J et al., 2022. The coupling relationship between urbanization and ecological resilience in the Pearl River Delta. Journal of Geographical Sciences, 32(1): 44-64.

DOI

[48]
Wang Y, Gao S D, Li N et al., 2021. Crowdsourcing the perceived urban built environment via social media: The case of underutilized land. Advanced Engineering Informatics, 50(4): 101371.

[49]
Wang Z F, Xu X M, Wang H et al., 2020. Does land reserve system improve quality of urbanization? Evidence from China. Habitat International, 106(12): 102291.

[50]
Wei J B, Na Z, Cheng Q G et al., 2020. Simulation and evaluation of the spatial heterogeneity of shallow-groundwater environmental risk in an urban-rural fringe of megacity: A case study of Shenyang city, Northeast China. Environmental Earth Science, 79(11): 250.

DOI

[51]
Wu X W, Wang L, Zheng H L, 2019. A network effect on the decoupling of industrial waste gas emissions and industrial added value: A case study of China. Journal of Cleaner Production, 234(29): 1338-1350.

DOI

[52]
Wu Y Z, Shan L P, Guo Z et al., 2017. Cultivated land protection policies in China facing 2030: Dynamic balance system versus basic farmland zoning. Habitat International, 69(11): 126-138.

DOI

[53]
Xi X S, Xu H Y, Zhao Q et al., 2021. Making rural micro-regeneration strategies based on resident perceptions and preferences for traditional village conservation and development: The case of Huangshan village, China. Land, 10(7): 718.

DOI

[54]
Xie L, Yang Z S, Cai J M et al., 2016. Harbin: A rust belt city revival from its strategic position. Cities, 58(9): 26-38.

DOI

[55]
Yang T R, Pan H Z, Hewings G et al., 2019. Understanding urban sub-centers with heterogeneity in agglomeration economies: Where do emerging commercial establishments locate? Cities, 86(3): 25-36.

DOI

[56]
Yang X D, Bai Y P, Che L et al., 2021. Incorporating ecological constraints into urban growth boundaries: A case study of ecologically fragile areas in the Upper Yellow River. Ecological Indicators, 124(5): 107436.

[57]
Yi P T, Li W W, Zhang D N, 2021. Sustainability assessment and key factors identification of first-tier cities in China. Journal of Cleaner Production, 281(5): 125369.

[58]
Yu J H, Li J M, Zhang W Z, 2020. Identification and classification of resource-based cities in China. Journal of Geographical Sciences, 29(8): 1300-1314.

DOI

[59]
Zhao Y Q, An N, Chen H L et al., 2021. Politics of urban renewal: An anatomy of the conflicting discourses on the renovation of China’s urban village. Cities, 111(4): 103075.

[60]
Zheng X, Chen X T, Yuan Z Q, 2021. Exploring the spatial spillover effect of home purchase restrictions on residential land prices based on the difference-in-differences approach: Evidence from 195 Chinese cities. Land Use Policy, 102(3): 105236.

[61]
Zhukov O V, Pelina T O, Demchuk O M et al., 2018. Agroecological and agroeconomic aspects of the grain and grain legumes (pulses) yield dynamic within the Dnipropetrovsk region (period 1966-2016). Biosystem Diversity, 26(2): 170-176.

DOI

Outlines

/