Research Articles

Spatio-temporal differences and influencing factors of carbon emission equity in the Loess Plateau based on major function-oriented zones

  • SONG Yongyong , 1 ,
  • XIA Siyou , 2, 3, * ,
  • XUE Dongqian 1 ,
  • MA Beibei 1 ,
  • LIU Xianfeng 1
Expand
  • 1. School of Geography and Tourism, Shaanxi Normal University, Xi’an 710119, China
  • 2. Key Laboratory of Regional Sustainable Development Modeling, Institute of Geographic Sciences and Natural Resources Research, CAS, Beijing 100101, China
  • 3. College of Resources and Environment, University of Chinese Academy of Sciences, Beijing 100049, China
*Xia Siyou (1991-), PhD, specialized in energy geography and sustainable development. E-mail:

Song Yongyong (1990-), PhD and Associate Professor, specialized in regional geography and sustainable development. E-mail:

Received date: 2022-06-29

  Accepted date: 2023-03-03

  Online published: 2023-06-26

Supported by

National Natural Science Foundation of China(42001251)

The Fundamental Research Funds for the Central Universities(GK202201008)

Abstract

In this paper, we firstly constructed a theoretical framework based on major function-oriented zones (MFOZs). Then taking the Loess Plateau (LP) as the study area, we revealed the spatio-temporal differences and influencing factors of carbon emission equity by using the carbon equity model, Theil index, and Geo-detector. The results showed that: (1) From 2000 to 2017, the carbon equity of the Loess Plateau showed a downward trend, but the ecological carbon equity remained above 2.3, which was significantly higher than the economic carbon equity. (2) The ecological carbon equity in the Loess Plateau increased from the core of urban agglomeration to the periphery. The spatial pattern of economic carbon equity changed from low in the northeast and high in the southwest to low in the north and high in the south. The ecological support coefficient and economic contribution coefficient of provincial capital cities and their surrounding districts remained low since 2000. (3) The equity of carbon emissions in each function-oriented zone in the Loess Plateau was compatible with its orientation. The ecological carbon equity of the key ecological functional zones (KEFZs) was significantly higher than that of the key development zones (KDZs) and the major agricultural production zones (MAPZs), while the economic carbon equity of the KDZs was significantly higher than that of the MAPZs and the KEFZs. (4) The formation and evolution of the spatial differentiation pattern of carbon equity in the Loess Plateau was the result of the long-term interaction effects of geographic location, social economy, science and technology level, and policy system. Among them, eco-environmental protection policy, government financial support, and geographical location are the key driving factors for the spatial pattern of ecological carbon equity. Geographical location, social economic level, and science and technology level are the key factors driving the spatial pattern of economic carbon equity. According to this study, to achieving carbon equity on the Loess Plateau region, what the key approaches are to fully implement the planning of MFOZs, design differentiated regional carbon compensation mechanisms, improve energy efficiency and ecological environment capacity, and build a collaborative regional carbon emission governance system. This research can not only provide an effective framework for analysing the carbon equity, but also offer policy implication for promoting carbon emission reduction and achieving high-quality development goals in the ecologically fragile areas.

Cite this article

SONG Yongyong , XIA Siyou , XUE Dongqian , MA Beibei , LIU Xianfeng . Spatio-temporal differences and influencing factors of carbon emission equity in the Loess Plateau based on major function-oriented zones[J]. Journal of Geographical Sciences, 2023 , 33(6) : 1245 -1270 . DOI: 10.1007/s11442-023-2128-4

1 Introduction

With the continuous growth in urbanization and industrialization, carbon emissions continue to increase, and the resulting environmental problems have attracted the attention of governments and scholars (Wang et al., 2020; Hong et al., 2021). To control total global carbon emissions, a series of measures have been taken to manage and limit these emissions. In this context, the allocation of carbon emission rights or the setting of total carbon emission control targets have become the focus of international controversy, and the fairness of carbon emissions has become an important topic in academic research (Zhang et al., 2011; Kornek et al., 2021). Because of differences in population, economic development, and resource endowment, there are considerable differences in total carbon emissions and per capita carbon emissions among countries (Bruckner et al., 2022). When the total carbon emissions are limited, the difference in carbon emissions between carbon emitters may be solidified, which can lead to unfairness (Kornek et al., 2021; Yu et al., 2022). Therefore, increasingly limited carbon emissions and the accurate assessment of the unfairness of carbon emissions and reasonable allocation of emission rights have become a scientific problem. At the same time, accurately depicting the spatio-temporal differentiation of carbon equity and scientifically revealing the impact mechanism of carbon equity will not only contribute to the effective regional cooperation in carbon emission reduction, but also be of great significance in promoting regional low-carbon and high-quality development.
The early research on carbon emissions equity by scholars mainly focused on the international level, paying attention to the assessment and analysis of carbon emissions equity between different countries and regions. The research was aimed at providing a scientific basis for allocation of international carbon emissions rights (Pye et al., 2020; Budolfson et al., 2021; Soest et al., 2021; Hong et al., 2022). With the gradual deepening of research, the intergenerational and interpersonal equity of carbon emissions, especially the equity of carbon emissions among different income groups, have attracted the attention of scholars (Pan, 2019; Pozo et al., 2020; Yang et al., 2020). China is the world’s largest carbon emitter. Studies have shown evident unfairness in carbon emissions among the eastern, central, and western regions, and both regional and per capita emissions showed a step-like decreasing pattern across these regions (Tan et al., 2008; Peng et al., 2022). As a typical representation of regional differences, the difference in carbon emission equity between urban and rural areas in China has also become the focus of academic research (Yao et al., 2011; Zhang et al., 2011; Liu and Zhang, 2022). For example, Yao et al. (2011) showed that the carbon emissions of urban residents in China account for 76.44% of the total carbon emissions of residents, and the unfairness of urban and rural carbon emissions is evident. Zhang et al. (2011) also pointed out that there is a significant difference in carbon emissions generated by household energy consumption between urban and rural residents in China, which further proves the unfairness of carbon emissions between urban and rural areas.
In addition, the study of carbon emissions from the perspective of efficiency and equity is a topic of great concern (Wang et al., 2016; Wang et al., 2019; Zhou et al., 2019). Inefficient use of energy may strengthen the unfairness of carbon emissions. If the causes of unfairness in carbon emissions are ignored, it may lead to greater difficulty in regulating and controlling total emissions. The existing research methods on carbon emission equity are becoming more diverse, with the Gini coefficient (Pan et al., 2014; Yang and Yang, 2020), Theil index (Cui et al., 2022; Yang et al., 2022) and Kakwani index (Clarke-Sather et al., 2011; Ma et al., 2019) being widely used in the study of carbon emission equity. The research scale focuses on global, national and regional carbon emission equity. China is a vast territory, and the implementation of a top-down carbon emission reduction strategy must consider regional differences. As a basic unit of China’s administrative divisions, a county is a combination of macro-policy formulation and micro-policy implementation (Song et al., 2021). Research on the equity of carbon emissions at the county level is essential to identify the heterogeneity of carbon emission reduction strategies and implement these at national scale. Although some scholars have discussed the issue of county-scale carbon equity (Zhao et al., 2014), most of them are based on cross-sectional data for analyzing carbon emission equity. Therefore, it is critical to strengthen the research on long-term time series of carbon emission equity by downscaling the basic research unit to the county scale.
As an important tool of national spatial governance, the major function-oriented zoning divides national land into three types according to regional function: urbanized zones, major agricultural production zones, and key ecological functional zones (Fan, 2015). It clarifies the main functions of various functional zones in the division of national land and constructs a reasonable spatial logic to describe regional development. This is particularly important to the building of a harmonious regional system in terms of the man-environment relationship (Fan, 2015; Fan and Guo, 2021). The Loess Plateau is a strategic base for energy security and is an integral part of the strategic pattern of ecological security in China. Since the implementation of the Western development strategy, the region has witnessed rapid social and economic development, remarkable achievements in ecological environment construction, and remarkable improvement in the living conditions of residents. It has become the focus area for the implementation of major national strategies such as national MFOZs, ecological civilization, new urbanization, and rural revitalization. Following the promulgation of Major Function-oriented Zone Planning (MFOZP) by the State Council in 2010, provinces (regions) in the Loess Plateau implemented the zoning successively, aiming to promote resource conservation and environmental protection and achieve higher quality development. However, the land development intensity, functional orientation, and development direction of different MFOZs are significantly different, which may aggravate the imbalance between economic development and ecological protection among MFOZs, resulting in spatial combination differences of carbon sources and sinks in functional zones, thus affecting the fairness of regional carbon emissions (Wen et al., 2015; Li et al., 2019; Xia et al., 2022). Therefore, in the context of promoting regional ecological protection and high-quality development, the analysis of the spatio-temporal differentiation and influencing factors of carbon equity based on the MFOZs has important practical significance. The analysis should help toward realizing coordinated carbon emission reduction in functional zones, thus meeting the major strategic needs of the country by serving the “double carbon” goal and achieving high-quality development.
Given above, selecting the Loess Plateau as the study area, and using the carbon equity model, the Theil index and Geo-detector, we revealed the spatio-temporal differences and influencing factors of carbon emission equity at the regional and functional zone scales from 2000 to 2017. This study aims to: (1) clarify the rules of spatio-temporal changes of carbon equity in the Loess Plateau before and after the implementation of the MFOZP; (2) identify the influencing factors and differences of carbon equity in the Loess Plateau and its functional zones; (3) reveal the evolution mechanism of the spatio-temporal pattern of carbon equity in the Loess Plateau and its functional zones. The results can provide scientific support for constructing low-carbon development policies and realizing the “double carbon” goals according to local conditions in the Loess Plateau, China.

2 Theoretical framework

The basic component unit of the MFOZs division is the county-level administrative region, which can be divided into three types according to the development content: key development zone, major agricultural production zone and key ecological functional zone. To scientifically reveal the regional carbon equity differentiation pattern and formation mechanism under the framework of the MFOZs, it is necessary to take into account the changes of carbon equity in the three scales of the overall region, county level and functional zone, and in the two stages before and after the implementation of the MFOZP. Therefore, from the perspective of MFOZs, this paper constructed a theoretical analysis framework of carbon equity of “dimension + pattern + zone + factor” from four aspects of carbon equity dimension, spatial pattern, function-oriented zones and influencing factors (Figure 1). Based on the analysis of the spatio-temporal differentiation of carbon equity in the Loess Plateau and its functional zones, this study explored the influencing factors and formation mechanisms of carbon equity in combination with geographical location, social economy, science and technology level, and the policy system.
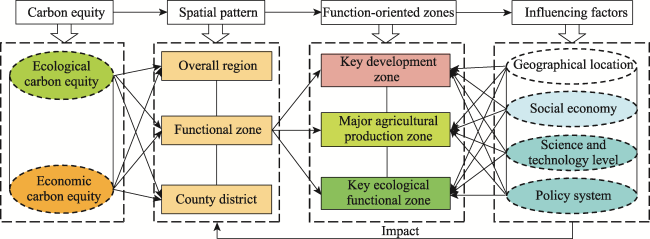
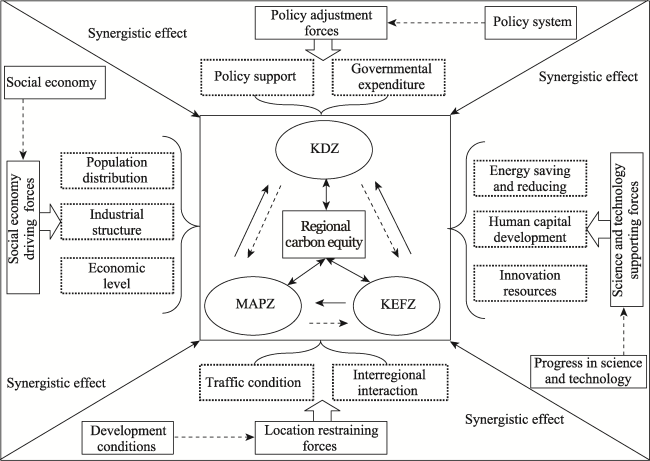
Figure 1 Theoretical analysis framework of carbon equity and its influencing factors based on the MFOZs
First, in setting carbon emission reduction targets, the fairness of carbon emission allocations is especially important. Carbon equity usually means that the allocation of limited carbon emission space should reflect fairness, using the allocation difference as the base (Teng et al., 2010; Liu and Zhang, 2022), which is mainly reflected in ecological and economic carbon equity. Ecological carbon equity is based on the amount of carbon absorbed by the main carbon sinks of each administrative unit, which means that a certain amount of carbon emitted by an administrative unit needs to be balanced by a certain amount of carbon absorption. From an ecological point of view, assuming average carbon emissions, if the proportion of carbon emissions in a region is greater than the contribution rate of its major carbon sinks to carbon absorption so that other regions bear the ecological and environmental impact caused by excess carbon emissions, it will infringe on the interests of other regions and lead to unfair emissions or ecological carbon inequity. The economic carbon equity is based on the GDP of each administrative unit; this implies that a certain proportion of carbon emissions in an administrative unit needs to contribute to the corresponding proportion of GDP. From an economic point of view, assuming that carbon emissions are absolutely average, if the proportion of carbon emissions in a region is greater than the contribution rate of GDP, the economic contribution capacity of carbon emissions is relatively low, and carbon emissions will occupy the interests of other regions, resulting in unfair carbon emissions or economic carbon inequity (Lu et al., 2012; Xia et al., 2022).
Second, the MFOZP is the principle of national land development and protection, and the differences in the carrying capacity of resources and environment, functional orientation, and development direction of various functional zones have a far-reaching impact on regional carbon equity. KDZs bear the responsibility of population agglomeration and urban and industrial development, producing higher economic benefits but resulting in high carbon emissions and thus greater negative externalities to the ecological environment. MAPZs and KEFZs have significant positive external impact on the ecological environment, although the protection of their ecological functions will inevitably mean forgoing development opportunities, which may disadvantage certain interest groups (Li et al., 2019; Xia et al., 2022). In addition, carbon equity is comprehensive; it is affected by the significant differences in geographical location, social economy, scientific and technological levels, and policy orientation of the KDZs, the MAPZs, and the KEFZs. This will inevitably lead to differences in carbon equity among these MFOZs. Therefore, the scientific analysis of the spatial and temporal differentiation and influencing factors of carbon equity in these zones is critical for promoting coordinated low-carbon development.
It should be noted that the core of carbon equity in this study is to explore the spatial allocation process of ecological capacity and economic development caused by carbon emissions, with the aim of building a cross-regional carbon compensation mechanism to achieve coordinated emission reduction and fair development among regions. The different development orientations of each functional zone will inevitably lead to a difference in carbon equity. Identifying the spatial and temporal differentiation and influencing factors of this equity is the key to building a low-carbon development strategy and achieving regionally coordinated carbon emission reduction and high-quality development. Guidance can then be provided for determining the horizontal carbon compensation relationship and its compensation flow; this is also a new field to highlight and enhance the value of China’s geography in the process of achieving the country’s “double carbon” goal.

3 Materials and methods

3.1 Study area

The Loess Plateau is located in the transition zone (107°E-114°E, 32°N-41°N) between a humid area in eastern China and an arid area in northwest China. The entire region covers Shanxi, Ningxia, and parts of Qinghai, Gansu, Shaanxi, Henan, and Inner Mongolia, encompassing KDZs, MAPZs, and KEFZs. The total land area is 64.87 × 10⁴ km2 (Figure 2), accounting for 6.76% of the country’s total area. The altitude is approximately 500-3000 m, and macroscopic landforms, such as plains, hills, plateaus, and mountains, are widely distributed. The area is mainly located in a temperate continental monsoon climate zone, with an annual average temperature of 9-12℃ and an annual precipitation of 200-700 mm. In 2017, the GDP of the region was 7602.6 billion yuan, the ratio of three industrial structures (primary, secondary and tertiary industries) was 6.5:48.3:45.2, the total population was 136 million, the per capita GDP was 55,901 yuan/person, the urbanization rate was 55.6%, the built-up area was approximately 4335.22 km2, and the carbon emissions reached 1.346 billion tons. The region is an important national ecological security barrier and energy security base, as well as a vital area for ecological protection and high-quality development in the Yellow River basin; thus, it plays an important role in implementing the major function-oriented zone strategy and supporting the realization of the “double carbon” goal.
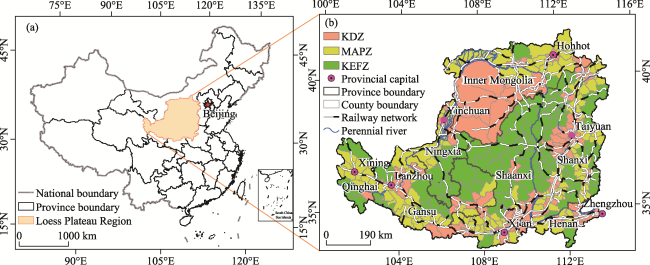
Figure 2 Geographical Location (a) and major function-oriented zones (b) in the Chinese Loess Plateau. The Chinese map is made based on the standard map with the approval number GS(2019)1698 downloaded from the standard map serves website of the National Administration of Surveying, mapping and Geoinformation, with the base map no modified. Loess Plateau, LP; Key development zones, KDZs; Major agricultural production zones, MAPZs; Key ecological functional zones, KEFZs.

3.2 Data sources

Carbon emissions and carbon sequestration in this study were based on scientific data (Chen et al., 2020). The social and economic data were drawn from the 2001-2018 China County Statistical Yearbook, the fifth and sixth census data, and sample survey data, as well as statistical bulletins on the national economic and social development of the counties and districts in the Loess Plateau. To eliminate the impact of inflation and other price factors on economic output, this study used the conversion of per capita GDP, the proportional contribution of secondary industry to GDP, and government expenditure at constant prices in 2000.
The MFOZs data were obtained from the MFOZP of each province and region in the Loess Plateau. Considering the integrity of administrative divisions and statistical data, the 341 selected county units covered 132 KDZs, 107 MAPZs, and 102 KEFZs.
Land use data were obtained from the Data Center for Resources and Environmental Sciences, Chinese Academy of Sciences (http://www.resdc.cn), with a spatial resolution of 30 m × 30 m. The eco-environment protection policy mainly included the conversion of farmland to forest (grassland) project, key protection forest construction projects and natural forest protection projects. The indicator value was determined according to the implementation time of the above policies, the counties and districts covered, and the area of forest and grassland restoration (Chen et al., 2019); the administrative boundary data and traffic network data of the Loess Plateau are from the National Center for Fundamental Geographic Information (http://ngcc.sbsm.gov.cn).

3.3 Methods

3.3.1 Indicator selection

Geographical location is a key factor affecting carbon emissions (Jiang et al., 2021). The change in economic geographical location has an important impact on the scale and direction of resource flows, thereby affecting regional carbon equity. Therefore, this study used the minimum driving time to central cities to reflect the geographical location factor.
Population is an important driving force of carbon emissions (O’ Neill et al., 2012; Zheng et al., 2020; Wang et al., 2021), affecting regional carbon emissions through production, consumption, and spatial mobility (Li et al., 2010; Zheng et al., 2020; Wang et al., 2021). Compared with commonly used indicators such as population size, population structure, and urbanization rate, population density can better depict the impact of population change on carbon emissions and regional differences under the background of rapid urbanization. We thus chose population density to reflect the impact of population factors on carbon equity.
National affluence directly affects production and consumption patterns, which, in turn, affects regional development and carbon emission intensity (Su et al., 2018), resulting in the choice of per capita GDP to reflect the level of regional affluence affecting carbon equity. In addition, because the Loess Plateau is rich in energy resources, secondary industries dominated by resource development have long occupied a dominant position, and changes in industrial structure, energy efficiency, and energy-saving and consumption-reducing technologies are important factors affecting regional carbon equity (Huang et al., 2016; Su et al., 2018). Therefore, we chose the proportional contribution of secondary industry to GDP and the energy consumption of ten-thousand-yuan GDP to analyze the impact of industrial structure and technological progress on carbon equity.
At the same time, human capital is still the primary factor that impacts economic transformation and the improvement of energy saving and emission reduction efficiency; particularly, the use of new technologies and processes, the generation of new concepts, and the production of appropriate policies need high-quality scientific and technological skills (Liu et al., 2022). For this reason, the study used per capita education level to reflect the impact of scientific and technological skills on carbon equity.
In addition, the Loess Plateau is the implementation area of major ecological protection projects and policies such as returning farmland to forests (or grasslands); the rehabilitation of the ecological environment will directly affect the regional carbon sink function. The ecological environment protection policy is closely related to the government’s fiscal revenue; therefore, the county’s forest and grass restoration after the implementation of ecological projects, such as returning farmland to forests (grasslands) and the general public expenditure of the government reflects the impact of eco-environmental protection policies on carbon equity (Chen et al., 2019).
To sum up, following the principles of scientificity, systematicness, and operability, with a comprehensive consideration of the actual situation of carbon emission equity in the Loess Plateau, we selected 8 indicators from 4 fields: geographical location, social economy, science and technology level, and the policy system. And we used the 8 indicators to analyze the influencing factors and formation mechanism of spatio-temporal differentiation of carbon equity in the Loess Plateau (Table 1).
Table 1 Influencing factors of the spatio-temporal carbon equity in the Loess Plateau
Fields Indicators Units Codes
Geographical location Minimum driving time to central cities minutes X1
Social economy Population density person per km2 X2
Per capita GDP yuan per person X3
Government expenditure 104 yuan X4
Contribution of secondary industry to GDP % X5
Science and technology level Energy consumption per ten-thousand-yuan GDP Ton standard coal/104 yuan X6
Per capita education level year X7
Policy system Eco-environment protection policy X8

3.3.2 Ecological carbon equity model

Based on the analysis of the theoretical framework and referring to the research of Lu et al. (2012), the ecological support coefficient (ESC) was used to measure the ecological equity of carbon. The calculation formula is as follows:
$ESC=\frac{C{{A}_{i}}}{CA}/\frac{{{C}_{i}}}{C}$
where CAi and CA are the carbon absorption of each county and the entire region, respectively, Ci and C are the carbon emissions of each county and the entire region, respectively. If ESC > 1, it indicates that the contribution rate of carbon emissions of a county is lower than the contribution rate of carbon sinks to carbon absorption, which indicates that it has relatively high carbon ecological capacity and contributes to the absorption of carbon emissions from other counties; on the contrary, if ESC < 1, it indicates that the contribution rate of carbon emissions in a county is higher than the contribution rate of carbon sinks to carbon absorption, indicating that it has a relatively low carbon ecological capacity. Because the ecological effects of carbon emissions are externalities, the ecological and environmental impacts of carbon emissions are shared by other counties, thus infringing on their interests.

3.3.3 Economic carbon equity model

Based on the analysis of the theoretical framework combined with the research of Lu et al. (2012), the economic contribution coefficient (ECC) was used to measure the economic carbon equity. The calculation formula is as follows:
$ECC=\frac{{{G}_{i}}}{G}/\frac{{{C}_{i}}}{C}$
where Gi and G are the GDP of each county and the entire district, respectively, and Ci and C are the carbon emissions of each county and the entire district, respectively. If ECC > 1, it indicates that the contribution rate of carbon emissions is lower than the economic contribution rate, indicating that a county has higher economic and energy efficiency, whereas if ECC < 1, it indicates that the contribution rate of carbon emissions is higher than the economic contribution rate, indicating that a county has lower economic and energy efficiency, which infringes on the interests of other counties. The larger the ECC, the lower the carbon emission cost of the same economic output value of the county and the higher the carbon emission equity; otherwise, the higher the carbon emission cost of the same economic output value of the county and the lower the carbon emissions equity.

3.3.4 Theil index

The Theil index was used to analyze the regional differences of carbon equity in the Loess Plateau. The calculation formula is listed below (Xie et al., 2015):
$Theil=\sum\nolimits_{i=1}^{n}{{{T}_{i}}}\ln \left( n{{T}_{i}} \right)={{T}_{WR}}+{{T}_{BR}}$
${{T}_{WR}}=\sum\nolimits_{i=1}^{{{n}_{d}}}{{{T}_{i}}}\ln \left( {{n}_{d}}\frac{{{T}_{i}}}{{{T}_{d}}} \right)+\sum\nolimits_{i=1}^{{{n}_{z}}}{{{T}_{i}}\ln \left( {{n}_{z}}\frac{{{T}_{i}}}{{{T}_{z}}} \right)}+\sum\nolimits_{i=1}^{{{n}_{x}}}{{{T}_{i}}\ln \left( {{n}_{x}}\frac{{{T}_{i}}}{{{T}_{dx}}} \right)}$
${{T}_{BR}}={{T}_{d}}\ln \left( {{T}_{d}}\frac{n}{{{n}_{d}}} \right)+{{T}_{z}}\ln \left( {{T}_{z}}\frac{n}{{{n}_{z}}} \right)+{{T}_{x}}\ln \left( {{T}_{x}}\frac{n}{{{n}_{x}}} \right)$
where TWR is the difference in carbon equity within functional zones; TBR is the difference in carbon equity between functional zones; n is the number of counties; nd, nz and nx are the number of counties in KDZs, MAPZs, and KEFZs, respectively; Ti is the ratio of the carbon ESC or carbon ECC of county i to the regional average level; Td, Tz and Tx are the ratios of carbon ESC or carbon ECC of the three MFOZs to the average regional level, respectively.

3.3.5 Geo-detector

Geo-detector is a statistical tool to identify the driving force of the spatial differentiation of natural and human phenomena on the earth’s surface (Wang et al., 2017). In this study, we chose the module of factor detection and interactive detection to determine the dominant factors of the spatial pattern of carbon equity in the Loess Plateau and to reveal the formation mechanism of the spatial and temporal differentiation of carbon equity. The calculation formula is as follows:
$q=1-\frac{1}{N{{\sigma }^{2}}}\sum\limits_{h=1}^{L}{{{N}_{h}}\sigma _{h}^{2}}$
where q is the decisive index of the change in the spatial differentiation pattern of carbon equity, q∈[0,1], and the larger the value of q, the greater the influence of influencing factor X on the spatial differentiation pattern of carbon equity Y; h = 1, …, L is the classification number of each impact factor X; Nh and N are the number of counties of type h and the total number of counties, respectively; and σh and $\sigma _{h}^{2}$ are the variances of carbon equity Y values of type h and counties, respectively.

4 Spatio-temporal changes of carbon equity in the Loess Plateau

This study first analyzed the spatio-temporal changes of ecological carbon equity and economic carbon equity in the Loess Plateau from 2000 to 2017 and then explored the change characteristics of ecological and economic carbon equity in KDZs, MAPZs, and KEFZs of the Loess Plateau before and after the implementation of the MFOZP (taking 2010 as the demarcation point).

4.1 Spatio-temporal changes of ecological carbon equity

From 2000 to 2017, the carbon ESC of the Loess Plateau fluctuated from 3.01 to 2.30 (Figure 3), and ecological carbon equity showed a downward trend. The carbon ESC decreased from 3.01 to 2.58 before 2010 and from 2.45 to 2.30 from 2011 to 2017, indicating that ecological carbon equity in the Loess Plateau moved from rapid decline to stabilization.
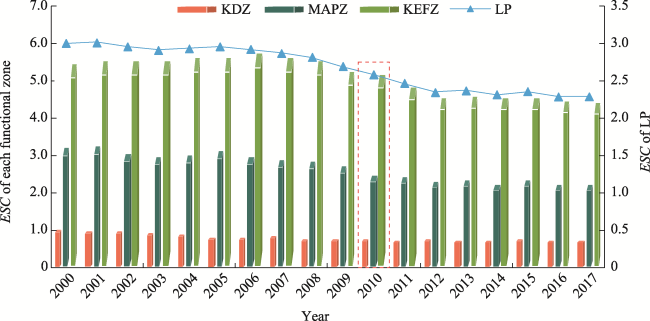
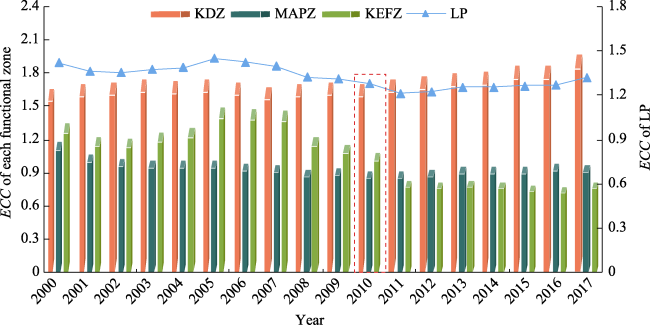
Figure 3 Changes of ecological carbon equity in the Loess Plateau from 2000 to 2017
The county ecological carbon equity in the Loess Plateau showed a spatial differentiation pattern with urban agglomeration as the core and increasing to the periphery (Figure 4). In 2000, there were 162 counties whose carbon ESC was less than 1. The carbon ESC of Beilin District, Lianhu District in Xi’an City and Datong City was close to 0, and the ecological carbon equity was low. These counties are mainly located in rapid urbanization areas or energy and mineral resource development zones, with concentrated population and high intensity development. Such development not only occupies ecological space, but also produces high carbon emissions, which is an important cause of ecological carbon inequity. The ESC of carbon emissions in the other 179 counties is greater than 1, especially in Huanglong and Yichuan counties of Yan’an City, and Linyou County of Baoji City; for these locations, the ESC of carbon emissions reached 62.42, 34.22 and 42.59, respectively, showing high ecological carbon equity. These counties and districts are the primary implementation areas of ecological projects such as returning farmland to forests and grasslands, with abundant carbon sink resources and large ecological carbon capacity. Compared with 2000, the ecological carbon equity decreased significantly in 2010, especially the counties with carbon ESC less than 0.5 increased significantly. The carbon ESC of Zhangxian County in Dingxi City, Otog Front Banner and Uxin Banner in Ordos City decreased most significantly, with a decrease of 20.21, 15.16 and 13.80, respectively, over 10 years. The ecological destruction and environmental pollution in the Loess Plateau were serious from 2000 to 2010, with the carbon sink capacity being significantly reduced. The extensive economic development model led to a significant increase in carbon emissions, resulting in a decline in ecological carbon equity. In 2017, the ecological carbon equity was improved, and the number of counties and districts with carbon ESC greater than 1 reached 183. Since 2010, the ability of the Loess Plateau to meet the needs of regional and national carbon sinks has been significantly enhanced, and the ecological carbon equity has been significantly improved. It is worth noting that the carbon ESC of the urban agglomerations on the Guanzhong Plain and in Central Shanxi, Hohhot-Baotou-Ordos-Yulin, and Ningxia along the Yellow River and the Lanzhou-Xining urban agglomeration areas, as well as the provincial capital cities and their surrounding counties and districts, is generally less than 1, indicating that in these areas, there may be disorderly development in the process of urban development. The occupation of ecological space and high carbon emissions in the process of urbanization lead to the low level of ecological carbon equity.
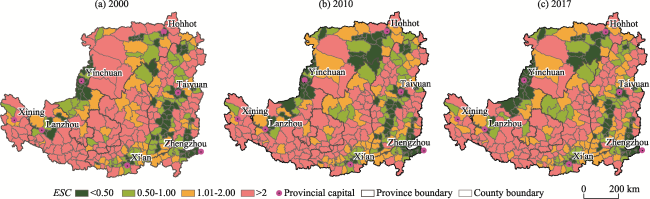
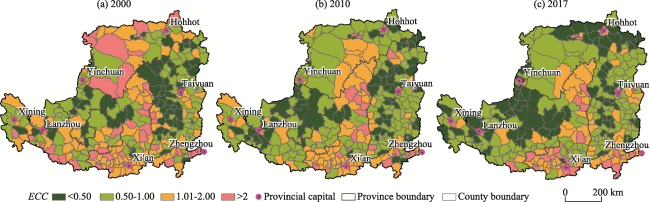
Figure 4 Spatial distribution of ecological carbon equity in the Loess Plateau from 2000 to 2017
In terms of ecological carbon equity in functional zones, from 2000 to 2017, the carbon ESC of the KDZs, MAPZs, and KEFZs in the Loess Plateau showed a downward trend (Figure 3). From 2000 to 2010, the carbon ESC of the three functional zones decreased significantly; since 2010, it has remained relatively stable. The main reason is that before the implementation of MFOZP, the three types of functional zones, especially urban expansion and the development of energy and mineral resources in KDZs, occupied considerable ecological and farmland production space, resulting in the decline of the regional carbon sink function. Once MFOZP became a national strategy, the major functional orientation of the counties and districts in the Loess Plateau has been strengthened, the carbon sink function of the regional ecosystem has continuously improved, and the ecological carbon equity of each functional zone has been consolidated. In addition, during the study period, the ecological carbon equity always maintained the order of KEFZs > MAPZs > KDZs. The KEFZs have a low development degree, lower carbon emissions, and abundant carbon sink resources; thus, the ecological carbon equity is maintained at the highest level. The MAPZs have large areas of grain and vegetable cultivation, a larger retention of woodland in the fields, a higher vegetation cover and a larger carbon sequestration; for these reasons, their ecological carbon equity is second only to that of the KEFZs. The KDZs have high-intensity of land space development, large-scale urbanization and industrialization activities occupy large areas of green ecological space; thus, the total carbon emissions are high, resulting in a long-term carbon ESC of less than 1, indicating this is the main area of ecological carbon unfairness in the Loess Plateau.

4.2 Spatio-temporal changes of economic carbon equity

From 2000 to 2017, the carbon ECC in the Loess Plateau was small, fluctuating between 1.42 and 1.32 (Figure 5), indicating that the economic carbon equity in the region was low and showed a downward trend. From 2000 to 2010, the carbon ECC showed a trend of first rising and then declining, with economic carbon equity increasing steadily after 2010.
Figure 5 Changes of economic carbon equity in the Loess Plateau from 2000 to 2017
The spatial pattern of county economic carbon equity in the Loess Plateau has changed from “low in the northeast and high in the southwest” to “high in the south and low in the north”, with the central and southern regions as the high value areas and the eastern and western sides as the low value areas, which were developed and strengthened in an inverted “T” shape (Figure 6). In 2000, there were 179 counties whose economic carbon equity was less than 1, mainly distributed in the mineral energy resource-rich areas and emerging development zones of Shanxi, Shaanxi, Inner Mongolia, Ningxia and Gansu. The carbon ECC of Fugu County, Datong City and Hongsibao District of Wuzhong City was close to 0. Fugu County and Datong City were typical energy rich areas. Secondary industry, dominated by the exploitation of mineral and energy resources has occupied a dominant position for considerable period; thus, the efficiency of energy utilization is low. Hongsibao District is an ecological migration development zone in Ningxia, with a weak economic foundation, extensive utilization of resources, and low fairness in economic carbon equity. The carbon ECC of the other 162 counties is greater than 1. The carbon ECC of Yichuan County of Yan’an City, Beilin and Xincheng districts of Xi’an City are as high as 33.93, 12.73 and 11.36, respectively, indicating that the economic carbon equity is relatively high. Through the development of eco-tourism, high-tech industries and modern service industries, these counties and districts have achieved the transformation and upgrading of industrial structure, so the economic carbon equity is generally high. In 2010, the number of counties with a carbon ECC less than 1 increased to 208. Chengguan District of Lanzhou City, Hangjin Banner of Ordos City, and Kangle County of Linxia City decreased the most, with a decrease of 3.98, 2.97 and 2.55, respectively, over 10 years, indicating that the unfairness of the economic carbon has increased significantly. The total economic volume of these counties and districts is small, the primary characteristics of industrial structure are obvious, and the return on investment of production factors is low. In the process of promoting resource development and undertaking industrial transfer from coastal areas, homogeneous competition is intensifying, and the carbon cost of economic development is increasing. In 2017, the equity of the economic carbon in the Loess Plateau continued to decline, with 213 counties and districts presenting a carbon ECC of less than 1. The carbon ECC of Kundulun District in Baotou City and Datong County in Datong City was close to 0, with the lowest energy efficiency. These counties and districts are typical resource-exhausted cities, whose economic development relies too much on resources and resource-based industries, and whose economic transformation and development are slow. It is worth noting that the equity of the economic carbon in provincial capitals and their surrounding counties is generally low (except Xi’an), indicating that the economic development mode of these counties is extensive, the economic contribution rate of carbon emissions is low, and the inequity of the economic carbon is prominent.
Figure 6 Spatial distribution of economic carbon equity in the Loess Plateau from 2000 to 2017
From 2000 to 2010, the economic carbon equity in the three MFOZs generally showed a downward trend (Figure 5), with the carbon ECC of KDZs being maintained at approximately 1.7. The carbon ECC of MAPZs decreased from 1.18 in 2000 to 0.92 in 2010. The carbon ECC of KEFZs increased from 1.35 in 2000 to 1.49 in 2005, before decreasing sharply to 1.09 in 2010. Since 2010, the economic carbon equity in MAPZs and KEFZs has generally stabilized, compared with the equity of the economic carbon in KDZs which has steadily increased. This indicates that after the implementation of the MFOZP, the overall economic carbon equity of each functional zone shows an encouraging trend. It should be noted that since 2005, the carbon ECC of the MAPZs has been lower than 1 for a long time, which is closely related to the fact that, after the exemption of agricultural tax and the increase of agricultural subsidies in 2005, the intensity of agricultural input and farmland reclamation increased significantly in the short term, but the level of regional agricultural science and technology and the efficiency of resource utilization remain low. From 2000 to 2010, the economic carbon equity in KEFZs first increased and then decreased. The reason is that a large number of mineral resource-rich areas and poverty-stricken counties are located in KEFZs. Since 2000, the development of mineral energy resources and the construction of energy and heavy chemical industry bases (such as Shenfu Coal Mine) have boosted the rapid development of the county economy. At the same time, the deepening of national poverty alleviation programs and expansion of development has changed the development conditions of poor counties and districts, and promoted the economic carbon equity. With high energy consumption, and high emission polluting industries, the carbon cost per unit of economic output has increased significantly, and the equity of the economic carbon has declined. In addition, the economic carbon equity in KDZs was significantly higher than that in MAPZs and KEFZs. However, after the implementation of MFOZP, the ranking of economic carbon equity in the three MFOZs has changed from KDZs > KEFZs > MAPZs to KDZs > MAPZs > KEFZs. This indicates that, with the advancement of agricultural and rural modernization, the economic and energy utilization efficiency of the MAPZs have been gradually increasing compared with those of the KEFZs.

4.3 Regional differences of carbon equity

From 2000 to 2017, the Theil index of ecological carbon equity and economic carbon equity in the Loess Plateau decreased from 0.94 and 0.42 to 0.75 and 0.33, respectively (Figure 7), indicating that the regional differences in carbon equity in the Loess Plateau generally showed a narrowing trend. Among them, the differences within functional zones and the overall differences in ecological carbon equity were consistent, and the differences within functional zones and between functional zones tended to be stable after 2010 (Figure 7a). From the perspective of the three MFOZs, the regional differences of ecological carbon equity in KEFZs showed a trend of first rising, then falling, before stabilizing. At the same time, the ecological carbon equity in KDZs and MAPZs showed a trend of first falling and then stabilizing, mainly because from 2000 to 2005 there was a focus on the implementation of ecological restoration projects, such as returning farmland to forests and grasslands. Influenced by differentiated eco-environmental protection policies, regional differences in ecological carbon equity in KEFZs indicated an expanding trend. After implementation of the MFOZP in 2010, the differences in ecological carbon equity in each functional zone narrowed and tended to stabilize, indicating that with the implementation of MFOZP, the development orientation of each functional zone became clearer, with the regional differences in ecological carbon equity in each functional zone showing a stable evolution trend.
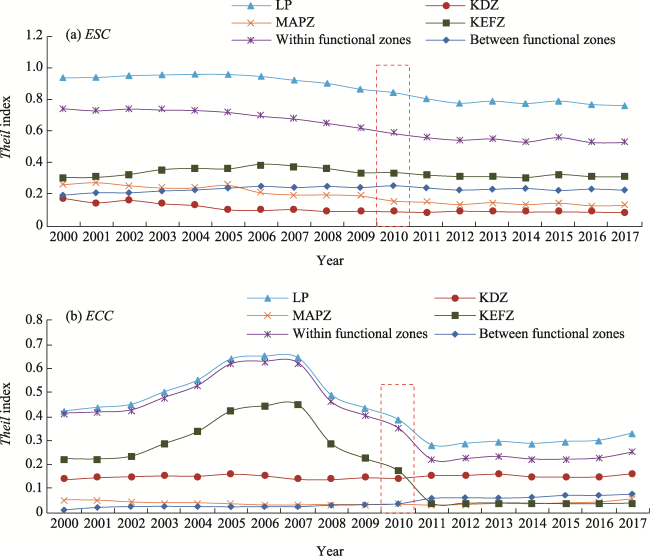
Figure 7 Changes of Theil index of carbon equity in the Loess Plateau from 2000 to 2017
The differences within the functional zones, KEFZs and the overall regional differences in economic carbon equity are essentially the same, showing a trend of first rising followed by a rapid decline and then stabilization (Figure 7b). In 2007, the Theil index reached its maximum value, and the Theil indices of the functional zones, KEFZs and the overall regions were 0.62, 0.45 and 0.65, respectively. Moreover, from 2000 to 2010, the Theil index of KEFZs was significantly higher than that of KDZs and MAPZs, indicating that the regional differences of economic carbon equity in KEFZs were greater than those in KDZs and MAPZs before the implementation of MFOZP. The main reason is that 2000-2008 was a period of rapid development in regional industrialization and urbanization, and this development mode of economic growth at the cost of resources and the environment resulted in a widening gap in the contribution of the regional economic carbon. Since the international financial crisis in 2008, the pressures of the regional economic downturn and industrial overcapacity had gradually increased, especially in resource-based cities, where economic development was slowing down and the transformation of industrial structure was difficult. In 2010, the state-implemented MFOZP scientifically guided the flow of resource elements and controlled the intensity of regional development, promoting sustainable development of the social economy and the orderly spatial development of land in the entire region and in each functional zone, gradually narrowing and stabilizing regional differences in the regional economic carbon equity.

5 Influencing factors of carbon equity pattern in the Loess Plateau

5.1 Influencing factors of carbon equity overall pattern

The key driving factors for the formation of the spatial pattern of carbon equity in the Loess Plateau from 2000 to 2017 were analyzed based on Geo-detector (Figure 8). The results showed that carbon equity in the Loess Plateau was affected by multiple factors such as geographical location, social economy, scientific and technological levels, and the policy system, and the impact of these factors on the spatial pattern of carbon equity was significantly different.
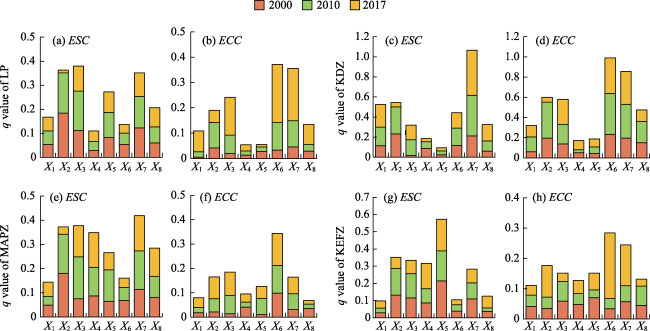
Figure 8 Contribution rates of influencing factors of carbon equity spatial differentiation pattern in the Loess Plateau
The influence of population density and GDP per capita on ecological carbon equity was significantly higher than that of other factors. The ecological environment is fragile in the Loess Plateau, the combination of population density, population growth and economic development had a severe impact on ecosystems and profoundly affected the spatial pattern of ecological carbon equity. During the study period, the impacts of eco-environmental protection policy, general government expenditure and the minimum driving time to central cities on ecological carbon equity continued to increase, especially after 2010. The impacts of population density and energy consumption per ten-thousand-yuan GDP on ecological carbon equity continued to decrease, while the impacts of population density and per capita GDP decreased most after 2010 (Figure 8a). This indicated that the ecological environment protection policy, government financial support and the change of geographical location were the main driving factors for the formation and evolution of the spatial pattern of regional ecological carbon equity. The reason was that ecological restoration and environmental governance in the Loess Plateau were closely related to the government’s macro-policy control, and the key to consolidating the achievements of ecological construction lay in the sustained financial support of the government, as well as the rational flow of resource elements between regions. Following the implementation of the MFOZP, state and local governments have strengthened the policy and system control over the regional development intensity. Increasing the intensity of financial transfer payments and investment in infrastructure construction has provided important support for improving the regional ecological carbon equity pattern.
The energy consumption of ten-thousand-yuan GDP and per capita education level played a significantly higher role in economic carbon equity than other factors, and the minimum driving time to central cities, per capita GDP, and government expenditure continued to increase, while the impact of the proportional contribution of secondary industry on GDP continued to decrease. In addition, the effect of population density first increased and then decreased (Figure 8b). The factors influencing the spatial pattern of economic carbon equity in the Loess Plateau are thus complex, and the influence of location conditions, economic levels, and scientific and technological levels will exist in the long run, especially after the implementation of MFOZP. The role of scientific and technological progress in the regional economic carbon equity pattern was particularly prominent. This is because the economic development of the Loess Plateau region mainly depends on the development of energy and mineral resources, and the energy consumption per unit of economic output of the county has been at a high level for a long time. At the same time, China’s poor population tends to be concentrated in the Loess Plateau region, the shortage of human capital has restricted the transformation and upgrading of the regional economy. Before the implementation of MFOZP, geographical location, regional affluence, and scientific and technological levels played a significant role in the spatial pattern of the economic carbon equity. Since MFOZP implementation, the driving force of economic growth relying on resource inputs was obviously insufficient, and structural contradictions were constantly emerging. Scientific and technological progress and innovative resources played an increasingly prominent role in the transformation and upgrading of regional industrial structures, the transformation of new and old kinetic energy, and high-quality economic development, and have become the key driving factors affecting the spatial pattern of regional economic carbon equity.

5.2 Influencing factors of carbon equity pattern in different functional zones

The factors influencing ecological carbon equity in different functional zones of the Loess Plateau were significantly different. The impacts of geographical location factors, per capita education level, and eco-environmental protection policies on the ecological carbon equity of KDZs continued to increase (Figure 8c), whereas the impacts of government expenditure and eco-environmental protection policies on the ecological carbon equity of MAPZs gradually increased (Figure 8e), while the effects of various factors in KEFZs had obvious differences before and after the implementation of MFOZP (Figure 8g). Before the implementation of MFOZP, in order to pursue higher economic benefits, the inefficient use of resources at the expense of the environment and the lack of sound spatial land planning were common phenomena in the Loess Plateau. Consequently both economic development and population distribution profoundly affected the ecological carbon equity of the three MFOZs. After the implementation of MFOZP, the role of eco-environmental protection policies in KDZs and MAPZs has been significantly enhanced, while the impact of population distribution has been significantly weakened. In KEFZs, the minimum driving time to central cities, government expenditure, the proportional contribution of secondary industry to GDP, and the intensity of the role of ecological environment protection policies has experienced a process of decline and then rise. Government expenditure in particular had the greatest impact on the ecological carbon equity of KEFZs. The results showed that government expenditure was the key driving force for the spatial pattern of ecological carbon equity in KEFZs, which was closely related to the government’s expansion of financial transfer payments after the implementation of MFOZP.
In KDZs, the impact of per capita GDP and the contribution of secondary industry to GDP on economic carbon equity continued to increase (Figure 8d), and the impact of the minimum driving time to central cities, population density, per capita GDP, energy consumption per ten-thousand-yuan GDP, and per capita education level on economic carbon equity in the MAPZs continued to increase (Figure 8f). The effect of population density and energy consumption of ten-thousand-yuan GDP on the economic carbon equity in KEFZs was gradually strengthened (Figure 8h). Before and after the implementation of MFOZP, the impact of geographical location, population distribution, scientific and technological levels, and ecological environment protection policy factors on the economic carbon equity of KDZs showed a trend of first increasing and then decreasing, whereas the impact of government expenditure on the economic carbon equity of the MAPZs and KEFZs showed a trend of first decreasing and then increasing. It is thus evident that, after the implementation of MFOZP, government expenditure has become the principal driving factor for the formation of the spatial pattern of economic carbon equity in the MAPZs and KEFZs. In particular, government expenditure in KEFZs has increased significantly since 2010. The impacts of population distribution and economic level on the economic carbon equity in the MAPZs have increased significantly, which indicated that regional affluence and population agglomeration patterns have become important factors affecting economic development and energy efficiency in MAPZs.

5.3 Spatio-temporal differentiation mechanism of carbon equity

The spatial variation pattern of carbon equity in the Loess Plateau was not the result of a single factor but of the interaction of multiple factors, including two-factor enhancement and nonlinear enhancement, but mainly of a non-linear enhancement effect (Table 2). From 2000 to 2017, the interaction between population density and per capita GDP on the Plateau had a higher impact on ecological and economic carbon equity than the interaction between other factors; the interaction between population density and other factors had an especially prominent impact on ecological carbon equity. Population density reflects the impact of population distribution and human activity intensity on the spatial differentiation pattern of carbon equity. In the ecologically fragile Loess Plateau region, population mobility or population size changes play a significant role in socio-economic development and ecological environment change, which may not only lead to more spatially optimal allocation and agglomeration of production factors, but also enhance the vitality of economic development. The fluctuations in population density and distribution may result in the expansion or reduction of ecological space, thereby affecting the carbon sink function of the ecosystems. It is worth noting that since 2010, the interaction intensity of the contribution of secondary industry to GDP, per capita education level, and ecological environment protection policy on the pattern of ecological carbon equity has increased significantly, and the interaction intensity of per capita GDP, contribution of secondary industry to GDP, and ecological environment protection policy on the pattern of economic carbon equity has gradually increased. This indicates that the interaction between eco-environmental protection policies and other factors has a synergistic effect on the spatial patterns of carbon equity in the Loess Plateau.
Before and after the implementation of MFOZP, there were great differences in the impact of the interaction of various factors on the carbon equity of the Loess Plateau and each functional zone. Before the implementation of MFOZP, the interaction between population density and other factors had a dominant influence on the ecological and economic carbon equity. After the implementation of MFOZP, the interaction between the contribution of secondary industry to GDP and other factors had a significant synergistic effect on ecological and economic carbon equity. In the KDZs, social and economic development was active, the resource elements were fast flowing, and the interaction among various factors was relatively complex. The spatial pattern of ecological carbon equity in the KDZs was formed by the interaction of various factors and the level of science and technology, while the spatial pattern of economic carbon equity was formed by the interaction of geographical location, economic level and other factors. The MAPZs had a special ecological environment foundation and social and economic structure, and the interaction of scientific and technological level and policy system factors had a strong impact on the spatial pattern of ecological and economic carbon equity, which indicated that the synergy enhancement of scientific and technological progress and the eco-environment protection policy affected the spatial pattern of carbon equity in the MAPZs. The ecosystems in KEFZs were fragile, social and economic development lagged behind, population distribution and economic level and other factors affected the spatial pattern of ecological carbon equity, while the interaction of scientific and technological level and policy system and other factors had a strong impact on the spatial pattern of economic carbon equity. The results showed that the spatial pattern of economic carbon equity in KEFZs is influenced by the synergy between policy and other factors.
Table 2 Interaction factors and their changes of carbon equity spatial pattern in the Loess Plateau
Year LP KDZ MAPZ KEFZ
ESC ECC ESC ECC ESC ECC ESC ECC
2000 X2X3 (0.410) X2X3 (0.141) X1X4 (0.531) X2X4 (0.553) X5X8 (0.669) X6X8 (0.334) X2X5
(0.527)
X6X8
(0.471)
X2X5
(0.357)
X7X8
(0.138)
X3X6 (0.489) X4X7
(0.526)
X2X7
(0.485)
X4X8
(0.313)
X3X8
(0.436)
X1X4
(0.390)
X2X6
(0.291)
X4X7
(0.125)
X2X4
(0.461)
X1X4
(0.467)
X1X4
(0.411)
X2X3
(0.311)
X2X3
(0.421)
X4X3
(0.344)
X5X7
(0.276)
X6X8
(0.121)
X6X7 (0.386) X3X5
(0.466)
X2X4
(0.398)
X4X6
(0.307)
X1X2
(0.416)
X5X8
(0.332)
X2X4
(0.275)
X3X5
(0.116)
X2X3
(0.376)
X7X8
(0.393)
X2X6
(0.382)
X2X8
(0.299)
X5X7
(0.412)
X2X3
(0.332)
2010 X2X3
(0.451)
X2X3
(0.237)
X5X7
(0.610)
X2X3
(0.578)
X5X8
(0.646)
X2X3
(0.431)
X2X5
(0.549)
X6X8
(0.480)
X2X5
(0.385)
X3X7
(0.203)
X6X7
(0.540)
X2X6
(0.572)
X2X7
(0.487)
X2X8
(0.360)
X2X3
(0.472)
X1X4
(0.376)
X2X4
(0.325)
X6X8
(0.195)
X3X7
(0.533)
X2X4
(0.570)
X2X3
(0.465)
X6X8
(0.321)
X3X8
(0.472)
X3X4
(0.336)
X5X7
(0.324)
X6X7
(0.194)
X3X6
(0.518)
X6X7
(0.554)
X1X4
(0.458)
X1X6
(0.304)
X1X2
(0.456)
X4X7
(0.335)
X4X7
(0.285)
X2X6
(0.194)
X1X7
(0.518)
X1X6
(0.534)
X2X6
(0.453)
X4X8
(0.278)
X2X6
(0.433)
X5X8
(0.335)
2017 X5X7
(0.300)
X3X5
(0.405)
X5X7
(0.705)
X3X8
(0.671)
X6X8
(0.533)
X6X8
(0.392)
X5X6
(0.474)
X2X4
(0.525)
X5X8
(0.233)
X3X8
(0.398)
X2X7
(0.602)
X3X5
(0.631)
X4X7
(0.498)
X1X3
(0.347)
X4X6
(0.462)
X4X7
(0.485)
X4X7
(0.212)
X1X6
(0.363)
X1X7
(0.582)
X4X7
(0.578)
X2X7
(0.462)
X2X7
(0.337)
X3X5
(0.430)
X5X6
(0.455)
X3X5
(0.210)
X6X7
(0.349)
X4X7
(0.576)
X3X7
(0.560)
X1X7
(0.458)
X7X8
(0.325)
X2X5
(0.425)
X6X7
(0.437)
X4∩X5
(0.205)
X6X8
(0.336)
X7X8
(0.560)
X6X7
(0.525)
X3X8
(0.394)
X3X7
(0.322)
X3X8
(0.398)
X2X6
(0.415)

Note: Only the top 5 interaction factors are listed.

In general, the spatio-temporal patterns of carbon equity in the Loess Plateau were affected by the long-term interactions of geographical location, social economy, science and technology level, and policy system (Figure 9). The combination of geographical location and main function orientation produced a difference in development conditions and resource carrying capacity, which is the basis of industrial layout and infrastructure construction, determining the size of the radiation-driven role of central cities in counties and districts and the efficiency of factor flow between regions. Consequently, this was an important binding force for the spatio-temporal differentiation of regional carbon equity. In the context of rapid urbanization, population and resource elements gather in urban agglomerations, which not only reduces the population pressure in ecologically fragile areas, but also promotes rapid development of the social economy in urbanized areas, while the economic level and industrial structure are important characteristics of regional development and wealth levels. Carbon emissions and their regional differences, which affect regional development, were an important driving force in the evolution of the spatial pattern of carbon equity. Human capital and technological innovation were advanced factors in production that promoted the transformation and upgrading of modern industrial structures. By improving the level of human capital, science and technology level, energy efficiency could be improved, thereby reducing carbon emissions and improving the spatial pattern of economic carbon equity. Government policies have always had an important influence on the ecological protection and economic development of the Loess Plateau. The continuous implementation of the policy of returning farmland to forests (grasslands) and the system of MFOZs has effectively promoted regional ecological restoration and orderly development of land space. At the same time, government-led ecological compensation and financial transfer payments have realized the value of ecological products and consolidated regional ecological conservation. The orderly flow of resource elements between functional zones and between developed and underdeveloped areas has become an important regulatory force in the spatio-temporal differentiation of regional carbon equity. Within each functional zone, geographical location and social economy level were the basis for the formation of the spatial pattern of carbon equity, while science and technology progress and policy systems were the important driving forces for the evolution of the spatial pattern of ecological carbon equity. The synergy enhancement among various factors affected the spatio-temporal variation pattern of carbon equity.
Figure 9 Formation mechanism of spatio-temporal pattern of carbon equity in the Loess Plateau

6 Conclusions and discussion

6.1 Conclusions

This paper constructed a theoretical framework for regional carbon equity based on the MFOZs, then revealed the spatio-temporal differentiation and influencing factors of carbon emission equity in the Loess Plateau and its functional zones from 2000 to 2017 by using the carbon equity model, Theil index, and Geo-detector. The main conclusions are as follows:
(1) From 2000 to 2017, the carbon ESC of the Loess Plateau showed a fluctuating downward trend, and the ecological carbon equity was high. The spatial pattern of county ecological carbon equity showed a cascade increase from the urban agglomeration at the core to the peripheral regions. Urban agglomeration areas, provincial capitals, and their surrounding counties may experience disorderly development in the process of urbanization, and the replacement of ecological space with urban space leads to a low level of ecological carbon equity. The functional orientation of the three MFOZs is consistent with ecological carbon equity. The ecological carbon equity of the KEFZs is the highest, followed by the MAPZs, and the key development areas are the main areas causing carbon ecological inequality in the Loess Plateau.
(2) During the study period, the carbon ECC of the Loess Plateau decreased significantly, and the economic carbon equity generally showed a downward trend. After 2010, the economic carbon equity showed an upward trend. The spatial pattern of county economic carbon equity has changed from “low in the northeast and high in the southwest” to “high in the south and low in the north”, and the economic carbon equity of provincial capitals and their surrounding counties is generally low, which indicates that the economic development mode of these counties is extensive, the economic contribution rate of carbon emissions is low, and the problem of economic carbon emission inequity is prominent. Similarly, the functional orientation of the three MFOZs is consistent with the economic carbon equity. However, after the implementation of the MFOZP, the economic carbon equity in the three MFOZs changed from KDZs > KEFZs > MAPZs to KDZs > MAPZs > KEFZs.
(3) Regional differences in carbon equity in the Loess Plateau showed a decreasing trend. The difference in ecological carbon equity in functional zones is consistent with the changes in the overall differences; the overall differences in economic carbon equity in the region show a trend of rising first, then declining rapidly, and then stabilizing. From the perspective of the differences in the three MFOZs, the regional differences in carbon equity in KEFZs showed a trend of first rising, then declining, before stabilizing, whereas the ecological carbon equity in KDZs and MAPZs shows a trend of first declining and then stabilizing. The evolution of economic carbon equity in KEFZs is consistent with overall regional differences. Before the implementation of MFOZP, the regional difference in economic carbon equity in the KEFZs was greater than that in the KDZs and MAPZs. After the implementation of MFOZP, the regional difference in economic carbon equity in KDZs became the largest.
(4) Spatio-temporal variations in carbon equity in the Loess Plateau are affected by multiple factors. Environmental protection policies and location conditions are the dominant factors for the formation of the pattern of ecological carbon equity, while geographical location, social economy level, and science and technology progress are the dominant factors for the formation of the pattern of economic carbon equity. Each factor has a strong interaction with eco-environmental protection policies, which is the key interaction force driving the evolving spatial pattern of carbon equity. After the implementation of MFOZP, the effect of eco-environmental protection policy factors on the ecological carbon equity of KDZs and MAPZs has been significantly enhanced, and the impact of government expenditure on the economic carbon equity of MAPZs and KEFZs, as well as the ecological carbon equity of KEFZs, has significantly increased.

6.2 Discussion

6.2.1 Complexity of influencing factors and driving mechanisms of regional carbon equity

The formation and evolution of carbon equity pattern are comprehensively affected by multiple factors. This paper found that geographical location, social economy, scientific and technological progress and policy system have extensive and profound effects on carbon equity in the Loess Plateau. Compared with the influencing factors of carbon equity at the global, regional and household scales, there are similarities and differences. Chen et al. (2020) also believed that the differences in economic development level, resource endowment, industrial structure and energy structure caused the inequality of regional carbon emissions. Climate policy, income and consumption level, carbon tax system and international trade affected carbon equity at the global macro scale (Chancel, 2022; Wang et al., 2022). The gap between urban and rural areas, aging population and lifestyle have exacerbated the carbon inequality at the micro household scale (Liu and Zhang, 2022; Wang et al., 2022). This showed that the manifestations and influencing factors of carbon equity are different on different spatial scales. The Loess Plateau is a typical ecologically fragile area in China, and the state has always attached great importance to the ecological protection and restoration of the region. The implementation of the strategy of returning farmland (grazing) to forestry (grassland), of the comprehensive management of small watersheds, and of MFOZs in the region have effectively improved the ecological environment, and the increase in carbon sink resources has maintained the ecological carbon equity of the region at a high level (Song et al., 2020; Piao et al., 2022). At the same time, the region is rich in energy resources and is a typical energy chemical base-bearing area. Heavy industry, based on the development and utilization of energy and mineral resources, occupies a dominant position in the economic development pattern. In addition, it has undertaken a large number of industrial investment and backward production capacity from the eastern region in recent years, and the mode of economic development is still extensive. Consequently, the economic contribution capacity of carbon emissions in the region is insufficient, and the unfairness of the economic carbon is prominent (Ma et al., 2022). In addition, although MFOZP has been implemented in the Loess Plateau for more than 10 years, it still faces major challenges in realizing the transformation of the economic development mode from extensive to intensive and low-carbon, being limited by geographic location, resources endowment and development path, the ecological carbon equity in the Loess Plateau is generally higher than that of economic carbon equity. Under the background of the “double carbon” goal, it is vital to strictly implement the system of the MFOZs, change the mode of economic development, promote low-carbon industrial development, and improve the regional economic carbon equity according to the orientation and development direction of each functional zone.

6.2.2 Policy implications of regional carbon equity change from the perspective of MFOZs

The results showed that the spatio-temporal differentiation and formation mechanism of carbon equity in the Loess Plateau changed significantly before and after the implementation of the MFOZP, indicating that the MFOZP has an important impact on carbon equity in the Loess Plateau. Therefore, under the framework of the MFOZs, the key to seeking higher carbon equity in the Loess Plateau region is to optimize the spatial allocation of resources and production factors and abandon the extensive development model of economic growth at the cost of resources and the environment. To this end, carbon equity can be enhanced based on various aspects. First, the Loess Plateau resource endowment difference should be based on regional differences, taking into account the following: the national “double carbon” target overall layout; industrial structure and spatial layout of MFOZP; design differentials in regional development and fiscal and taxation policies and in ecological environmental protection and carbon compensation policies; and strict industrial environment access. The elimination of backward production capacity should be accelerated, and guidance should be given for the region to gradually improve its economic development efficiency. Second, according to the orientation of regional main functions and on the basis of ensuring fairness of economic development rights, the allocation of regional carbon emission rights by means of government regulation and market regulation should be optimized, and a carbon emission trading system implemented among different function-oriented districts and counties to promote carbon equity among regions. Third, according to the needs of regional industrial development and ecological protection, investment in research and development of new technologies and processes and the training of high-quality talents should be strengthened. A green production system should be built, relying on scientific and technological innovation, improvements in energy efficiency and ecological environment capacity, while ensuring regional carbon equity. Finally, integrating the resource elements, governance subjects (e.g., government, enterprises, the public) and the reality of the carbon equity of different MFOZs, this study innovates the idea of multiple co-governance and establishes a coordinated governance system for regional carbon emissions. In view of the lack of development rights in areas with high ecological capacity and low carbon emissions, as well as the negative externalities for the ecological environment caused by areas with high carbon emissions, a self-organizing management system of carbon equity linked by different MFOZs should be established.

6.2.3 Limitations and prospects

The study of carbon equity is the scientific basis for the construction of a carbon offset mechanism that aims to achieve fair development and coordinated carbon emission reduction among regions (Xia and Yang, 2022). This study only explores the spatio-temporal differentiation characteristics and influencing factors of carbon equity in the Loess Plateau by using the the existing research methods and statistical data, and puts forward preliminary suggestions for achieving carbon equity. It does not divide the carbon compensation zones from the perspective of MFOZs or account for the value standards of carbon compensation in various types of regions. In the future, carbon equity research should be carried out in depth by building a regional carbon equity assessment model and using multiple data such as statistics, survey and monitoring. According to the assessment results, it is also necessary to divide the carbon compensation-type regions of the Loess Plateau in combination with energy resource endowment, carbon emission intensity, social and economic development and carbon market price. Based on this, calculating the carbon compensation value and building a cross-regional horizontal carbon compensation mechanism will promote coordinated development among regions.
In addition, this study mainly focuses on final consumption carbon emissions within the region but pays less attention to the fairness of the embodied carbon transfer between regions. Developed regions meet economic development and consumption demand by developing high-end industries and importing energy resources from resource-rich regions, which may lead to the transfer of carbon emissions from developed regions to underdeveloped regions (Zhong et al., 2020). Because of the relatively extensive development model in underdeveloped regions, it is likely to lead to an increase in the total carbon emissions instead of a decrease, thus aggravating the unfairness of regional carbon emissions, so it is imperative to strengthen research on the fairness of future embodied carbon transfer among regions. At the same time, the realization of carbon equity is essentially a sustainable development issue, and sustainable development is an important part of the study of development geography, giving full play to the comprehensive perspective of development geography and the advantages of multidisciplinary integration to solve the social, economic, environmental, and other multidimensional development problems facing the region, which is of great significance to achieve regional high-quality development (Deng et al., 2021). In the future, relevant theories of development geography can be incorporated into the study of regional carbon equity, adding innovation to this critical area of research.
[1]
Bruckner B, Hubacek K, Shan Y et al., 2022. Impacts of poverty alleviation on national and global carbon emissions. Nature Sustainability, 5(4): 311-320.

DOI

[2]
Budolfson M B, Anthoff D, Dennig F et al., 2021. Utilitarian benchmarks for emissions and pledges promote equity, climate and development. Nature Climate Change, 11(10): 827-833.

DOI

[3]
Chancel L, 2022. Global carbon inequality over 1990-2019. Nature Sustainability, 5(11): 931-938.

DOI

[4]
Chen H, Wen J, Pang J et al., 2020. Research on the carbon transfer and carbon equity at provincial level of China based on MRIO model of 31 provinces. China Environmental Science, 40(12): 5540-5550. (in Chinese)

[5]
Chen J D, Gao M, Cheng S L et al., 2020. County-level CO2 emissions and sequestration in China during 1997-2017. Scientific Data, 7(1): 391.

DOI

[6]
Chen W X, Li J F, Zeng J et al., 2019. Spatial heterogeneity and formation mechanism of eco-environmental effect of land use change in China. Geographical Research, 38(9): 2173-2187. (in Chinese)

DOI

[7]
Clarke-Sather A, Qu J S, Wang Q et al., 2011. Carbon inequality at the sub-national scale: A case study of provincial-level inequality in CO2 emissions in China 1997-2007. Energy Policy, 39(9): 5420-5428.

DOI

[8]
Cui Y, Khan S U, Deng Y et al., 2022. Spatiotemporal heterogeneity, convergence and its impact factors: Perspective of carbon emission intensity and carbon emission per capita considering carbon sink effect. Environmental Impact Assessment Review, 92: 106699.

DOI

[9]
Deng X Z, Jin G, He S J et al., 2021. Research progress and prospect on development geography. Journal of Geographical Sciences, 31(3): 437-455.

DOI

[10]
Fan J, 2015. Draft of major function oriented zoning of China. Acta Geographica Sinica, 70(2): 186-201. (in Chinese)

DOI

[11]
Fan J, Guo R, 2021. Scientific foundations and strategies of national territorial spatial governance during the 14th Five-Year-Plan Period in China. Urban Planning Forum, (3): 15-20. (in Chinese)

[12]
Hong C, Burney J A, Pongratz J et al., 2021. Global and regional drivers of land-use emissions in 1961-2017. Nature, 589(7843): 554-561.

DOI

[13]
Hong C, Zhao H, Qin Y et al., 2022. Land-use emissions embodied in international trade. Science, 376(6593): 597-603.

DOI PMID

[14]
Huang R, Wang Z, Ding G Q et al., 2016. Trend prediction and analysis of influencing factors of carbon emissions from energy consumption in Jiangsu province based on STIRPAT model. Geographical Research, 35(4): 781-789. (in Chinese)

DOI

[15]
Jiang W B, Liu W D, 2021. Effect of change of the spatial pattern of economic activities on CO2 emissions in China. Resources Science, 43(4): 722-732. (in Chinese)

[16]
Kornek U, Klenert D, Edenhofer O et al., 2021. The social cost of carbon and inequality: When local redistribution shapes global carbon prices. Journal of Environmental Economics and Management, 107: 102450.

DOI

[17]
Li L, Dong J, Xu L et al., 2019. Spatial variation of land use carbon budget and carbon compensation zoning in functional areas: A case study of Wuhan Urban Agglomeration. Journal of Natural Resources, 34(5): 1003-1015. (in Chinese)

DOI

[18]
Liu G, Zhang F, 2022. China’s carbon inequality of households: Perspectives of the aging society and urban-rural gaps. Resources, Conservation and Recycling, 185: 106449.

[19]
Liu Y J, Tang J X, 2022. Spatio-temporal evolution characteristics and influencing mechanism of green development efficiency of tourism industry in China. Journal of Natural Resources, 37(3): 681-700. (in Chinese)

DOI

[20]
Lu J Y, Huang X J, Dai L et al., 2012. Spatio-temporal scale analysis on the equality of energy consumption carbon emission distribution in China. Journal of Natural Resources, 27(12): 2006-2017. (in Chinese)

[21]
Ma B B, Dang X X, Yuan S M et al., 2022. Location selection and spatial justice of polluting enterprises in underdeveloped areas. Acta Geographica Sinica, 77(4): 1009-1027. (in Chinese)

DOI

[22]
Ma X W, Chen D N, Lan J K et al., 2019. Correlation between income disparity and CO2 emissions from household consumption. Journal of Beijing Institute of Technology (Social Sciences Edition), 21(6): 1-9. (In Chinese)

[23]
Mao H Y, 1991. Study on coordinating development of economic, social growth with population, resources and environment at county level. Acta Geographica Sinica, 46(4): 385-395. (in Chinese)

[24]
O’Neill B C, Liddle B, Jiang L W et al., 2012. Demographic change and carbon dioxide emissions. The Lancet, 380(9837): 157-164.

DOI

[25]
Pan X, Wang H, Wang Z et al., 2019. Carbon Palma Ratio: A new indicator for measuring the distribution inequality of carbon emissions among individuals. Journal of Cleaner Production, 241: 118418.

DOI

[26]
Pan X Z, Teng F, Ha Y J et al., 2014. Equitable access to sustainable development: Based on the comparative study of carbon emission rights allocation schemes. Applied Energy, 130: 632-640.

DOI

[27]
Peng Q, Xu W, Xiao Y, 2022. Can carbon offset policies be effectively implemented in all regions of China? An evolutionary game analysis of decision-making dynamics of local governments. Sustainability, 14(3): 1591.

DOI

[28]
Piao S L, He Y, Wang X H et al., 2022. Estimation of China’s terrestrial ecosystem carbon sink: Methods, progress and prospects. Science China (Earth Sciences), 65(4): 641-651.

DOI

[29]
Pozo C, Galán-Martín Á, Reiner D M et al., 2020. Equity in allocating carbon dioxide removal quotas. Nature Climate Change, 10(7): 640-646.

DOI

[30]
Pye S, Bradley S, Hughes N et al., 2020. An equitable redistribution of unburnable carbon. Nature Communications, 11(1): 1-9.

DOI

[31]
Soest H L, Elzen M G J, Vuuren D P, 2021. Net-zero emission targets for major emitting countries consistent with the Paris Agreement. Nature Communications, 12(1): 1-9.

DOI

[32]
Song Y Y, Ma B B, Dai L H et al., 2021. Spatial-temporal pattern and formation mechanism of county urbanization on the Chinese Loess Plateau. Journal of Mountain Science, 18(4): 1093-1111.

DOI

[33]
Song Y Y, Xue D Q, Dai L H et al., 2020. Land cover change and eco-environmental quality response of different geomorphic units on the Chinese Loess Plateau. Journal of Arid Land, 12(1): 29-43.

DOI

[34]
Su W S, Liu Y Y, Wang S J et al., 2018. Regional inequality, spatial spillover effects, and the factors influencing city-level energy-related carbon emissions in China. Journal of Geographical Sciences, 28(4): 495-513.

DOI

[35]
Tan D, Huang X J, 2008. Correlation analysis and comparison of the economic development and carbon emissions in the eastern, central and western part of China. China Population, Resources and Environment, 18(3): 54-57. (in Chinese)

[36]
Teng F, He J K, Pan X Z et al., 2010. How to measure carbon equity: Carbon Gini index based on historical cumulative emission per capita. Advances in Climate Change Research, 6(6): 449-455. (in Chinese)

[37]
Wang J F, Xu C D, 2017. Geodetector: Principle and prospective. Acta Geographica Sinica, 72(1): 116-134. (in Chinese)

DOI

[38]
Wang K Y, Cui Y Y, Zhang H W et al., 2022. Household carbon footprints inequality in China: Drivers, components and dynamics. Energy Economics, 115: 106334.

DOI

[39]
Wang Q, Gao C Y, 2016. Analysis of allocation principles for China’s provincial carbon emission allowance under the equity and efficiency dimension. China Population, Resources and Environment, 26(7): 53-61. (in Chinese)

[40]
Wang S J, Gao S, Huang Y Y et al., 2020. Spatiotemporal evolution of urban carbon emission performance in China and prediction of future trends. Journal of Geographical Sciences, 32(5): 757-774.

DOI

[41]
Wang S J, Xie Z H, Wang Z H, 2021. The spatiotemporal pattern evolution and influencing factors of CO2 emissions at the county level of China. Acta Geographica Sinica, 76(12): 3103-3118. (in Chinese)

[42]
Wang W J, Chen Z L, 2019. Study on the allocation plan of initial carbon allowances in China’s province-level regions: Based on the perspective of responsibility and goals, fairness and efficiency. Management World, 35(3): 81-98. (in Chinese)

[43]
Wang Y H, Xiong S Q, Ma X M, 2022. Carbon inequality in global trade: Evidence from the mismatch between embodied carbon emissions and value added. Ecological Economics, 195: 107398.

DOI

[44]
Wen L J, Zhang J J, 2015. Progress and trends of land spatial regulation, unbalanced development and spatial externalities. China Land Science, 29(7): 4-12. (in Chinese)

[45]
Xia S Y, Yang Y, 2022. Examining spatio-temporal variations in carbon budget and carbon compensation zoning in Beijing-Tianjin-Hebei urban agglomeration based on major functional zones. Journal of Geographical Sciences, 32(10): 1911-1934.

DOI

[46]
Xie H L, Liu G Y, 2015. Spatiotemporal difference and determinants of multiple cropping index in China during 1998-2012. Acta Geographica Sinica, 70(4): 604-614. (in Chinese)

[47]
Yang M, Liu Y S, Tian J Z et al., 2022. Dynamic evolution and regional disparity in carbon emission intensity in China. Sustainability, 14(7): 4052-4052.

DOI

[48]
Yang Y, Yang S N, 2020. Are industrial carbon emissions allocations in developing regions equitable? A case study of the northwestern provinces in China. Journal of Environmental Management, 265: 110518.

DOI

[49]
Yao L, Liu J R, Wang R S, 2011. Comparison and analysis of carbon emissions embodied in household consumption between urban and rural area of China. China Population, Resources and Environment, 21(4): 25-29. (in Chinese)

[50]
Yu J H, Xiao R L, Ma R F et al., 2022. Research hotspots and trends of carbon neutrality in international trade. Journal of Natural Resources, 37(5): 1303-1320. (in Chinese)

DOI

[51]
Zhang X, Niu S W, Zhao C S et al., 2011. The study on household energy consumption and carbon emissions in China’s urbanization. China Soft Science, (9): 65-75. (in Chinese)

[52]
Zhao R Q, Zhang S, Huang X J et al., 2014. Spatial variation of carbon budget and carbon balance zoning of Central Plains Economic Region at county-level. Acta Geographica Sinica, 69(10): 1425-1437. (in Chinese)

DOI

[53]
Zheng X Q, Lu Y L, Yuan J J et al., 2020. Drivers of change in China’s energy-related CO2 emissions. PNAS, 117(1): 29-36.

DOI

[54]
Zhong Z, Zhang X, Gao W, 2020. Spatiotemporal evolution of global greenhouse gas emissions transferring via trade: Influencing factors and policy implications. International Journal of Environmental Research and Public Health, 17(14): 5065.

DOI

[55]
Zhou D, Zheng C P, Hua S R et al., 2019. The potentialities and paths of China’s carbon emission reduction based on the coordination of fairness and efficiency. Journal of Natural Resources, 34(1): 80-91. (in Chinese)

DOI

Outlines

/