
Journal of Geographical Sciences >
How to identify transitional geospace in mountainous areas? An approach using a transitional index from the perspective of coupled human and natural systems
|
Deng Wei, PhD and Professor, E-mail: dengwei@sicnu.edu.cn |
Received date: 2022-05-07
Accepted date: 2023-02-21
Online published: 2023-06-26
Supported by
The Key Programme of National Natural Science Foundation of China(41930651)
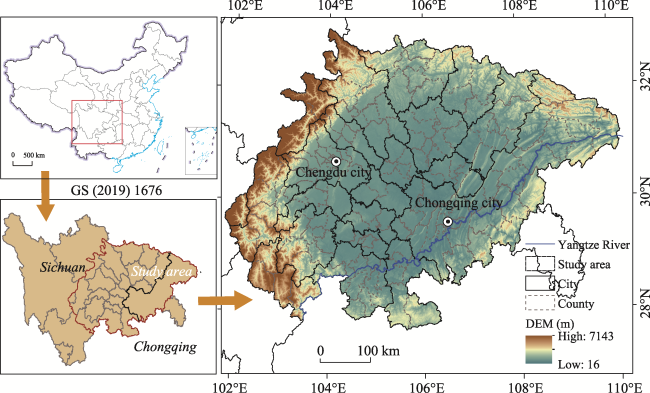
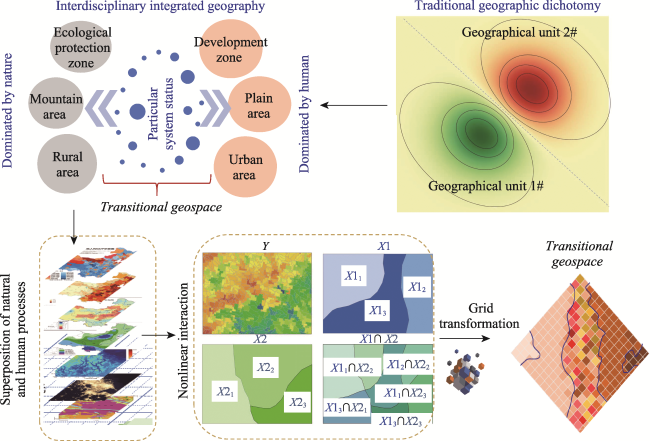
The coupling of humans and nature differs in terms of distribution and intensity, thus producing a gradient of synthetic geographical environments. Within this variety of gradients, the transitional zone represents a complex space where dynamic processes and unstable conditions are observed. Based on the concepts of ecotone and transitional zone, we propose a conceptual framework for the transitional geospace of coupled human and natural systems and a quantitative identification method for the zone. Taking the Sichuan Basin as an example, this study defined the strength and direction of the coupling of the natural ecosystem and socioeconomic system and divided different types of transitional geospace. The transitional geo- space of the strong coupling type accounted for approximately 16.7% of the study area. Nine of the ten counties with the largest proportion of the type were formerly nationally poor counties in the study area. In the strong coupling type, human and nature jointly explained a high proportion of the variance in transitional stability (e.g., in Shifang city, with an unexplained proportion of 1.7%). The discovery and characterization of the transitional geospace types is crucial for facilitating more effective land use planning and sustainable balance among the population, resources, and environment.
DENG Wei , ZHANG Hao , ZHANG Shaoyao , WANG Zhanyun , HU Maogui , PENG Li . How to identify transitional geospace in mountainous areas? An approach using a transitional index from the perspective of coupled human and natural systems[J]. Journal of Geographical Sciences, 2023 , 33(6) : 1205 -1225 . DOI: 10.1007/s11442-023-2126-6
Figure 1 Location of the study area (Sichuan Basin) |
Table 1 The description and sources of data used in the study |
| Data types | Purpose | Sources |
|---|---|---|
| Land use data | Soil erosion, land function and density of settlement patch | Resource and Environment Science and Data Center (www.resdc.cn). (30-m resolution) |
| Digital elevation model | Topographic position index and soil erosion | Shuttle Radar Topography Mission dataset provided digital elevation model data. (90-m resolution). |
| Normalized difference vegetation index (NDVI) data | Vegetation condition | MOD13Q1 NDVI data was obtained from NASA’s (United States National Aeronautics and Space Administration) Earth Science Data Systems (available online: https://www.earthdata.nasa.gov/eosdis). (250-m resolution) |
| Nighttime light imagery data | Density of GDP | Harvard Dataverse (500-m resolution, https://doi.org/10.7910/DVN/YGIVCD). |
| GDP | Density of GDP | GDP data were derived from China Statistical Yearbooks (county-level), and they were allocated to each grid (500-m resolution) to implement downscaling. |
| Climate data | Humidity index, soil erosion, and accumulative temperature | The precipitation and temperature data were downloaded from the China Meteorological Data Network and interpolated at a 500 m × 500 m resolution. MOD16A2 Evapotranspiration data was provided by the NASA’s Earth Science Data Systems. (500-m resolution) |
| Soil properties | Soil erosion | Harmonized World Soil Database (https://www.fao.org/soils-portal/soil-survey/soil-maps-and-databases). (1-km resolution) |
| Protected area data | Natural component index | The World Database on Protected Areas (vector data, https://developers.google.cn/earth-engine/datasets/catalog). |
| Road data | Traffic accessibility | Open Street Map (vector data, https://www.openstreetmap.org). |
Figure 2 Conceptual framework for the TG |
Table 2 Index system for identifying TG in mountainous areas |
| Target layer | Criteria layer | Index layer | Sub-index layer |
|---|---|---|---|
| Transitional index of CHANS | Natural component index | Landform | Topographic position index |
| Climate | Humidity index | ||
| Accumulative temperature (≥10 ℃) | |||
| Soil | Soil erosion | ||
| Vegetation | Normalized difference vegetation index | ||
| Human component index | Population | Density of settlement patch | |
| Land use | Land function index | ||
| Economy | Density of GDP | ||
| Traffic location | Traffic accessibility |
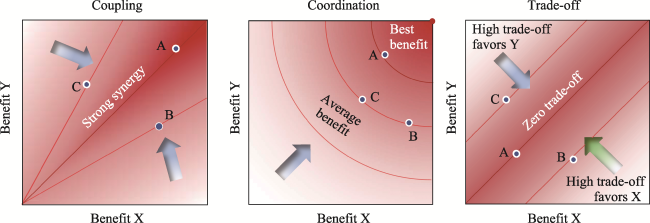
Figure 3 Illustration and example of coordination and trade-offs between two benefits. The order for the coupling, coordination, and trade-off of dots A, B and C is |A| > |B| = |C|. Note that B = -C can be obtained only in the trade-off model process. |
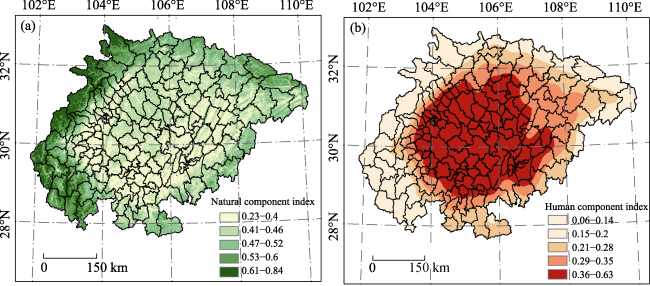
Figure 4 The natural component index (a) and human component index (b) across the Sichuan Basin |
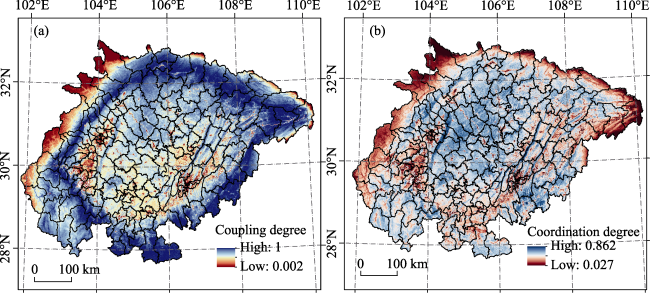
Figure 5 The coupling degree (a) and coordination degree (b) of human and natural components across the Sichuan Basin |
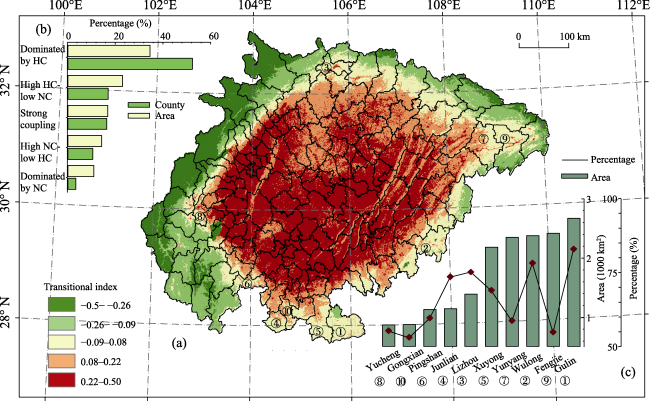
Figure 6 The transitional index across the Sichuan Basin (a), proportion of each type (b), and 10 counties with a large area of a strong coupling region (c). Human components and natural components are represented by HC and NC, respectively. |
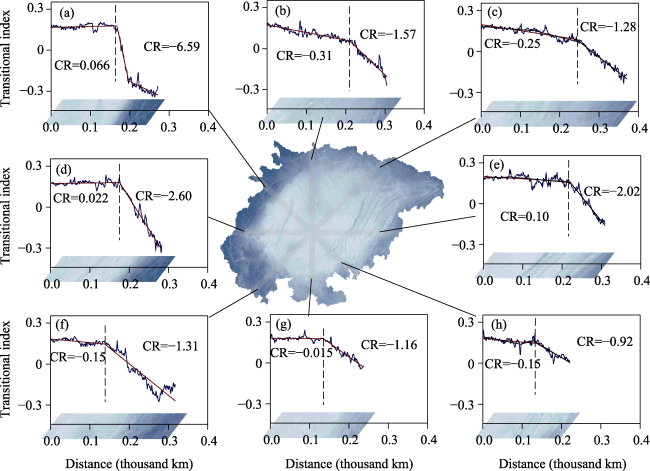
Figure 7 Gradient transects of transitional index of typical directions. The change rate is represented by CR. |
Table 3 Transitional index changes and transitional types of typical counties |
| Gradient transect | CR1 | CR2 | Difference | Classification | Geomorphic transition | Typical county |
|---|---|---|---|---|---|---|
| a | 0.066 | -6.59 | 6.656 | Sharp transition | Tibetan Plateau-Chengdu Plain | Shifang |
| b | -0.31 | -1.57 | 1.26 | Slow transition | Qinba Mountains-Sichuan Hilly Basin | Jiangyou |
| c | -0.25 | -1.28 | 1.03 | Slow transition | Qinba Mountains-Sichuan Hilly Basin | Tongjiang |
| d | 0.022 | -2.6 | 2.622 | Rapid transition | Hengduan Mountains-Chengdu Plain | Tianquan |
| e | 0.1 | -2.02 | 2.12 | Rapid transition | Paralleled ridge-valley of east Sichuan- Wushan Mountains | Fengdu |
| f | -0.15 | -1.31 | 1.16 | Slow transition | Hengduan Mountains-Chengdu Plain | Muchuan |
| g | -0.015 | -1.16 | 1.145 | Slow transition | Sichuan Hilly Basin-Yunnan-Guizhou Plateau | Changning |
| h | -0.15 | -0.92 | 0.77 | Slow transition | Sichuan Hilly Basin-Dalou Mountains | Jiangjin |
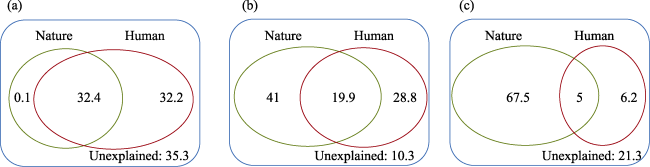
Figure 8 Relative contributions (%) of natural components and human components to the transitional index in the areas dominated by NC (a), TG (b), and HC (c) |
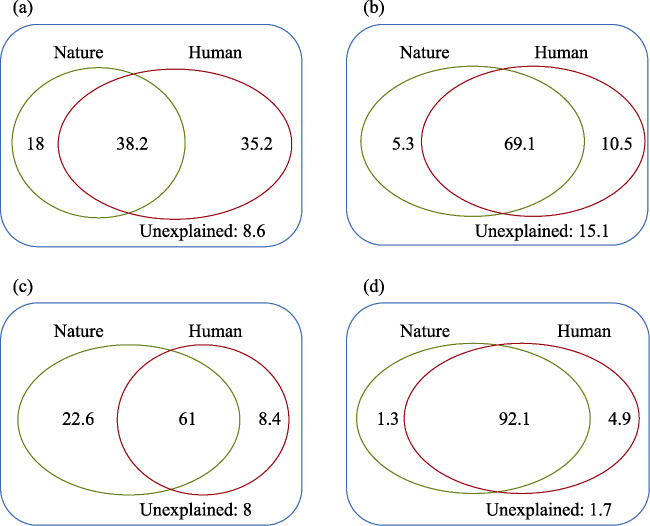
Figure 9 Relative contributions (%) of natural components and human components to the transitional index in Fengdu (a), Tianquan (b), Changning (c), and Shifang (d) |
| [1] |
|
| [2] |
|
| [3] |
|
| [4] |
|
| [5] |
|
| [6] |
|
| [7] |
|
| [8] |
|
| [9] |
|
| [10] |
|
| [11] |
|
| [12] |
|
| [13] |
|
| [14] |
|
| [15] |
|
| [16] |
|
| [17] |
|
| [18] |
|
| [19] |
|
| [20] |
|
| [21] |
|
| [22] |
|
| [23] |
|
| [24] |
|
| [25] |
|
| [26] |
|
| [27] |
|
| [28] |
|
| [29] |
|
| [30] |
|
| [31] |
|
| [32] |
|
| [33] |
|
| [34] |
|
| [35] |
|
| [36] |
|
| [37] |
|
| [38] |
|
| [39] |
|
| [40] |
|
| [41] |
|
| [42] |
|
| [43] |
|
| [44] |
|
| [45] |
|
| [46] |
|
| [47] |
|
| [48] |
|
| [49] |
|
| [50] |
|
| [51] |
|
| [52] |
|
| [53] |
|
| [54] |
|
| [55] |
|
| [56] |
|
| [57] |
|
| [58] |
|
| [59] |
|
| [60] |
|
| [61] |
|
| [62] |
|
| [63] |
|
| [64] |
|
| [65] |
|
| [66] |
|
| [67] |
|
| [68] |
|
| [69] |
|
| [70] |
|
| [71] |
|
| [72] |
|
| [73] |
|
| [74] |
|
| [75] |
|
/
| 〈 |
|
〉 |