
Journal of Geographical Sciences >
Investigating merchandise trade structure in the RCEP region from the perspective of regional integration
|
Chen Xiaoqiang (1996-), PhD Candidate, specialized in trade relationships and regional studies. E-mail: cxq@mail.bnu.edu.cn |
Received date: 2022-12-27
Accepted date: 2023-03-20
Online published: 2023-06-26
Supported by
The Program of High-grade, Precision and Advanced Disciplines Constructions in Beijing Universities
The Regional Comprehensive Economic Partnership (RCEP) was formally signed by the Association of Southeast Asian Nations (ASEAN) countries, along with China, Japan, South Korea, Australia, and New Zealand. This was a significant step towards regional integration in the Asia-Pacific region. Analysing the trade structure among member states is crucial in understanding the path to regional integration and policy implications of regional cooperation within the RCEP framework. Based on subdivided commodity data, this study reviews the evolution of merchandise trade in the RCEP region in the past two decades. It investigates the current trade structure of the RCEP, emphasising the relative importance of intra-regional versus extra-regional interdependence and the trade asymmetry of the regional members. The results of the study are as follows: First, the overall extent of regional trade integration in the RCEP region increased modestly from 2001 to 2018, indicating that the RCEP region was export-oriented and there was significant room for further expansion of regional trade. Second, most of the commodities traded in the RCEP region demonstrated much higher extra-regional interdependence than intra-regional in 2018, particularly labor-, capital-, and technology-intensive products such as television and radio apparatus. Third, the trade networks of the top five traded commodities were distinguished by large economic asymmetries, with China, Japan, and South Korea being the dominant regional powers. These findings have significant implications for understanding how to promote regional integration and cooperation. Besides expanding intra-regional trade, outward-oriented factors influenced by the regional powers—including consolidating the global advantages of manufacturing, stabilizing supply chains by including large resource countries, and attracting extra-regional investments—were also the main rationales for the conclusion of the RCEP.
Key words: trade structure; regional integration; RCEP; subdivided commodity; trade network
CHEN Xiaoqiang , YUAN Lihua , SONG Changqing . Investigating merchandise trade structure in the RCEP region from the perspective of regional integration[J]. Journal of Geographical Sciences, 2023 , 33(6) : 1185 -1204 . DOI: 10.1007/s11442-023-2125-7
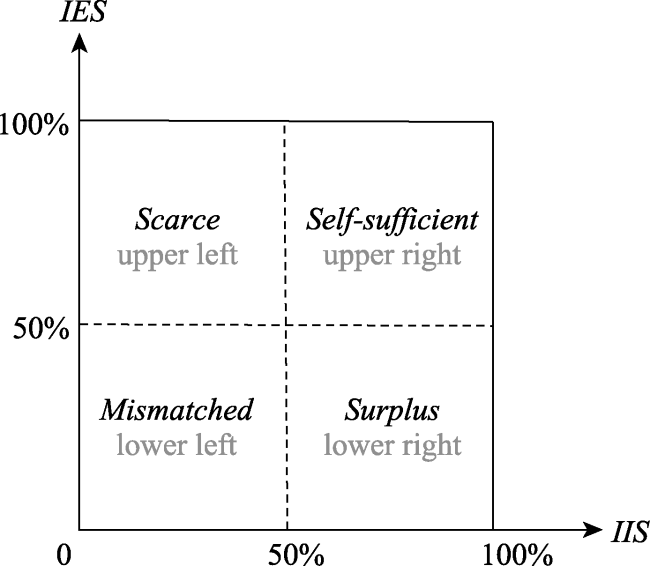
Figure 1 The two-dimensional rectangular coordinate system with IIS on the X-axis and IES on the Y-axis |
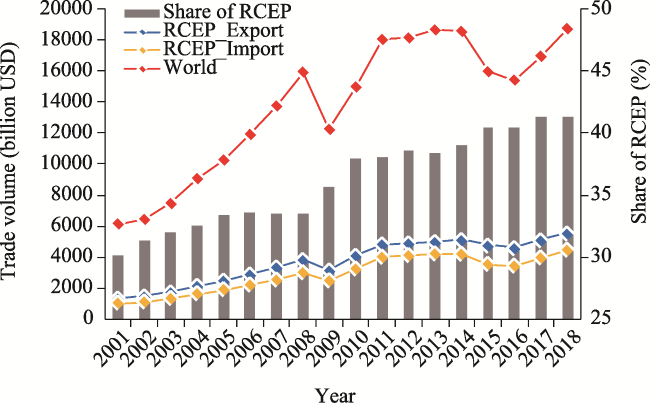
Figure 2 Merchandise trade of the RCEP and world from 2001 to 2018 |
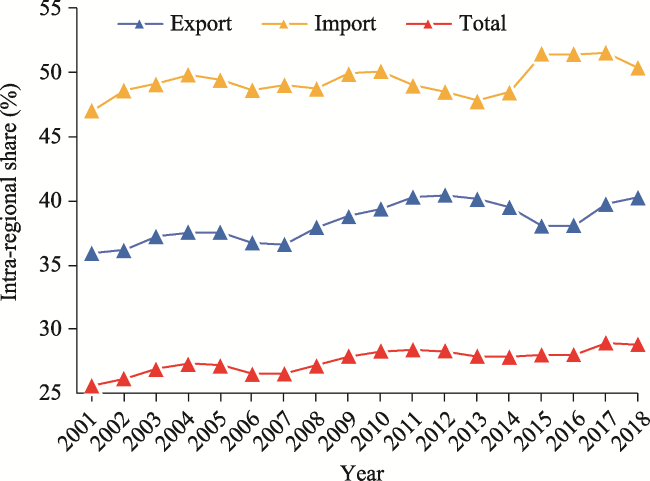
Figure 3 Intra-regional share of import, export, and total trade in the RCEP region from 2001 to 2018 |
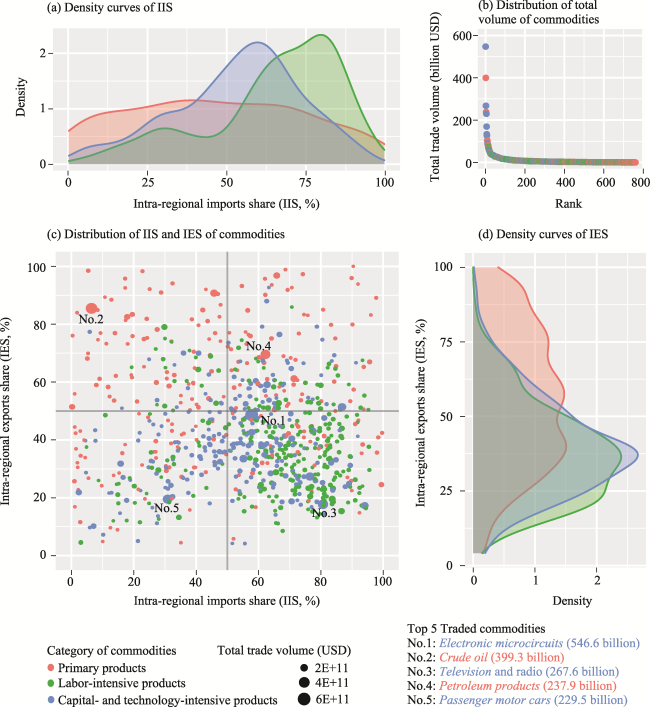
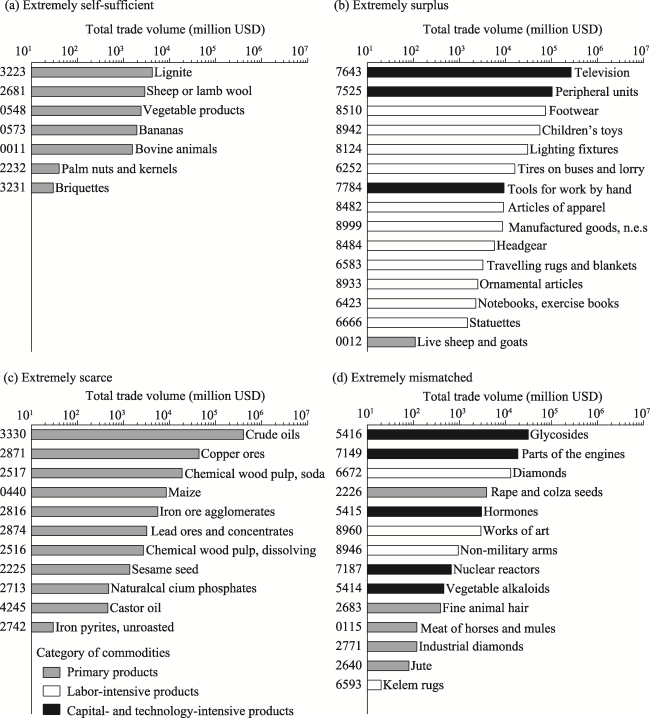
Figure 4 Distribution of IES, IIS and total trade volume of 761 types of SITC 4-digit coded commodities traded by the RCEP in 2018 |
Table 1 Number and total trade volume of commodities in different supply and demand situations |
| Situations | Primary products | Labor-intensive products | Capital- and technology-intensive products | Total |
|---|---|---|---|---|
| Number of commodities | ||||
| Self-sufficient | 66 | 40 | 49 | 155 |
| Surplus | 42 | 178 | 107 | 327 |
| Scarce | 73 | 19 | 14 | 106 |
| Mismatched | 56 | 37 | 80 | 173 |
| Total volume of trade (USD billion) | ||||
| Self-sufficient | 592.7 | 293.7 | 581.4 | 1467.8 |
| Surplus | 125.6 | 1250.4 | 2461.1 | 3837.1 |
| Scarce | 860.6 | 153.9 | 84.1 | 1098.6 |
| Mismatched | 77.3 | 212.1 | 743.4 | 1032.8 |
Figure 5 The commodities and their total trade volume in extreme states |
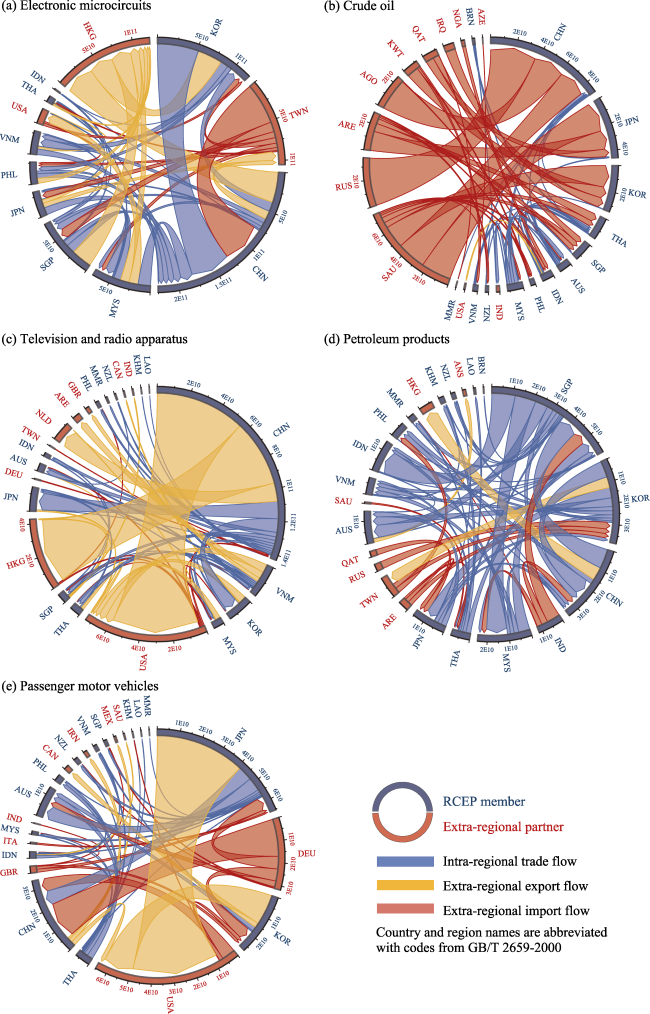
Table 2 IIS, IES and total trade volume of top five commodities |
| Top five commodities | Intra-regional import share (IIS) | Intra-regional export share (IES) | Total trade volume (billion USD) | |
|---|---|---|---|---|
| 1 | Electronic microcircuits | 57.8% | 48.6% | 546.6 |
| 2 | Crude oil | 6.4% | 85.4% | 399.3 |
| 3 | Television and radio apparatus | 80.7% | 17.7% | 267.6 |
| 4 | Petroleum products | 62.2% | 69.5% | 237.9 |
| 5 | Passenger motor vehicles | 30.8% | 19.5% | 229.5 |
Figure 6 Networks of the top five traded commodities in the RCEP in 2018 |
| [1] |
|
| [2] |
|
| [3] |
|
| [4] |
|
| [5] |
|
| [6] |
|
| [7] |
|
| [8] |
|
| [9] |
|
| [10] |
|
| [11] |
|
| [12] |
|
| [13] |
|
| [14] |
|
| [15] |
|
| [16] |
|
| [17] |
|
| [18] |
|
| [19] |
|
| [20] |
|
| [21] |
|
| [22] |
|
| [23] |
|
| [24] |
|
| [25] |
|
| [26] |
|
| [27] |
|
| [28] |
|
| [29] |
|
| [30] |
|
| [31] |
|
| [32] |
|
| [33] |
|
| [34] |
|
| [35] |
|
| [36] |
|
| [37] |
|
| [38] |
|
| [39] |
|
| [40] |
|
| [41] |
|
| [42] |
|
| [43] |
|
| [44] |
|
| [45] |
|
| [46] |
|
| [47] |
|
| [48] |
|
/
| 〈 |
|
〉 |