Research Articles

Spatial pattern of knowledge innovation function among Chinese cities and its influencing factors

  • YU Yingjie , 1, 2 ,
  • LYU Lachang , 1, 3, *
Expand
  • 1. College of Resource Environment and Tourism, Capital Normal University, Beijing 100048, China
  • 2. School of Urban & Regional Science, East China Normal University, Shanghai 200062, China
  • 3. Beijing Urban innovation and Development Research Center, Beijing 100048, China
*Lyu Lachang (1963-), PhD and Professor, specialized in innovative geographical research. E-mail:

Yu Yingjie (1996-), PhD Candidate, specialized in innovative geographical research. E-mail:

Received date: 2023-01-15

  Accepted date: 2023-03-11

  Online published: 2023-06-26

Supported by

National Natural Science Foundation of China(41971201)

Abstract

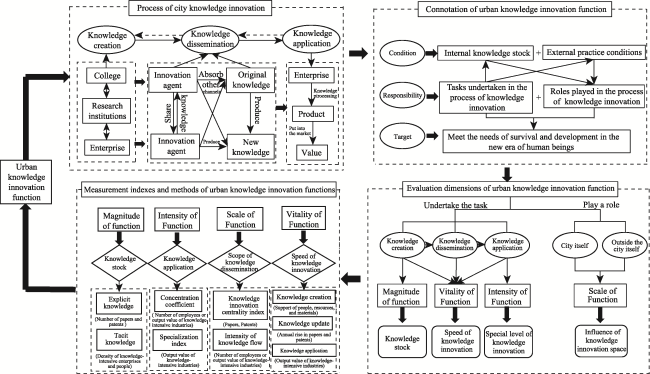
Knowledge innovation is a key component of urban innovation function and an important basis for modern urban development. Combining the multidisciplinary research of knowledge innovation, this paper constructs a measurement framework of urban knowledge innovation function from the perspective of urban geography and analyzes its spatial pattern and influencing factors. The conclusions are as follows: (1) The function of urban knowledge innovation refers to the tasks and roles it undertakes in the process of knowledge creation, knowledge dissemination and knowledge application, which is based on the internal knowledge stock and external practice conditions to meet the needs of human survival and development in the new era. The measurement dimensions include functional scale, functional intensity, functional scale, and functional vitality. (2) The development level of knowledge innovation functions in Chinese cities is uneven, and the cities with outstanding knowledge innovation functions are mainly concentrated in the eastern coastal areas and a few developed areas in the central and western regions, forming the diamond-shaped knowledge innovation structure with the Beijing-Tianjin, the Yangtze River Delta, the Pearl River Delta, Shaanxi-Chengdu-Chongqing as the four vertices and central Wuhan and Hefei as the center. According to the Jenks natural breakpoint method, it is divided into national-level, regional-level, local-level and knowledge-innovative development cities. (3) The spatial differentiation characteristics of urban knowledge innovation function are simultaneously affected by various natural and human factors. Among them, economic environment, opening environment, and cultural environment have the strongest interactive explanatory power with other factors, and are the dominant factors affecting the city’s knowledge innovation function. In the future, China should fully considers the status and characteristics of the city’s own knowledge economy development with corresponding policies and measures suitable for the development of the city’s knowledge economy, and strengthen the dominant position of human and social factors in the constructing the city’s knowledge innovation function.

Cite this article

YU Yingjie , LYU Lachang . Spatial pattern of knowledge innovation function among Chinese cities and its influencing factors[J]. Journal of Geographical Sciences, 2023 , 33(6) : 1161 -1184 . DOI: 10.1007/s11442-023-2124-8

1 Introduction

Urban functions are the role and division of labor that a city plays in the economic and social development of a certain region, and the role that a city plays in terms of economy, politics, and culture in areas other than the city itself (Wang and Xu, 2004). With the changes of the times, the functions of cities have shifted from manufacturing functions, management coordination functions to innovation functions (Lyu et al., 2009). As the centers of intensive knowledge innovation resources and knowledge transfer and exchange, cities form the innovation function by taking knowledge as an important strategic resource, which undertakes important tasks in national or regional economic development (Carrillo et al., 2014; Pancholi et al., 2014; Yigitcanlar and Bulu, 2015). Knowledge innovation is the engine of economic growth and the basic driving force of regional development (Zhang, 1999; Wang, 2001). As an important part and development foundation of urban innovation, knowledge innovation function not only undertakes the task of knowledge innovation but also affects development of other urban innovation functions. Therefore, exploring the spatial differentiation of Chinese cities’ knowledge innovation functions and analyzing the regional differences that affect the development of urban knowledge innovation functions provides important references for the construction of knowledge innovation cities and the formulation of Chinese urban knowledge innovation development strategies.
In recent years, knowledge innovation has become a hot research field in economics, management, geography and other disciplines, among which economics and management focus on the understanding of the connotation of knowledge innovation (Yan, 2010) and evaluate regional knowledge innovation capabilities in terms of knowledge creation, knowledge dissemination and knowledge application and etc (Jiang, 2007; Graciela et al., 2019; Malerba and McKelvey, 2019), geography focuses on analyzing the differences and influencing factors of regional knowledge innovation levels from the aspects of innovation environment (Meng and Li, 2002; Bathelt et al., 2004; Hu et al., 2014), exploring the spatial structure of knowledge innovation in urban agglomerations based on patent cooperation (Zhou et al., 2017), using patents to analyze the spatial pattern and influencing factors of urban innovation capabilities (He et al., 2017). Scholars have made some progress in the research on the spatial pattern of urban knowledge innovation by using patents, but it is not enough to fully characterize the urban knowledge innovation function and its spatial pattern characteristics. According to the understanding of knowledge innovation in economics and management, urban knowledge innovation is a complex process from knowledge creation, knowledge dissemination to knowledge application. Patents are only the product of knowledge creation and not all patents can be transformed into economic value.
With the implementation of the national innovation-driven strategy in China, various cities gather innovative resources such as diverse talents, more innovative partners, face-to- face communication opportunities, and high job mobility to promote knowledge transfer and innovation generation. Accordingly, innovation has become the most important city function and causes the reconstruction of urban space system (Lyu et al., 2009; Lyu and Li, 2010). Some scholars measure the innovation function index and specialization index of different industries in Beijing with the published papers and patents (Lyu et al., 2014). Others compare the technical innovation functions in Beijing and Shanghai by using the location quotient based on basic and non-basic function (Zhang, 2012), or analyzes the urban Innovation Functions in Guangdong Province by using urban innovation flow intensity (Hu et al., 2015). The function of knowledge innovation is an important part and basis of the city’s innovation function (Sun, 2013; Zeng et al., 2021). Scholars constructed seven indicators from the richness of knowledge, knowledge acquisition and knowledge output, and based on the analytic hierarchy process to assign weights to obtain the score the urban knowledge innovation function (Sun, 2013). Nevertheless, it is also difficult to accurately reflect the knowledge innovation function of the city because the dimensions above literature are still limited and the method is not calculated according to the measurement of the city function.
The factors for the formation and development of urban functions have also undergone significant changes along with urban human activities. In the initial stage of city formation, natural factors such as topography, climate, hydrology, soil, resources, and ecological environment and population factors are the basis for the formation of urban functions (Liu and He, 2015; Zeng et al., 2020). With the continuous progress of society, cities are gradually adapting to changes in social productivity and taking on different functions. The influence of human factors on functions has increased significantly and technology, transportation, information technology, globalization, and government have become important factors for the evolution of urban functions (Yang and Zhao, 2000; Wang and Xu, 2004). Among all these factors, information technology, directly or indirectly have impact on urban functions by affecting the city’s economy, society, culture, management system, infrastructure, etc. (Yan and Zhou, 2003). Although some scholars have proposed that the evolution of urban functions are mainly affected by the city’s own internal factors and external driving factors (Fang et al., 2019; Hu et al., 2021), there is a lack of empirical analysis of modern urban functions. Other scholars have quantitatively investigated urban management functions, research and development functions and knowledge-intensive functional specialization level (Liu and He, 2015; Liu et al., 2020), but the index selection is not comprehensive, and the factor analysis of urban knowledge innovation function has not yet been involved. In the context of the innovation era, it is necessary to further study the factors that affect the city’s knowledge innovation function, which is conducive to the development of the city’s innovation function.
To sum up, knowledge innovation function has become an important basis for the formation and development of urban innovation function, but there is no systematic analysis and measurement of knowledge innovation function in existing literature. Based on 182 prefecture-level cities (and higher level cities) in China, combined with the concepts of knowledge innovation in management and economics and urban functions in geography, this paper constructs a framework for urban knowledge innovation functions, and establishes a set of measurement methods for urban knowledge innovation functions. It firstly explores the spatial pattern of China’s urban knowledge innovation function with the spatial autocorrelation analysis, and then analyzes the influencing factors with the geodetectors. This work could not only provide a reference for the construction of China’s knowledge-innovative cities and the optimization of the national innovation and development pattern, but also enrich the theoretical research on urban functions and knowledge innovation.

2 Urban knowledge innovation function and measurement framework

American scholar Amidon first proposed the concept of knowledge innovation, and believed that knowledge innovation is to create, evolve, exchange and apply new ideas and transform them into market-oriented products and services with the goal of normal operation of the national economy and healthy development of enterprises (Amidon, 1997). Drucker believes that knowledge innovation is the act of endowing knowledge resources with new wealth-creating capabilities (Drucker, 1999). Chinese scholars believe that knowledge innovation refers to the innovation of basic research in the narrow sense (He et al., 2005; Yan, 2010); in the broad sense, knowledge innovation refers to the whole process of the creation, dissemination, and application of new knowledge to developing a new product to realize its economic value. These processes are not a linear relationship, but a chain process and feedback mode, and each stage is inseparable from the participation of other stages (Yan, 2000). Cities are places where populations are concentrated, and where knowledge is mainly produced, disseminated, and applied. Knowledge innovation is mainly achieved through three forms: (1) Knowledge innovation through research and development (R&D) activities, in which talents, enterprises and scientific research institutions are the key agents of urban knowledge innovation (Zhu, 2007; Yigitcanlar and Lönnqvist, 2013); (2) Knowledge innovation occurs in the process of knowledge production, dissemination, exchange and application of innovation agents (Inkinen and Suorsa, 2010; Zhang and Gao, 2011); (3) Enterprises introduce new knowledge into economic use to promote knowledge transformation (Asheim and Coenen, 2005). According to the meaning of urban function and knowledge innovation, this paper believes that urban knowledge innovation function refers to the tasks undertaken and the roles played in the process of knowledge creation to meet the needs of survival and development in the new era of human beings, dissemination and application, which is based on the internal knowledge stock and external practice conditions. The internal knowledge stock includes the city’s own knowledge scale and the new knowledge continuously created through external practice conditions (Wang, 2019). The external practice conditions involve the creative ability, absorption and dissemination ability, application ability of various innovation agents and the innovation environment provided by the city (Song, 2013).
For the measurement of urban functions, Zhou Yixing proposed “three elements of urban functions” including specialized departments, functional scale and functional intensity (Zhou and Bradshaw, 1988). However, Zhang Fuming et al. believe that specialized departments are a status symbol for a certain industry in comparison with other industries for a single city. If the specialization level of a certain department is higher, the functional intensity will be greater, so the specialized department cannot be paralleled placed with the functional intensity (Zhang and Guo, 1999). The impact of urban economic activities is spatial. The functions that serve areas outside the city are basic functions, and the functions that serve the city itself are non-basic functions. Therefore, urban functions also have the characteristics of functional scales (Zhang and Guo, 1999; Fan, 2009). This paper comprehensively measures the function of urban knowledge innovation from different aspects. The scale of function is the basis of knowledge innovation, which is reflected in the accumulation of urban knowledge. The intensity of function is the measure of the professional level of knowledge innovation. The scale of function is the influence of urban knowledge innovation in the spatial perspective. The vitality of function is the enthusiasm and action of the city in the process of knowledge innovation.
Magnitude of function: it is the quantitative feature of urban functions, and the measurement standards of functional vary among different functional components (Zhang and Guo, 1999). The magnitude of knowledge innovation function mainly depends on the stock of urban knowledge that is divided into explicit knowledge and tacit knowledge. Papers and patents belong to coded knowledge, which can reflect the stock of explicit knowledge in the city. Tacit knowledge originates from experience and tends to be highly localized, and spatial distance plays an important role in its spreading process (Charlie et al., 2014). The spillover effect believes that geographical proximity is more conducive to face-to-face informal interaction. When knowledge-intensive geographical elements are more concentrated and distributed, it is more conducive to the generation of tacit knowledge (Asheim et al., 2009). Knowledge-intensive service industries are crucial in the process of spreading knowledge innovation and they require as well as produce more tacit knowledge than the knowledge-intensive manufacturing industry (Muller and Zenker, 2001; Zhao et al., 2017).
Intensity of function: it refers to the strength of the central function maintained by the center of the functional area, and the centrality gradually weakens as the distance from the center gradually increases. The higher the professional level of urban knowledge innovation, the higher the intensity of knowledge innovation functions. Scholars often use location quotient or specialization index to effectively analyze the intensity of knowledge innovation (Hu et al., 2021; Zhang et al., 2021). Because the population density and economic development level of each city are different, there is a certain deviation in measuring the strength of urban knowledge innovation functions only by the number of employees or output value of knowledge-intensive industries. Regarding that the attractiveness of the market or labor force is slightly greater than that of knowledge or technology for some knowledge industries in cities, the intensity of knowledge innovation function can also be measured according to the average output value of the population, that is, the concentration coefficient (Hu and Du, 2011).
Scale of function: The influence of urban knowledge innovation activities is spatial, which gradually weakens with the increase of geographical distance. In terms of spatial impact, it includes: (1) activities that provide knowledge production and innovation services for other areas outside the city itself; (2) activities that provide knowledge production and innovation services for the city itself (Charlie et al., 2014). The influence of urban knowledge innovation is mainly achieved in two ways. One is knowledge diffusion through papers and patents. It is reflected in centrality degree in terms of function according to the centrality theory (Zhang, 2012). When there are surplus goods and services in the central place and insufficient goods and services in the surrounding areas, the remaining part of the goods and services in the center is used to supplement the surrounding area (Christaller, 1998). The other way is to transfer knowledge through industries. This paper mainly measures the function scale of knowledge innovation for these two knowledge dissemination methods.
Vitality of function: Urban vitality is defined as the degree to which a city supports its own functions, economic and social resources and development elements, and reflects the ability and potential of urban development to a certain extent (Lei et al., 2022). The vitality of urban knowledge innovation functions refers to the support degree of such functions to urban knowledge innovation activities and the potential to promote their sustainable and healthy development. It is manifested in the vitality of knowledge creation, the speed of knowledge updating and the level of knowledge application in the whole process of knowledge innovation. These three elements together determine the vitality of knowledge innovation. The vitality of knowledge creation refers to the city’s support for knowledge discovery, knowledge learning and knowledge creation, and will stimulate its creative vitality by providing necessary human, financial and material support (Xie, 2015). One of the important criteria for vitality is that the city’s knowledge is constantly updated and changed. The speed of knowledge update is the speed at which new knowledge is created by urban knowledge innovation agent after absorbing, transferring, and processing the original knowledge (Lyu et al., 2017). The ultimate form of knowledge innovation is to transform knowledge into products and obtain corresponding profits in the market. The higher the ability to apply knowledge, the more it can promote knowledge transformation. The output value of knowledge-intensive industries is an important manifestation of knowledge application (Han et al., 2013). To summarize, a theoretical analysis framework for the function and measurement of urban knowledge innovation is established (Figure 1).
Figure 1 A theoretical analysis framework for the function and measurement of urban knowledge innovation

3 Data sources and research methods

3.1 Data sources

Due to the lack of relevant statistical data in some cities in China, this paper only selects 182 prefecture-level cities and higher-level cities as the study areas, including all (49) first-tier, new first-tier, and second-tier cities, 55 third-tier cities, 53 fourth-tier cities and 25 fifth-tier cities. Among them, there are 87, 66 and 29 cities in the eastern, central and western regions respectively. The sample cities include 64 of the top 72 cities in the 2020 National Innovative Cities Innovation Capability Evaluation Report. Most of the sample cities are cities with a relatively high level of economic development and large population in China, and few are cities with a low level of economic development. The multi-type, multi-level, and multi-regional sample cities can basically reflect the overall knowledge innovation function level, hierarchy and spatial pattern in China.
This paper selects the average value of 5-year data from 2015 to 2019 to comprehensively analyze the functions of urban knowledge innovation and its influencing factors. Since the output value data of knowledge-intensive service sub-sectors in 2018 and 2019 are lacking for most cities, the average value of the three-year data from 2015 to 2017 is selected to measure the output value of the knowledge-intensive service industry in each city. The paper publication data comes from China National Knowledge Infrastructure (CNKI), the patent application authorization data comes from the national patent information service platform, the knowledge-intensive service industry enterprise data comes from Qichacha, and the PM2.5 data comes from the website of Washington University in St. Louis (https://sites.wustl.edu/acag/datasets/surface-pm2-5/), PM2.5 data (μg/m3) of each city in China is calculated according to Global/Regional Estimates (V5.GL.02), and other data are come from the Statistical Yearbooks of Chinese cities. According to the definition and classification of knowledge-intensive industries by the Organization for Economic Cooperation and Development (OECD), the National Bureau of Statistics of China and relevant scholars (OECD, 2001; Wu and Wang, 2003), with the “National Economic Industry Classification (GB/T4754-2017)” as the standard, a total of 13 types of industries are selected to represent knowledge-intensive industries. Taking references of the knowledge-intensive results measured by previous researchers, the weight coefficients of various industries in knowledge- intensive industries are calculated using AHP method (Zhao, 2013) (Table 1).
Table 1 Specific industry sectors and their weight coefficients of knowledge intensive industry
Knowledge-intensive manufacturing Weights Knowledge-intensive service industries Weights
C26 Chemical raw materials and chemical manufacturing 0.031 I Information transmission, software and information technology services 0.122
C27 Pharmaceutical manufacturing 0.015 J Finance 0.192
C34 General equipment manufacturing 0.031 L Leasing and business services 0.045
C35 Special equipment manufacturing industry 0.032 M Scientific research and technical services 0.312
C36 Automotive manufacturing 0.049
C37 Railway, shipbuilding, aerospace and other transportation equipment manufacturing 0.049
C38 Electrical machinery and equipment
manufacturing
0.037
C39 Computer, communications and other
electronic equipment manufacturing
0.073
C40 Instrumentation manufacturing 0.009

3.2 Research methods

3.2.1 Measurement methods for urban knowledge innovation functions

(1) Evaluation methods for the scale of function
The explicit knowledge stock of a city (X1) is measured in this study using the ratio of “number of publications” and “number of patent applications” in a city to the average number of papers and patents in sample cities. The ratio of the number of knowledge-intensive service firms to the area of urban built-up areas represents the density of knowledge- intensive service industries (excluding residential areas). The urban tacit knowledge stock (X2) is calculated by the ratio of employment in knowledge-intensive service industries multiplied by density of knowledge-intensive service industries to the average value of sample cities. The following equation can be used to determine the knowledge stock (X):
${{X}_{1}}=\frac{{{m}_{i}}}{\frac{1}{n}\sum\limits_{i=1}^{n}{{{m}_{i}}}}, {{X}_{2}}=\frac{{{m}_{j}}}{\frac{1}{n}\sum\limits_{j=1}^{n}{{{m}_{j}}}}, {{m}_{j}}={{P}_{j}}\times \frac{{{E}_{j}}}{{{S}_{j}}}, X={{X}_{1}}+{{X}_{2}}$
where X1 is the dominant knowledge stock in region i, n is the number of sample cities, mi is the number of publications and patent applications in region i; X2 is the tacit knowledge stock in region i, mj is the product of the number of employed people in knowledge-intensive service industries and the density of knowledge-intensive service enterprises in region i. Pj is the number of employed people in knowledge-intensive service industries, Ej is the number of knowledge-intensive service enterprises in the i region, Sj is the built-up area of the city (excluding residential area), X is the total knowledge stock of i cities, that is, the magnitude of knowledge innovation functions.
(2) Evaluation method for the intensity of function
$C{{C}_{ij}}={\frac{{{Q}_{ij}}}{{{P}_{i}}}}/{\frac{{{Q}_{j}}}{P}}\;$
where CCij is the concentration coefficient of the j industry in i-city; j refer to the knowledge-intensive industry; Qij is the output value of the j industry in i-city; Pi is the population of the i region; Qj is the total industrial output value of the sample city; P is the total population of the sample cities. If the coefficient is greater than 1, the industry is relatively concentrated.
${{R}_{ij}}={\frac{{{m}_{ij}}}{m}}/{\frac{{{M}_{ij}}}{M}}\;$
where Rij is the specialization index of the j industry in the i city; j refer to the knowledge-intensive industry; mij is the output value of the j industry in the i city; m is the total output value of all industries in the i city; Mij is the total industrial output value of the sample city; M is the gross output value of all industries in the sample cities. If the specialization index is greater than 1, the industry is considered to be a specialized sector in the region.
(3) Evaluation methods for the scale of function
In order to measure the degree and level of centrality of urban scientific and technological activities, Hu Xiaohui et al. applied Christaler’s centrality theory to quantify the external service influence of urban scientific and technological innovation activities (Hu and Du, 2011). In order to assess the degree and level of centrality of urban knowledge innovation activities, the number of papers published and the number of patents issued are utilized to compute the knowledge innovation centrality index in this study. The formula is as follows (Hu and Du, 2011; Zhang, 2012):
${{Y}_{i}}=[{{X}_{i}}-{mean(X)]}/{\sigma }\;, mean(X)=\frac{1}{n}\sum\limits_{i=1}^{n}{{{X}_{i}}}, \sigma =\sqrt{\frac{1}{n-1}\sum\limits_{i=1}^{n}{{{\left[ {{X}_{i}}-mean(X) \right]}^{2}}}}$
where Xi is the number of patents granted and published in the i city, mean(X) is the average of the number of patent grants and papers published in the sample city, σ is the standard deviation, and Yi represents the centrality index of knowledge innovation activities in the i city. If the value is greater than 1, it indicates that it has a certain national status, and the larger the value is, the stronger the external service ability of urban knowledge innovation has.
The intensity of urban knowledge flow refers to knowledge flow that a city exports to other cities in the regional urban system, reflecting the city’s capacity to provide external knowledge services (Zeng and Shen, 2015). This study uses the number of people employed and the production value of knowledge-intensive companies to measure the intensity of information flow. The formula is:
$F={{N}_{ij}}\times {{E}_{ij}}$
where F is the intensity of urban knowledge flow, Nij is the benefit of urban knowledge function, that is, the actual impact of the outward service function of a city, and Eij is the amount of the urban outward knowledge service function.
With the help of the principle of location quotient, the basic part of the employees in the knowledge-intensive industrial sector of the city can be calculated, that is, the functional amount of the city’s outward knowledge service. The location quotient of the employees of the j department in the i city is Rij:
${{R}_{ij}}={\frac{{{m}_{ij}}}{m}}/{\frac{{{M}_{ij}}}{M}}\;$
where j is a knowledge-intensive industry; mij is the number of employees in the j industry in the i city; m is the total number of employees in all industries in the i-city; Mij is the total employment of industry in the sample city; M is the total number of employees employed in all industries in the sample cities. Location quotient Rij>1, it indicates that the j department of i city has an outward service function, because the proportion of total employees in i city is allocated to the j sector exceeds the national allocation, and this department can provide services to areas outside the city (Zhu and Yu, 2002).
Eij is used to represent the outward service function of the j sector of i, which can be defined as the basic activity part of the employees in the j department, that is, the number of people with external service capabilities in the j sector of i. When Rij > 1, there are:
${{E}_{ij}}={{G}_{ij}}-{{G}_{i}}({{{G}_{j}}}/{G)={{G}_{ij}}(1-{1}/{{{R}_{ij}})}\;}\;$
where Gij is the number of employees in the j department of i; Gi is the number of employees in i cities; Gj is the number of employees in the j sector in the sample city; G is the total number of employees in the sample cities.
Nij is used to represent the efficiency of outward service functions in the j sector of i, and it is characterized by the per capita GDP of employees in the j sector of i, then there are:
${{N}_{ij}}={GD{{P}_{ij}}}/{{{G}_{ij}}}\;$
where GDPij represents the GDP of the j sector of i.
Fi represents the knowledge flow intensity of all the industrial sectors with external knowledge innovation service capabilities, then there are:
${{F}_{i}}=\sum\limits_{j=1}^{n}{{{N}_{ij}}{{E}_{ij}}}$
(4) Methods for evaluating vitality of function
The support of people, resources, and materials is essential to the vitality of knowledge creation. R&D professionals, college students, and professors being major subjects of knowledge creation. Scientific research is primarily supported by the financial spending of scientific research and the internal expenditure of R&D money (Lyu et al., 2017). Information technology enables businesses to acquire more knowledge and other innovative resources more effectively and affordably, and the selection of an Internet broadband access port denotes tangible support for knowledge innovation (Han et al., 2013). The formula is:
$O=\frac{{{f}_{ij}}}{\frac{1}{n}\sum\limits_{i=1}^{n}{{{f}_{ij}}}}+\frac{{{p}_{ij}}}{\frac{1}{n}\sum\limits_{i=1}^{n}{{{p}_{ij}}}}+\frac{{{h}_{ij}}}{\frac{1}{n}\sum\limits_{i=1}^{n}{{{h}_{ij}}}}$
where O is the knowledge creation ability index, n is the number of sample cities, fij is the number of research and experimental development (R&D) personnel, university students and teachers in i city, pij is the financial expenditure of scientific research and internal expenditure of research and experimental development (R&D) funds in i city, and hij is the number of Internet broadband access ports in i city.
The annual rise in papers and patents is chosen to assess the rate of knowledge update since new knowledge is frequently created in the form of papers and patents. The formula is:
$V=\frac{1}{n}\sum\limits_{i=1}^{n}{\frac{\left( {{x}_{i+1}}-{{x}_{i}} \right)m}{{{X}_{i+1}}-{{X}_{i}}}}$
where V is the value of knowledge update rate, xi is the number of papers published and patent output in the most recent ith year of the city, Xi is the total number of papers published and the total patent output in the recent ith year of the sample city, m is the number of sample cities, V represents the rate of paper or patent update in the city in the past n years, if V is greater than 1, it means that the city’s knowledge update rate exceeds the average level of the sample city, and vice versa.
This paper comprehensively measures the knowledge application capacity of the city from two perspectives, one is to consider the ratio between the city and other cities from the city perspective, analyze the status of the city’s knowledge application ability in the country, and the other is to consider the ratio of the output value of the city’s knowledge-intensive industries to the output value of all other industries from the industry perspective, and analyze the status of the city’s knowledge application ability within the city. The formula is:
${{G}_{1}}=\frac{{{g}_{i}}}{g},{{G}_{2}}=\frac{{{p}_{i}}}{p}, G={{G}_{1}}+{{G}_{2}}$
where G is the knowledge application ability index, gi is the output value of knowledge- intensive industries in city i and g is the total output value of the industry in the sample city, G1 is the ratio of the output value of the industry in the city to the output value of the industry in all sample cities. Where pi is the output value of knowledge-intensive industries in city i and p is the total output value of all industries in city i, G2 is the ratio of the city’s knowledge industry to the total output value of all industries in the city.
(5) Entropy method
The weight coefficients of the above eight methods are calculated following the entropy value method (Table 2), the scores of each basic layer (eight major methods) are obtained according to the linear weighted synthesis method, and the weight coefficients of each basic layer for the target layer (functional scale, functional vitality, functional intensity and functional magnitude) are calculated based on the basic layer score, and the score of the target layer is obtained, and finally the comprehensive score of each urban knowledge innovation function is obtained.
${{S}_{i}}=\sum\limits_{j=1}^{m}{{{W}_{j}}\times {{Z}_{ij}}}$
where Si represents the total score of the knowledge innovation function of the city i, Zij is the target layer indicator score calculated by linear weighting, and Wj represents the target layer indicator weight. When Si is the index score of a basic layer, Zij is the basic layer data, Wj is the weight of each functional measurement method relative to the basic layer, and m is the number of indicators.
Table 2 Weight assignment for the evaluation index of urban knowledge innovation function
Target layer Weights Basic layer Weights
Magnitude of function 0.237 Explicit knowledge stock (X1) 0.637
Tacit knowledge stock (X2) 0.363
Intensity of function 0.247 Concentration coefficient of knowledge-intensive industries (CCij) 0.562
Knowledge innovation function specialization index (Rij) 0.438
Scale of function 0.265 Knowledge innovation centerness index (Yi) 0.582
Knowledge flow intensity (F) 0.418
Vitality of function 0.251 Knowledge creation ability index (O) 0.304
The knowledge update rate value (V) 0.349
Knowledge application ability index (G) 0.348

3.2.2 Spatial autocorrelation

Spatial autocorrelation analysis is an analysis method to study whether the observed value of a spatial unit is correlated with the observed value of its adjacent unit, and it is a measure of the degree of concentration of the observed values of a spatial unit (Wei et al., 2022). Global spatial autocorrelation analysis can describe the overall spatial distribution and significance of urban knowledge innovation functions, which is often measured by Moran's I. The value is [-1, 1], and greater than 0 indicates that there is a positive spatial correlation between cities. The larger the value, the larger correlation between the spatial units, less than 0 means that the overall distribution is negatively correlated, the greater the absolute value, the greater the spatial difference, 0 means that there is no spatial autocorrelation, and the distribution is random in space. To further identify outliers, the local spatial autocorrelation (LISA) measures the degree of correlation between each spatial unit, and identifies the spatial spillover characteristics of knowledge innovation between each city and other cities.

3.2.3 Geographic detector

The geographic detector model is a statistical method to examine spatial variability and reveal the driving factors behind it, among which factor detection can better represent the similarity in the same region and the varieties between different regions, interaction detection can identify interactions between different influencing factors (Wang, 2017). The formation and evolution of urban functions are the result of the joint influence of multiple factors, so this method is suitable to explore the influencing factors of the differential development of urban knowledge innovation functions. The factor detector can detect whether each potential factor is an influencing factor of the development of urban knowledge innovation function, measured by q value. Interaction detectors illustrate the strength and type of interaction by comparing it with the q value of a single factor (Table 3). The formula for calculating the q value is as follows:
$q=1-\frac{\sum\limits_{m=1}^{n}{Nm\sigma _{m}^{2}}}{N{{\sigma }^{2}}}$
where q is the explanatory power detection index of each influencing factor on the urban knowledge innovation function; m=1,..., n; n is the layer of variable Y or factor X, i.e. classification or sub-region; Nm and N are layer m and the number of all sample cities; According to the natural break point, the respective variables were divided into 7 categories and converted into type variables. σ2m and σ2 are the discrete variances of the Y values for the m layer and all sample cities. The value range of q is [0,1], and the larger the q value, the stronger the explanatory power of this influencing factor on the urban knowledge innovation function.
Table 3 Interaction types and the judgement criteria of geographic detectors
Interaction types Judgement criteria
Two-factor enhancement q(X1X2)>Max[q(X1), q(X2)]
Nonlinear enhancement q(X1X2)>q(X1)+q(X2)
Nonlinearity attenuation q(X1X2)<Min[q(X1), q(X2)]
One-way nonlinearity attenuated Min[q(X1), q(X2)]<q(X1X2)<Max[q(X1), q(X2)]
Independent q(X1X2)=q(X1)+q(X2)

4 Measurement and spatial characteristics of knowledge innovation function in Chinese cities

4.1 Magnitude of knowledge innovation function

Magnitude of knowledge innovation function among Chinese cities varies greatly. The distribution of knowledge stock in each city is uneven. It is highly concentrated in a few developed cities and is mainly concentrated in Beijing-Tianjin, the Yangtze River Delta, the Pearl River Delta and the central and western regions along the eastern coast. A few developed regions have formed a development pattern centered on Beijing and Shanghai, with Shenzhen, Guangzhou, Chengdu, Nanjing, Hangzhou, Tianjin, Suzhou, Chongqing, Wuhan, Xi’an, Zhengzhou, Changsha and Ningbo as sub-cores (Table 4, Figure 2). The stock of knowledge in Beijing is much higher than that of other cities in the country, and the cities with a score higher than the sample average (0.012) are mostly provincial capitals or sub-central cities. The stock of tacit knowledge in most cities is lower than the stock of explicit knowledge. In addition the variation in the stock of tacit knowledge is also larger than the explicit knowledge stock.
Table 4 Scores of specific indexes and comprehensive scores of knowledge innovation functions in the top 10 cities
Cities Explicit knowledge stock Tacit
knowledge stock
Industrial concentration coefficient Specialization index Knowledge
innovation
centerness index
Knowledge
flow intensity
Knowledge
creation
Beijing 28.435 47.707 6.683 1.750 7.710 11734818 24.222
Shenzhen 13.986 11.874 11.753 1.588 2.934 10444050 14.173
Shanghai 18.152 19.773 4.969 1.425 4.640 7730270 21.297
Nanjing 12.057 3.200 3.521 1.295 3.034 9791998 10.222
Guangzhou 14.092 11.472 4.239 1.316 3.393 2909989 15.207
Suzhou 9.520 2.674 4.443 1.393 1.906 7820685 9.841
Dongguan 5.462 0.319 6.662 1.180 0.767 5386130 5.845
Tianjin 9.903 2.665 3.028 1.289 2.231 2492951 12.402
Chengdu 10.956 12.456 1.595 1.254 2.572 467761 13.064
Hangzhou 9.008 5.328 3.319 1.269 1.902 1638348 9.771
Cities Knowledge
update
Knowledge
application
Functional
magnitude score
Functional
intensity score
Functional
scale score
Functional
vitality score
Synthesis
score
Beijing 8.097 1.645 0.237 0.187 0.265 0.150 0.838
Shenzhen 25.153 2.162 0.095 0.236 0.164 0.182 0.678
Shanghai 11.214 2.068 0.132 0.145 0.170 0.160 0.607
Nanjing 5.807 3.653 0.069 0.119 0.159 0.148 0.496
Guangzhou 18.936 1.460 0.095 0.129 0.101 0.149 0.475
Suzhou 2.227 2.229 0.055 0.137 0.120 0.101 0.412
Dongguan 10.816 2.400 0.029 0.149 0.075 0.118 0.372
Tianjin 4.008 0.676 0.057 0.113 0.076 0.076 0.321
Chengdu 0.535 1.275 0.080 0.094 0.063 0.082 0.319
Hangzhou 2.432 1.307 0.057 0.115 0.061 0.078 0.312
Figure 2 Spatial distribution pattern of knowledge innovation function among Chinese cities

Note: Based on the standard map with approval number GS(2016)2936 on the standard map service website of the Ministry of Natural Resources, the boundary of the base map has not been modified.

4.2 Intensity of knowledge innovation function

The sample average value (0.051) of the Intensity of knowledge innovation function in Chinese cities is higher than the magnitude, scale and vitality of function, and the spatial distribution has the characteristics of large concentration and small dispersion (Table 4, Figure 2). The high-value areas in the eastern region present a tripartite situation centered on the Beijing-Tianjin, Yangtze River Delta, and Pearl River Delta regions, in which the Pearl River Delta urban agglomeration is the high-density core area, and the Beijing-Tianjin and Yangtze River Delta regions are the sub-density core areas. The distribution of high-value areas in the central and western regions is relatively scattered: developed cities such as Wuhan and Chengdu are with high values, and the intensity of knowledge innovation functions in other regions is relatively low. Although the spatial scope of the highest value and relatively higher value areas is not significantly expanded compared with the magnitude, scale and vitality of function, the area of the lowest value area in the central and western regions is significantly reduced.

4.3 Scale of knowledge innovation function

The spatial distribution of high-value areas and low-value areas of the knowledge innovation function scale in Chinese cities is extremely polarized, and there is a significant gap in the ability of knowledge innovation outward services between cities (Table 4, Figure 2). The high-value areas present an obvious point-like distribution, of which Beijing-Tianjin, the Yangtze River Delta and the Pearl River Delta in the east are the three point clusters with the highest core density, and Chengdu, Chongqing, Xi’an, and Wuhan in the central and western regions are the secondary core areas. These cities and regions undertake the the division of highly specialized knowledge innovation beyond the scope of their hinterland. The low-value areas in the central and western regions show obvious planar distribution characteristics, these areas undertake the division of lowly specialized knowledge which are the basic needs of the city to maintain its normal operation and meet the development of knowledge innovation. There is a large gap between the knowledge innovation centrality index measured by papers and patents and the knowledge flow intensity measured by industry. This is because that most cities in China rely on the industries to produce knowledge innovation services.

4.4 Vitality of knowledge innovation function

Cities with relatively high vitality of knowledge innovation functions in China are mainly distributed in the Beijing-Tianjin, Yangtze River Delta and Pearl River Delta regions along the eastern coast and a few developed cities in the central and western regions along the river, forming a large triangle of vitality with Shenzhen, Guangzhou, Beijing, Shanghai and Wuhan, with a spatial pattern of large concentration and small dispersion (Table 4, Figure 2). The center of gravity of the overall vitality lies in the south of the Huaihe River in the Qinling Mountains. Shenzhen, Guangzhou, Shanghai and Beijing (0.119-0.182) belong to the cities with high vitality of knowledge innovation function in the country. Wuhan, Nanjing, Dongguan, Qingdao, Tianjin, Zhengzhou, Chongqing, Foshan, Chengdu, Suzhou, Hangzhou and Hefei (0.071-0.118) belong to the cities with relatively high vitality of knowledge innovation function, and there are 71 cities with higher than the sample average (0.043). Although the knowledge stock of Chinese cities is relatively thin, the overall enthusiasm for knowledge innovation is relatively high.
Overall, the cities with high comprehensive scores for knowledge innovation functions in China are mainly concentrated in the eastern coastal areas and a few provincial capital cities in the central and western regions. The diamond-shaped structure with Beijing-Tianjin, Yangtze River Delta, Pearl River Delta and Shaanxi-Chengdu-Chongqing as the four vertices and central Wuhan-Hefei as the center constitutes China’s five stable knowledge circles. In order to further examine the spatial distribution characteristics of urban knowledge innovation functions, the spatial agglomeration characteristics of urban knowledge innovation functions are analyzed based on the global Moran’s I. The results show that the global Moran’s I is 0.212, and the Z value is 4.205, and the P value is 0.005, which means it has passed the significance test and has statistical significance. This indicates that the overall distribution of knowledge innovation functions in Chinese cities exhibits significant spatial aggregation characteristics, rather than randomly dispersed in geographical space. Based on the local spatial autocorrelation (LISA) feature calculated by the adjacency weight matrix, it is mainly characterized by high-high and low-low agglomeration. The high-high agglomeration in Beijing-Tianjin, the Yangtze River Delta, and the Pearl River Delta is relatively obvious, and there is a significant spatial pattern of high-low agglomeration between Chongqing and neighboring cities. A few cities in the central region present a low-low agglomeration spatial pattern (Table 4, Figure 2).
According to the Jenks natural breakpoint method, all sample cities are divided into four levels, and the level of urban knowledge innovation function gradually increases from bottom to top. Beijing, Shenzhen, and Shanghai are all at the forefront of China in terms of the magnitude, vitality, intensity, and scale of knowledge innovation functions, and can be classified as national knowledge innovation center. Although the scores of 19 cities such as Nanjing, Guangzhou, and Suzhou are lower than those of the first-tier cities, they have a certain foundation and advantages for knowledge innovation and can exert a certain influence on the surrounding areas. They can be classified as regional knowledge innovation centers. Despite the 34 cities ranked in the third level, including Shenyang, Changzhou, and Zhuhai, have low comprehensive scores of knowledge innovation functions, but all of them are above the average score of 0.122. They generate only a certain influence on knowledge innovation in the region, which can be defined as regional knowledge innovation centers. For the cities ranked in the fourth level, their knowledge innovation capabilities are lower than the average level. These cities generally rely on the knowledge diffusion of national or regional knowledge innovation centers, and their innovation is under the influence of knowledge innovation activities in surrounding areas. The conditions for their knowledge innovation are gradually forming, can be classified as a knowledge innovation development centers (Table 5). The development of the “top of the tower” cities mainly benefits from the input of innovative elements and the strong support of national policies, such as municipalities and provincial capitals, etc. The cities of the “body of tower” mainly rely on the development of knowledge-intensive industrial clusters, such as Jiaxing, Xuzhou, Yangzhou, etc., Zhuhai, Zhongshan, and Jiangmen in the Pearl River Delta urban agglomeration, and Shijiazhuang and Baoding in the Beijing-Tianjin-Hebei urban agglomeration together forming a relatively stable pyramid-shaped structure.
Table 5 Types of knowledge innovation functions among 182 cities in China
Hierarchy Characterization Scoring range City
First
level
National knowledge innovation center city (I) 0.5≤Score<1 Beijing, Shenzhen, Shanghai
Second level Regional knowledge innovation center city (II) 0.20≤Score<0.5 Nanjing, Guangzhou, Suzhou, Dongguan, Tianjin, Chengdu, Hangzhou, Xi’an, Wuhan, Chongqing, Zhengzhou, Foshan, Changsha, Qingdao, Wuxi, Hefei, Changchun, Ningbo, Xiamen
Third
level
Local knowledge innovation center city (III) 0.12≤Score<0.20 Shenyang, Changzhou, Zhuhai, Jinan, Dalian, Zhongshan, Yangzhou, Taizhou, Nantong, Zhenjiang, Jilin, Fuzhou, Xuzhou, Weifang, Nanchang, Taiyuan, Jiaxing, Harbin, Kunming, Yancheng, Yantai, Jiangmen, Shijiazhuang, Huizhou, Wenzhou, Weihai, Guiyang, Xiangyang, Baoding, Dongyang, Huizhou, Luoyang, Nanning
Fourth level Knowledge innovation development city (IV) 0≤Score<0.12 Yichang, Lianyungang, Shiyan, Liaocheng, Jinhua, Shaoyang, Ji’an, Qingyuan, Mianyang, Qinhuangdao, Chuzhou, Xingtai, Heyuan, Jingdezhen, Ganzhou, Taizhou, Nanyang, Guilin, Shaoxing, Zibo, Dezhou, Xinxiang, Zhaoqing, Puyang, Ningde, Xinyang, Shantou, Anqing, Yueyang, Huzhou, Shanwei, Jingzhou, Meizhou, Xianning, Liuzhou, Lanzhou, Xiaogan, Shangrao, Chenzhou, Lishui, Xining, Huai’an, Jining, Anyang, Yunfu, Urumqi, Cangzhou, Suqian, Zhangzhou, Quzhou, Binzhou, Yicheng, Maanshan, Heze, Bijie, Jinzhong, Suining, Sanming, Langfang, Meishan, Ankang, Jiamusi, Fuyang, Yuncheng, Bozhou, Handan, Nanping, Yinchuan, Linyi, Huanggang, Chengde, Hengshui, Kaifeng, Leshan, Zigong, Jiujiang, Yangjiang, Lujiang, Qiqihar, Dingxi, Jingmen, Longyan, Shaoguan, Yibin, Anshun, Hohhot, Tangshan, Neijiang, Taian, Linfen, Ziyang, Haikou, Shizuishan, Huaibei, Bengbu, Pingdingshan, Changzhi, Suzhou, Putian, Zaozhuang, Xianyang, Maoming, Huangshi, Jincheng, Lvliang, Tongling, Zhangye, Huangshan, Hanzhong, Siping, Shangqiu, Huainan, Panjin, Laibin, Lu’an, Fuzhou, Sanmenxia, Rizhao, Tongchuan, Yingtan, Suizhou, Baotou, Chizhou, Ordos, Xinyu, Yulin, Jiayuguan

5 Analysis of influencing factors of the space characteristics of knowledge innovation function in Chinese cities

With the progress of the times and social development, the influence of natural factors in the evolution of urban functions is gradually weaker than that of social factors. Urban economic level, industrial structure, government policies, and population structure have become the main factors affecting the evolution of urban functions (Liu and He, 2015; Hu et al., 2021). In the era of knowledge innovation, the location selection or flow of knowledge-intensive labor and industries is the key factor for the formation and development of urban knowledge innovation functions. The growth environment of innovative talents and the development environment of innovative enterprises and universities affect the agent’s knowledge creation, knowledge updating, and knowledge application ability, which in turn affects the formation and development of urban knowledge innovation functions (Ye and Li, 2006; Zhang and Zhang, 2018).
Urban amenities indirectly promote urban innovation and development by attracting talents to reside and work here. The comfortable urban environment includes both physical and social environment. The pursuit of high-quality talents for the urban natural environment is more reflected in the healthy ecological environment, including greening environment and air quality (Lyu et al., 2022). In terms of social environment, urban infrastructures, including information infrastructure and transportation infrastructure that promote knowledge creation and knowledge dissemination, is a necessary condition for knowledge innovation; medical environment and social security are the physical and psychological security that cities provide residents: Medical environment consists of the number of hospitals in the city, the quality of doctors and the comfort of the hospital environment; pension insurance, medical insurance and unemployment insurance are the key living guarantees for innovative talents (Lyu et al., 2022). Government policy and industrial environment not only affect the migration and flow of talented laborers, but also affect the adjustment of industrial structure and industrial agglomeration of enterprises (Guo, 2015). Regional cultural concepts such as the spirit of adventure, the grasp of opportunities, and the pursuit of innovation affect people’s values and behavioral motivations, which are dynamically manifested in the process of individuals’ creativity (Song, 2013; Liu et al., 2020). The differences in the level of economic development influences knowledge innovation ability and knowledge flow of each city, cities with high economic level are more capable of bearing the transaction costs of knowledge cooperation and knowledge innovation. This paper chooses the per capita regional GDP and the balance of various deposits and loans of financial institutions to represent the city’s financial support for knowledge innovation enterprises. A city with an open economy participates in the international division of labor by embedding a global production network, which affects the flow of production factors and resource allocation within the city (Drucker, 1999). The high accessibility of transportation and information networks can effectively reduce the uncertainty of knowledge flow and the transaction costs of knowledge innovation cooperation (Liu et al., 2020). This paper selects foreign direct investment to indicate the openness level of the city’s economy, and uses road and air passenger traffic flow to indicate the degree of the city’s external connection. Using the entropy method to calculate the weight of each influencing factor of the urban innovation function (Table 6), and calculate the scores of each factor layer of each city according to each weight coefficient.
Table 6 Weight of each index of influencing factors of urban knowledge innovation function
Target layer Feature layer Indicator layer Weight Effect
Influencing factors of urban knowledge innovation function Natural (NAT) X1 Area of green space per 10,000 people (hectares) 0.411 Positive indicators
X2 PM2.5 (mcg/m³) 0.589 Negative indicators
Cultural environment
(CUL)
X3 Public library per 10,000 people (10,000 volumes) 0.234 Positive indicators
X4 Number of museums per 10,000 people 0.263 Positive indicators
X5 Number of primary and secondary school teachers (person) 0.289 Positive indicators
X6 Number of general institutions of higher education 0.214 Positive indicators
Infrastructure
(INF)
X7 Number of public (electric) vehicles per 10,000 people 0.324 Positive indicators
X8 Number of taxi operating vehicles per 10,000 people 0.315 Positive indicators
X9 Number of Internet access ports per 10,000 people 0.361 Positive indicators
Medical
environment
(MED)
X10 Number of hospitals (pcs) 0.329 Positive indicators
X11 Number of hospital beds per 10,000 people (seats) 0.340 Positive indicators
X12 Number of practicing (assistant) physicians per 10,000 people 0.331 Positive indicators
Social security environment (SOC) X13 Number of participants per 10,000 people in the basic old-age insurance for urban employees 0.362 Positive indicators
X14 Number of participants per 10,000 people participating in basic medical insurance for urban employees 0.338 Positive indicators
X15 Number of people participating in unemployment insurance per 10,000 people 0.300 Positive indicators
economic environment
(ECO)
X16 Per capita GDP (yuan) 0.429 Positive indicators
X17 RMB deposit balance of financial institutions at the end of the year (10,000 yuan) 0.276 Positive indicators
X18 Balance of RMB loans of financial institutions at the end of the year (million yuan) 0.295 Positive indicators
Industrial environment
(IND)
X19 Tertiary industry as a percentage of GDP (%) 0.505 Positive indicators
X20 Tertiary industry employment as a proportion of total regional employment (%) 0.495 Positive indicators
Openness
Environment
(OPE)
X21 Amount of FDI (US\$ 10,000) 0.347 Positive indicators
X22 Road passenger traffic (10,000 people) 0.478 Positive indicators
X23 Civil air traffic (10,000 people) 0.175 Positive indicators
Policy
environment (POL)
X24 Proportion of financial expenditure on science and technology to total expenditure (%) 1 Positive indicators

5.1 Results of factor detection

In this paper, the comprehensive score of urban knowledge innovation function is used as the dependent variable, and the average score of each influencing factor from 2015 to 2019 is used as the independent variable. The natural breakpoint method is used to stratify the independent variables, and the numerical variables are converted into the categorical variables for factor detection. The degree of influence of each variable on the city’s knowledge innovation function is shown (Table 7). Taking the significance test p < 0.01 as the condition, and q > 0.1 as the criterion for judging the significant degree of influence, the dominant factors affecting the development of urban knowledge innovation functions are natural environment, cultural environment, infrastructure, medical environment, social security, economic environment, industrial environment, open environment and policy environment, the corresponding q values are 0.116, 0.637, 0.561, 0.534, 0.436, 0.436, 0.257, 0.593 and 0.344 respectively. Compared with other leading factors, cultural environment, open environment, infrastructure and medical environment are important factors affecting the development of urban knowledge innovation function. Social security, economic environment and policy environment have higher explanatory power for urban knowledge innovation function. The impact of physical environment on urban knowledge innovation function is weaker than other factors, indicating that in the era of innovation, human and social factors play a dominant role in urban knowledge innovation function.
Table 7 Factor detector results
Impact factor NAT CUL INF MED SOC ECO IND OPE POL
q 0.116 0.637 0.561 0.534 0.436 0.436 0.257 0.593 0.344
p 0.000 0.000 0.000 0.000 0.000 0.000 0.000 0.000 0.000

5.2 Results of interaction detection

Single factor analysis can detect the impact significance and influence mode of the single factor on the spatial difference of urban knowledge innovation function, On the other hand, the interaction detector identifies the interaction between different factors on the development of urban knowledge innovation function. This can facilitate analyzing whether the interaction will increase or weaken the explanatory power of the dependent variable, or whether the influence of these factors on the city’s knowledge innovation function is independent of each other. The results show (Table 8) that the explanatory power of the two-factor interaction on urban knowledge innovation functions is stronger than that of the single-factor effect, the interaction type is mainly two-factor enhancement, and the natural environment (NAT) is mostly nonlinear enhancement. This shows that the spatial differentiation characteristics of urban knowledge innovation functions are not determined by a single factor or a single type of factors, but are simultaneously affected by various factors of the human/social environment. Among them, the economic environment (ECO) and the opening environment (OPE) have the strongest interaction with other factors, followed by the cultural environment (CUL), indicating that the city’s economic foundation, openness and inclusiveness and the cultural atmosphere contributes the most to knowledge innovation, which is the basis for the formation and development of urban knowledge innovation functions. The interactive explanatory power of the opening environment (OPE) and the economic environment (ECO) is the largest at 0.845, followed by the interactive explanatory power of the cultural environment (CUL), the medical environment (MED), the natural environment (NAT) with the economic environment (ECO) (0.832, 0.808, 0.770 respectively). The interaction of the natural environment (NAT) with the industrial environment (IND) only has a certain explanatory power on the city’s knowledge innovation function. This indicates that in the era of knowledge innovation, only the combination of the natural environment with the human and social environment can effectively attract talents’ migration and enterprise’s location, thereby promoting knowledge innovation activities. The interaction between social security (SOC) and opening environment (OPE) has a relatively large impact on the city’s knowledge innovation function (0.812), and the interaction between policy environment (POL) and infrastructure environment (INF) is much greater than its own influence (0.807). This indicates that only government policies supporting the material conditions of knowledge innovation can greatly promote the development of urban knowledge innovation.
Table 8 Results of interaction detection
NAT CUL INF MED SOC ECO IND OPE POL
NAT 0.116
CUL 0.768* 0.637 Strength of explanation
INF 0.698* 0.750+ 0.561 <0.3
MED 0.742* 0.747+ 0.671+ 0.534 0.3~0.5
SOC 0.658* 0.800+ 0.681+ 0.659+ 0.436 ≥0.5
ECO 0.770* 0.832+ 0.762+ 0.808+ 0.730+ 0.436
IND 0.341+ 0.730+ 0.689+ 0.695+ 0.520+ 0.708+ 0.257
OPE 0.706+ 0.762+ 0.798+ 0.771+ 0.812 + 0.845+ 0.700* 0.593
POL 0.586* 0.798+ 0.807+ 0.737+ 0.660+ 0.749+ 0.510* 0.743+ 0.344

Note: * indicates nonlinear enhancement, and + indicates two-factor enhancement.

The explanatory power of the nonlinear interaction between the industrial environment (IND) and the cultural environment (CUL) on the urban knowledge innovation function reaches 0.730, which is much greater than its own explanatory power alone (0.257), indicating that industry-university-research cooperation is more conducive to the organic integration of knowledge creation, processing, dissemination and application, thus promoting joint knowledge activities including knowledge innovation and transfer.

6 Conclusion and discussion

6.1 Conclusions

The knowledge innovation function is an important component and development basis of the urban innovation function. By integrating the knowledge innovation research in economics and management, this paper establishes a research framework for the urban knowledge innovation function from the perspective of urban function in urban geography. Magnitude, intensity, scale and vitality of functions are used to construct a measurement framework for urban knowledge innovation functions, and the empirical analysis is conducted on the knowledge innovation functions of 182 cities in China. Furthermore, spatial autocorrelation analysis methods are used to explore the spatial pattern of Chinese urban knowledge innovation functions, and its influencing factors are analyzed using Geographic detectors analyze, which enriches the research content and research methods of urban innovation functions. The main conclusions are as below:
(1) The function of urban knowledge innovation refers to the tasks and roles it undertakes in the process of knowledge creation, knowledge dissemination and knowledge application to meet the needs of human survival and development in the new era, which is based on the internal knowledge stock and external practice conditions. Magnitude of function is the basis of knowledge innovation, which is reflected in the stock of urban knowledge; Intensity of function measures the professional level of knowledge innovation; Scale of function is the spatial influence of urban knowledge innovation; Vitality of function refers to the enthusiasm and action in the process of knowledge innovation, these four dimensions can comprehensively reflect the level of the city’s knowledge innovation function.
(2) China’s urban knowledge innovation function develops in an unbalanced manner. Those with larger magnitude, intensity, scale and vitality of knowledge innovation function are mainly located in the eastern coastal areas and a few developed areas in the central and western regions. The diamond-shaped knowledge innovation structure with the Pearl River Delta, Shaanxi, Chengdu and Chongqing as the four apexes and central Wuhan and Hefei as the center, presents the characteristics of large concentration and small dispersion. According to the Jenks natural breakpoint method, all sample cities are divided into four levels. Beijing, Shenzhen, and Shanghai are national-level knowledge innovation center cities, and 19 cities including Nanjing and Guangzhou are classified as regional-level knowledge innovation center cities; Shenyang, Changzhou and other 34 cities are local knowledge innovation center cities, and 126 cities including Yichang are forming knowledge innovation conditions, which are classified as knowledge innovation development cities.
(3) The natural environment, cultural environment, infrastructure, medical environment, social security, economic environment, industrial environment, open environment, and policy environment are the main variables influencing the development of urban knowledge innovation functions. Among which, human and social factors have a dominant influence on urban knowledge innovation function; followed by cultural environment, open environment, infrastructure environment and medical environment as important factors affecting the development of urban knowledge innovation function; and natural environment only has a relatively weaker impact on urban knowledge innovation function. The two-factor interaction analysis shows that the spatial differentiation of the urban knowledge innovation function is affected by various factors of the human environment at the same time, among which the economic environment and the opening environment have the strongest interaction with other factors, followed by the interaction of the cultural environment and other factors. In contrast, only when the natural environment is combined with the human and social environment can it effectively attract talents’ migration and enterprises’ location, thereby promoting knowledge innovation activities.

6.2 Discussion

The aforementioned research findings suggest that one key strategy for cities seeking to become more competitive in the knowledge economy is to cultivate and strengthen their innovation functions. The primary policy recommendations are as follows.
(1) Cities should comprehensively promote their functions of urban knowledge innovation, along with the magnitude of knowledge stock, the intensity, vitality and outward spatial influence of urban knowledge innovation should be also paid attention. Cities should create a knowledge innovation environment in line with the development of innovation agents based on the growth and development needs of talents and enterprises, scientifically allocate innovation resources, stimulate the creative vitality of innovation subjects, form strong knowledge specialization and advantages in some fields, and strengthen the degree of knowledge centrality and forming a strong knowledge radiation force.
(2) In accordance with the requirements of the era of knowledge economy development, cities should formulate policies and measures suitable for the development of knowledge economy by fully considering the status quo and characteristics of their own knowledge economy development. National knowledge center cities should strive to become a global and national source of knowledge innovation, build a global science and technology innovation center, drive national science and technology development, and influence global science and technology development. Regional-level knowledge innovation cities should form advantages and influences in certain knowledge fields, promote the close integration of knowledge innovation processes within and between industry-university-research institutes, and create knowledge-innovation industrial zones through rational layout of industry-university-research locations and policy incentives; for local knowledge innovation cities and knowledge innovation development cities, they should establish knowledge innovation networks led by different innovation subjects according to local market demand and economic development environment, aiming to build knowledge input “channels” and environments, and promote the improvement of regional knowledge absorption rate. To maximize the spillover effect of knowledge innovation, it is necessary not only to strengthen the number of external innovation connections, but also to pay attention to the mode of external innovation cooperation. That is, combining the local diffusion within the cluster with the pipeline diffusion between cities, and building a collaborative governance mechanism between cities to reduce the geographical distance restrictions and institutional barriers for the flow of innovation elements across regions, thus broadening the spatial scale of knowledge innovation function. In terms of spatial strategies, the five knowledge innovation circles of Beijing-Tianjin, the Yangtze River Delta, the Pearl River Delta, Shaanxi-Chengdu- Chongqing, and Wuhan and Hefei in the central part should function as the core guidance to drive the coordinated development of knowledge innovation center cities in surrounding areas.
(3) It is necessary to strengthen the construction and improvement of the major factors influencing the knowledge innovation function. Strengthening the dominant position of human and social factors in the construction of urban knowledge innovation functions, that is, strengthening the construction of urban cultural environment, open environment, infrastructure and medical environment, creating a better livable place for enterprises and talents, and promoting knowledge innovation activities.
Theoretical research and practical construction of the knowledge innovation function are still in its initial stage, and the evaluation of the knowledge innovation function and the establishment of a scientific and reasonable evaluation index system would remain an important and challenging topic for a long period of time in the future. In future research, it is necessary to further modify the evaluation system of urban knowledge innovation functions, such as incorporating different functional categories such as labor-intensive industries and natural resource-intensive industries into the evaluation index system, or adding the structure dimensions of function to comprehensively analyze the city’s knowledge innovation functions.
[1]
Amidon D M, 1997. Innovation Strategy for the Knowledge Economy:The Ken Awakening. Boston: Butterworth-Heinemann.

[2]
Asheim B T, Coenen L, 2005. Knowledge bases and regional innovation systems: Comparing nordic clusters. Research Policy, 34(8): 1173-1190.

DOI

[3]
Asheim B, Hansen H K, 2009. Knowledge bases, talents, and contexts: On the usefulness of the creative class approach in Sweden. Economic Geography, 85(4): 425-442.

DOI

[4]
Bathelt H, Malmberg A, Maskell P, 2004. Clusters and knowledge: Local buzz, global pipelines and the process of knowledge creation. Progress in Human Geography, 28(1): 31-56.

DOI

[5]
Bjørn Asheim, Høgni Kalsø Hansen, 2009. Knowledge bases, talents, and contexts: on the usefulness of the creative class approach in Sweden. Economic Geography, 85(4): 425-442.

DOI

[6]
Carrillo F J, Yigitcanlar T, García B et al., 2014. Knowledge and the City: Concepts, Applications and Trends of Knowledge-based Urban Development. Routledge.

[7]
CBN New First-tier City Research Institute, 2019. New graded list of Chinese cities. https://baike.baidu.com/item/.

[8]
Charlie K, Börje J, Kiyoshi K et al., 2014. Knowledge, Innovation and Space. Cheltenham: Edward Elgar, 1-16. doi: 10.4337/9781783475988.00006.

DOI

[9]
Christaller W, 1998. The Principle of the Southern German Heartland. Chang Zhengwen, trans trans. Beijing: The Commercial Press.

[10]
Drucker P, 1999. Knowledge Management. Yang Kaifeng, trans trans. Beijing: Chinese University Press, 1999: 16-32.

[11]
de Zubielqui G C, Noel L, Wendy L et al., 2019. Knowledge quality, innovation and firm performance: A study of knowledge transfer in SMEs. Small Bus Econ, 53: 145-164.

DOI

[12]
Fan F Z, 2009. An analytical concept frame on urban function: Yangtze Delta area as an example. Shanghai Journal of Economics, 26(9): 61-71. (in Chinese)

[13]
Fang Y P, Peng T, Lu L X et al., 2019. Characteristics and influencing factors of urban function evolution in the Guangdong-Hong Kong-Macao Greater Bay Area. Tropical Geography, 39(5): 647-660. (in Chinese)

DOI

[14]
Guo X X, 2015. Research on the evaluation index system of talent innovation environment: Based on the empirical study in Chaoyang district of Beijing[D]. Beijing: Capital University of Economics and Business. (in Chinese)

[15]
Han B T, Lei X, Xu D Y, 2013. Measurement of regional knowledge absorptive capacity in China. Science & Technology and Economy, 26(2): 11-15. (in Chinese)

[16]
He J S, Xiong D Y, Liu H W, 2005. Knowledge innovation based on knowledge fermentation. Science of Science and Management of S.&T., 26(2): 54-57, 129. (in Chinese)

[17]
He S H, Du D B, Jiao M Q et al., 2017. Spatial-temporal characteristics of urban innovation capability and impact factors analysis in China. Scientia Geographica Sinica, 37(7): 1014-1022. (in Chinese)

DOI

[18]
Hu H P, Lyu L C, Huang R et al., 2015. Urban innovation system and function in Guangdong province in the perspective of flow of urban innovation. Urban Development Studies, 22(6): 71-76. (in Chinese)

[19]
Hu S H, Du D B, You X J et al., 2014. Spatial-temporal evolution analysis on knowledge innovation performance of universities in China’s “growth triangle regions”. Economic Geography, 34(10): 15-22. (in Chinese)

[20]
Hu X H, Du D B, 2011. Function contents of S&T innovative city and its evaluation index system and criterion. Economic Geography, 31(10): 1625-1629, 1650. (in Chinese)

[21]
Hu Y P, Meng Y W, Ding Z W et al., 2021. Study on the evolution and influencing factors of urban functional structure in Zhongyuan urban agglomeration. Journal of Henan University (Natural Science), 51(4): 423-436. (in Chinese)

[22]
Inkinen T, Suorsa K, 2010. Intermediaries in regional innovation systems: High-technology enterprise survey from northern Finland. European Planning Studies, 18(2): 169-187.

DOI

[23]
Institute of Scientific and Technological Information of China, 2020. National Innovation City Innovation Capacity Evaluation Report 2020. Beijing: Scientific and Technical Documentation Press.

[24]
Jiang C L, 2007. Study on knowledge ability of university and measurement indicators. Journal of Liaoning Technical University (Social Science Edition), 9(6): 612-614. (in Chinese)

[25]
Lei Y F, Lu C Y, Su Y et al., 2022. Research on the coupling relationship between urban vitality and urban expansion based on multi-source night light data: A case study of urban agglomerations on the west bank of the Taiwan Straits. Human Geography, 37(2): 119-131. (in Chinese)

[26]
Liu D X, He H, 2015. Analysis on influencing factors of functional specialization in PRD city group. Industrial Economic Review, 9(5): 56-64. (in Chinese)

[27]
Liu J, Cai P X, Wang F F, 2020. Network structure evolution and influencing factors of collaborative knowledge innovation in Guangdong-Hong Kong-Macao Greater Bay Area urban agglomeration. Journal of Technology Economics, 39(5): 68-78. (in Chinese)

[28]
Liu W T, He H, Lin Y P et al., 2020. Formation mechanism and influencing factors of the specialized division of labor in urban functions: An empirical test based on the urban agglomeration of the Guangdong-Hong Kong-Macao Greater Bay Area. Journal of Commercial Economics, 37(15): 145-149. (in Chinese)

[29]
Liu Y, Ma X Y, Liu J et al., 2020. Cultural competence: Part I of the 5Cs framework for twenty-first century key competences. Journal of East China Normal University (Educational Sciences), 38(2): 29-44. (in Chinese)

[30]
Lyu K W, Li X F, Zhao L C, 2017. Evaluation and analysis on regional innovation capability in middle China. Regional Economic Review, (2): 99-106. (in Chinese)

[31]
Lyu L C, He A, Huang R, 2014. Beijing’s urban innovational function based on knowledge output. Geographical Research, 33(10): 1817-1824. (in Chinese)

[32]
Lyu L C, Li Y, 2010. A research on Chinese renovation urban system based on urban renovation function. Acta Geographica Sinica, 65(2): 177-190. (in Chinese)

DOI

[33]
Lyu L C, Li Y H, Liu Y H, 2009. Urban innovation function and innovational spatial urban system. Economic Geography, 29(5): 710-713, 751. (in Chinese)

[34]
Lyu L C, Yu Y J, Luan H, 2022. The relationship between urban amenity, difference and innovation ability in Beijing. Scientia Geographica Sinica, 42(1): 115-125. (in Chinese)

DOI

[35]
Malerba F, McKelvey M, 2019. Knowledge intensive innovative entrepreneurship. Foundations and Trends in Entrepreneurship, 14(6): 555-681.

DOI

[36]
Meng X C, Li J P, 2002. The research on knowledge innovation and regional economic disparities in China. Geography and Territorial Research, 18(4): 79-81, 96. (in Chinese)

[37]
Muller E, Zenker A. 2001. Business services as actors of knowledge transformation: the role of KIBS in regional and national innovation systems. Research Policy, 30(9): 1501-1516.

DOI

[38]
OECD, 2001. Science, Technology and Industry Scoreboard: Towards a Knowledge-based Economy. Paris: OECD.

[39]
Pancholi S, Yigitcanlar T, Guaralda M, 2014. Urban knowledge and innovation spaces: concepts, conditions and contexts. Asia Pacific Journal of Innovation and Entrepreneurship, 8(1): 15-38.

[40]
Song C Y, 2013. Constructing the innovation environment of strategic emerging industry cluster in China based on the perspective of knowledge innovation theory a case study on Hunan province. Scientific Management Research, 31(5): 46-49. (in Chinese)

[41]
Sun L, 2013. Comparative study on development force in underdeveloped areas of Guangdong[D]. Guangzhou: Guangzhou University. (in Chinese)

[42]
Wang B, 2019. Research on the evolution of knowledge stock distribution in knowledge network: As the example of Henan Gongyi refractory knowledge network. Journal of Technical Economics & Management, (7): 37-42. (in Chinese)

[43]
Wang J F, Xu C D, 2017. Geodetector: Principle and prospective. Acta Geographica Sinica, 72(1): 116-134. (in Chinese)

DOI

[44]
Wang J J, Xu X Q, 2004. The review and preview of urban function evolution. Human Geography, 19(3): 12-16. (in Chinese)

[45]
Wang Y, 2001. Knowledge economy and regional geography innovation. World Regional Studies, 10(3): 8-14. (in Chinese)

[46]
Wei H T, Liu Y, Tian Z H et al., 2022. Spatial distribution pattern and environmental impact of lung cancer in Henan. Acta Geographica Sinica, 77(1): 245-258. (in Chinese)

DOI

[47]
Wu Z X, Wang J B, 2003. Knowledge Management:Strategy and Practice. Beijing: China Textile & Apparel Press. (in Chinese)

[48]
Xie Y, 2015. Formation mechanism and dynamic evaluation of regional knowledge innovation ability[D]. Kunming: Yunnan University of Finance and Economics. (in Chinese)

[49]
Yan S S, 2010. On the connotations and their relationship of knowledge creation and knowledge innovation. Studies in Science of Science, 28(8): 1148-1152. (in Chinese)

[50]
Yan X F, 2000. Knovledge renovation ability. Journal of PLA Nanjing Institute of Politics, 22(4): 31-36. (in Chinese)

[51]
Yan X P, Zhou S H, 2003. The influence of information technology on urban functions. City Planning Review, 27(8): 15-18. (in Chinese)

[52]
Yang Y C, Zhao P J, 2000. The study on the functional classification of valley-cities in the western China. Economic Geography, 20(6): 61-64. (in Chinese)

[53]
Ye J F, Li Z F, 2006. Study on determinants of knowledge innovation capacity in industrial clusters. Studies in Science of Science, 24(4): 624-628. (in Chinese)

[54]
Yigitcanlar T, Bulu M, 2015. Dubaization of Istanbul: Insights from the knowledge-based urban development journey of an emerging local economy. Environment and Planning A, 47(1): 89-107.

DOI

[55]
Yigitcanlar T, Lönnqvist A, 2013. Benchmarking knowledge-based urban development performance: Results from the international comparison of Helsinki. Cities, 31: 357-369.

DOI

[56]
Zeng C S, Ke W Q, Wu S D et al., 2020. The evolution mechanism of urban function in Beijing-Tianjin-Hebei urban agglomeration. Urban Development Studies, 27(9): 72-81. (in Chinese)

[57]
Zeng C S, Lin M S, Zhan D S et al., 2021. A review of research on the characteristics and formation mechanism of urban functions. Progress in Geography, 40(11): 1956-1969. (in Chinese)

DOI

[58]
Zeng C S, Shen Y M, 2015. A study of the functional features of China’s urban service industries. Geographical Research, 34(9): 1685-1696. (in Chinese)

[59]
Zhang F M, Guo W J, 1999. Some theoritical thingkings on urban function system. Economic Geography, 19(3): 19-24. (in Chinese)

[60]
Zhang H, 2012. Comparison of S&T innovative function development of Beijing and Shanghai[D]. Shanghai: East China Normal University. (in Chinese)

[61]
Zhang S J, Zhang X F, 2018. Impact of urban innovation environment on the performance of industry-university-research institute collaborative innovation. Forum on Science and Technology in China, (4): 25-32. (in Chinese)

[62]
Zhang X P, Gao S R, 2011. A study of the features and mechanism of knowledge innovation in university based on triple helix theory. Management & Engineering, (3): 61-66. (in Chinese)

[63]
Zhang X T, Yi Y F, Wang C, 2021. The impact of foreign direct investment on the specialization of urban functions: An evidence based on the Pearl River Delta urban agglomeration. Macroeconomics, (9): 86-98. (in Chinese)

[64]
Zhang Y Q, 1999. Knowledge economy and the new development of economic geography. Economic Geography, 19(6): 18-22. (in Chinese)

[65]
Zhao J, 2013. Study on evolution and decision of technological innovation path in knowledge-intensive industries[D]. Harbin: Harbin Engineering University. (in Chinese)

[66]
Zhao J J, Bentlage M, Thierstein A, 2017. Residence, workplace and commute: Interrelated spatial choices of knowledge workers in the metropolitan region of Munich. Journal of Transport Geography, 62: 197-212.

DOI

[67]
Zhou C, Zeng G, Cao X Z, 2017. Chinese inter-city innovation networks structure and city innovation capability. Geographical Research, 36(7): 1297-1308. (in Chinese)

DOI

[68]
Zhou Y X, Bradshaw R, 1988. Classification of industrial functions in Chinese cities (including blind counties): Theories, methods and results. Acta Geographica Sinica, 43(4): 287-298. (in Chinese)

[69]
Zhu M G, 2007. The measurement research of regional knowledge capability based on the method of entropy weight. Journal of Capital University of Economics and Business, 9(5): 58-60. (in Chinese)

[70]
Zhu Y M, Yu N W, 2002. Urban flows in the Hu-Ning-Hang urban compact district. Urban Planning Forum, 46(1): 31-33, 44-79. (in Chinese)

Outlines

/