Research Articles

Dynamics of the global semiconductor trade and its dependencies

  • REN Yawen , 1, 2 ,
  • YANG Yu , 1, 2, 3, * ,
  • WANG Yun 4 ,
  • LIU Yi 1, 2, 3
Expand
  • 1. Key Laboratory of Regional Sustainable Development Modeling, Institute of Geographic Sciences and Natural Resources Research, CAS, Beijing 100101, China
  • 2. College of Resources and Environment, University of Chinese Academy of Sciences, Beijing 100049, China
  • 3. Institute of Strategy Research of Guangdong-Hong Kong-Macao Greater Bay Area, Guangzhou 510070, China
  • 4. School of Government Administration, University of International Business and Economics, Beijing 100029, China
*Yang Yu (1984-), PhD. and Professor, specialized in energy geography and national security, economic geography, and regional development. E-mail:

Ren Yawen (1992-), PhD Candidate, specialized in industrial geography and regional development. E-mail:

Received date: 2022-12-22

  Accepted date: 2023-02-10

  Online published: 2023-06-26

Supported by

National Natural Science Foundation of China(42130712)

Abstract

The semiconductor industry typifies the international division of labor and exhibits significant structural differences in global trade in key product segments. The evolution of cross-border trade flows and dependency relationships, as well as trade organization patterns of manufactured products, equipment and materials for manufacturing, are investigated by constructing a global semiconductor trade relationship matrix and using the Gini coefficient and trade dependency index. It was found that: (1) the global semiconductor trade is highly spatially unbalanced, with materials and equipment trade in particular highly concentrated in a few countries on both the supply and demand sides; (2) China has replaced the US as the largest global semiconductor trade player and has shaped the regionalized system of manufactured goods and materials trade with East and Southeast Asian economies, but its equipment trade is highly dependent on Europe and the US; (3) the semiconductor production model has promoted the regionalization of the east and southeast Asia region in the trade of manufactured products and materials, and developed economies such as the US, the EU, Japan, and South Korea have maintained their monopolistic advantage in the trade of semiconductor equipment by building exclusive innovation networks and establishing trade barriers. The monopolistic nature of the semiconductor equipment trade and the regionalization of manufactured goods and materials have formed the characteristics of the global semiconductor trade and are likely to be further strengthened in future trade.

Cite this article

REN Yawen , YANG Yu , WANG Yun , LIU Yi . Dynamics of the global semiconductor trade and its dependencies[J]. Journal of Geographical Sciences, 2023 , 33(6) : 1141 -1160 . DOI: 10.1007/s11442-023-2123-9

1 Introduction

The expansion of the semiconductor production system epitomizes the economic globalization of the last 40 years, and it is one of the focuses of the current international technological and economic game (Dicken, 2007). Because semiconductors have high capital and technological thresholds, they are highly dependent on the global division of labor system, which also profoundly influences geoeconomics relations between the US, the EU, and the Asia-Pacific region, as well as other regions (Pierucci, 2019; Samuel and Wey, 2019). The semiconductor industry has undergone some important global transformation since the birth of Fairchild Semiconductor Inc. in the USA in 1957 (Dibiaggio, 2007; Xie and Chen, 2020). Organizationally, IDM (integrated design and manufacturer) have gradually evolved into a specialized division of labor including so-called Fabless, Foundry, outsourced semiconductor assembly and test, and Fab-lite companies. Geographically, the semiconductor industry center has shifted three times, from the US (1958-1984) to Japan (1985-1992) to South Korea, China Taiwan, China, and Southeast Asia (since the late 1990s) (Nenni and McLellan, 2014; Zhu, 2019). The asymmetry between economies in the industrial value chain is also further accentuated by the fact that differences in the value distribution of different product segments are particularly pronounced.
The division of labor in industrial chains in different regions is the fundamental motivation for trade, while trade in high-tech products has undergone a process of transfer from developed to developing economies, showing the basic characteristics of a shift from unipolarity to multipolarity (Gao and Li, 2017; Wang et al., 2019; Duan and Du, 2020; Liu et al., 2021; Qu and Li, 2020). At the early stage of the development of the semiconductor industry, vertically integrated production was dominated by the intra-company division of labor. Along with the increase in product complexity, different parts of the semiconductor supply chain were laid out differently around the world, gradually forming a global value division of labor system with key economies in Europe and the US as R&D centers and Southeast Asia, China, China Taiwan, and China Hong Kong as foundry bases (Scott, 1987; Scott and Angel, 1988; Arita and MaCann, 2002; Funk, 2008). Since the 21st century, the volume of inter-regional semiconductor trade has grown at a rapid pace, and the production organization patterns of major economies have had a significant impact on the trade (Xie et al., 2020). US semiconductor companies have formed global production networks combining local innovation clusters with global supply chains, while Japan has placed greater emphasis on building localized cluster organizations in midstream semiconductor manufacturing (Arita and Fujita, 2001; Martin et al., 2010), and the placement of European and US multinational companies’ production links in East and Southeast Asia has shaped the semiconductor production network in the Asia-Pacific region (Yeung, 2019). As the high-value-added segments of semiconductor products mainly come from technology accumulation, value capture through technology monopoly is the best path to controlling the semiconductor industry chain. However, there is a gap between the high- and low-value positions of different segments, which also has a differential impact on economies at different stages of industrial development. On the one hand, multinational enterprises have significant knowledge spillover effects, and the trend towards strong linkages in shared technologies and weak linkages in specific technologies among major economies has further strengthened the technological monopoly of developed economies (Rasiah and Shan, 2016; Rasiah et al., 2016; Wang et al., 2017; Durand and Milberg, 2020). On the other hand, emerging industrial countries not only need deep participation in the global trade of semiconductor products in such a monopoly system but also support from their own industrial policies in order to obtain space for local industrial innovation and upgrading (Appleyard, 1996; Liu et al., 2018). With the help of open global trade and continuous localized institutional support, China has initially emerged from its weak position in the technology cooperation network, building a transition path from technological dependence on multinationals to the pursuit of a higher level of technological autonomy, but still lacks an independent voice in key semiconductor technologies (Grimes and Sun, 2016; Sun and Grimes, 2016; Sun and Grimes, 2017). Some scholars argue that China needs to participate in the division of labor in global value chains as well as shape national value chains through technological autonomy and lead regional value chains, in order to achieve the goal of a dual domestic and international cycle (Grimes and Du, 2020; Song et al., 2020). It should be emphasized that although countries tend to compete for the initiative in semiconductor trade through autonomous innovation, it is in fact difficult to fundamentally break away from the current trading system dominated by developed economies such as Europe and the US (Triolo, 2019; Song et al., 2021).
In summary, existing studies generally include the semiconductor industry in the analysis of the organization of the high-tech or electronic information industry and its value system, innovation network, global production network, etc. They do not systematically explore the specific links maintained by the semiconductor industry, especially paying insufficient attention to the asymmetrical structure of the global value chain as reflected in the semiconductor industry chain from a trade perspective. As a result of the international division of labor, the semiconductor industry is not only a vehicle for regional spatial linkages but also has different patterns of a regional organization for the different links within the industry. The spatial patterns of organization arising from the different product segments in the semiconductor industry also have a further, heterogeneous impact on major economies. Therefore, exploring factor flows from the perspective of industrial chains can not only structure industrial interactions between economies but also further reveal how trade flows shape the unevenness of the division of labor in the semiconductor industry and its asymmetric production dependence and consumer market dependence. It helps to deconstruct the organizational system of trade in the semiconductor industry and the regional spatial effects of its formation under the scale of global and enriches the research perspective of economic geography in exploring the topic of globalization. In view of this situation, this paper focuses on the evolution of the global trade structure of semiconductor commodities and the asymmetric dependencies it features between economies from the perspective of industrial chains, based on data on the semiconductor commodity trade, in order to better interpret the global division of labor system of the semiconductor industry.

2 Data and methodology

2.1 Data

The semiconductor industry chain consists of three main segments: the upstream is dominated by design business, manufacturing equipment, and materials; the midstream is dominated by integrated circuits, discrete devices, and optoelectronic component manufacturing and packaging; and the downstream is digital terminal production for enterprises and individual consumers (Figure 1). According to the current composition of the global semiconductor market, semiconductor products mainly include integrated circuits, discrete devices, and optoelectronic components, of which the integrated circuit market accounts for around 85% (Xie and Chen, 2020). Accordingly, this paper focuses on the IC manufacturing industry chain, including key equipment, materials, and manufactured goods (Table 1). The research data is sourced from UN-Comtrade dataset, the United Nations trade database, where intercountry trade data for 1999-2006 and 2007-2019 are based on HS0 and HS5 classifications respectively. In the actual data statistics and analysis, four economies—China, China Taiwan, Hong Kong, and Macau—are used to better present the real characteristics of trade in China’s semiconductor industry. To facilitate the extraction of major trade flows, the analysis focuses on trade in manufactured products, materials, and equipment exceeding US\$100 million.
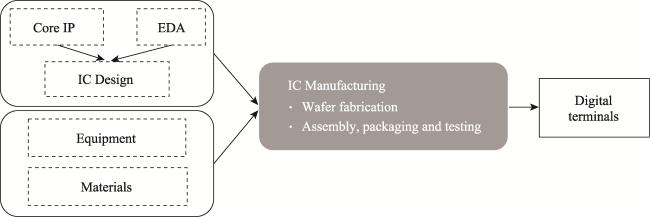
Figure 1 Semiconductor manufacturing chain
Table 1 Commodity attributes of semiconductors in international trade
Product Categories Products HS Code Description of product content
Semiconductor
manufactured
goods
Integrated circuit devices 8541 Diodes, transistors, similar semiconductor devices; including light-emitting diodes (LEDs), mounted piezoelectric crystals, assembled or unassembled in modules or panels
Integrated circuits and microelectronic components 8542 Electronic integrated circuits
Key equipment for semiconductor
manufacturing
Photolithography/ 848620 Machines and equipment used individually or primarily for the manufacture of semiconductor ingots or wafers, semiconductor devices, electronic
integrated circuits or flat-panel displays
etching machines 848620
Ion injectors 848620/854311
Key materials for semiconductor
manufacturing
Printed circuit boards 8534 Printed circuits
Silicon wafers 3818 Chemical elements doped for use in electronic products, in the form of discs, wafers or the like; compounds doped for use in electronic products; including gallium nitride wafers, silicon wafers
Silicon raw materials 280461 Silicon; containing not less than 99.99% silicon by weight
Silicon raw materials 280469 Silicon; containing less than 99.99% by weight of silicon
Photoresist 370710 For integrated circuits and semiconductor discrete devices, exposure micro-imaging process
Electronic gases 280429 Rare gases for semiconductor production
Electronic special gases 280430 Nitrogen for semiconductor production

2.2 Research methodology

2.2.1 Gini coefficient

The Gini coefficient is a common method to highlight differences in the degree of agglomeration between industries and can measure the unevenness of the spatial distribution of industries. The Lorenz curve method is adopted here to calculate the Gini coefficient of the semiconductor trade and measure spatial imbalance in the semiconductor trade based on the import and export volume of semiconductor products by country and region, with the following formula (Krugman, 1991):
${{G}_{i}}=\frac{1}{2n_{\mu }^{2}}\sum\limits_{l}{\sum\limits_{m}{\left| {{s}_{il}}-{{s}_{im}} \right|}}$
where n is the number of economies, μ is the average of industry shares, and Sil and Sim are the industry shares of economies l and m respectively. The larger Gi is, the higher the concentration of industry i, which means that the industry is more unevenly distributed in space.

2.2.2 Global semiconductor trade relationship matrix

Based on important time points and the principle of equidistant sampling, and considering the instability of trade due to the COVID-19 pandemic since the beginning of 2020, we selected 1999, 2009, and 2019 as time points for the sample trade analysis, and a directional weighting matrix for inter-subjective semiconductor trade was constructed based on data on bilateral trade relations. Vector Vi = [Vi] (i=1, 2,..., n) is the exporting country or region (Exporter), vector Vj = [Vj] (j=1, 2,..., n) is the importing country or region (Importer), and weight matrix W = [Wij] (i=1, 2,..., n; j=1, 2,..., n) for Va to Vb export trade values, forming an N×N adjacency matrix A = [Aij] (i=1, 2,..., n; j=1, 2,..., n), and finally C=(Vi, Vj, W, A) to represent the matrix of semiconductor trade flows between economies, and Chord Graph visualization of their matrices by online code.

2.2.3 Trade dependence index between economies

The HM index measures asymmetric trade dependence between major economies in an international trade network in a full market scenario (Baldwin, 2003; Zou et al., 2015; Zhang et al., 2017). The formula is given below:
$H{{M}_{B}}=\frac{{{E}_{AB}}}{{{E}_{A}}}\times \left( 1-\frac{{{I}_{AB}}}{{{I}_{B}}} \right)\times 100\%$
where HMB represents the degree of dependence of merchandise exports from economy A on the market of economy B. The value ranges from [0,1], with larger values indicating a stronger degree of dependence. EAB represents exports from A to B; EA represents total exports from A; IAB represents imports from A to B; IB represents total imports from B.

3 Geographical evolution of global semiconductor trade flows

3.1 Geographical unbalance of overall trade

The global trade in semiconductor manufacturing (manufactured goods, materials, and equipment) has shown a significant growth trend, with exports concentrated in a few major economies and the global semiconductor trade, in general, showing a high degree of imbalance across different segments. Total exports between economies increased from US\$230 billion in 1999 to US\$830 billion in 2019; the share of exports of manufactured goods continued to stabilize at around 86%, while the share of exports of manufacturing materials and equipment was around 9% and 5% respectively. In Table 2, the trade Gini coefficients of different links of products in the three nodal years all exceed 0.9, with the trade Gini coefficients of imports and exports of manufactured goods and manufacturing materials both remaining stable at around 0.94 and 0.93 respectively, while the Gini coefficients of semiconductor manufacturing equipment all remain stable at around 0.97, with an extremely strong trade monopoly. The huge gap in trade scale leads to a strong border in the trade space, and the unbalanced trade relationship is long-standing and relatively stable.
Table 2 Gini coefficient of global semiconductor trade

1999 2009 2019
Export Import Export Import Export Import
Manufactured goods 0.9501 0.9301 0.9445 0.9326 0.9473 0.9323
Manufacturing materials 0.9354 0.9164 0.9458 0.9278 0.9472 0.9222
Manufacturing equipment 0.9878 0.9698 0.9740 0.9654 0.9739 0.9739

3.2 Trade in manufactured goods: East and Southeast Asian integration

The total global export trade of manufactured goods grew from US\$209 billion in 1999 to US\$727.5 billion in 2019, and its industrial agglomeration in the Asian region was strengthened. In 1999, the United States, as the world’s top trading country for manufactured semiconductors, accounted for more than 23% of the global export share of manufactured semiconductors and formed a major trade link with Asian economies such as Japan, South Korea, the Philippines, Singapore, and Malaysia. In 2009 and 2019, the size of US exports of manufactured semiconductors declined significantly to around \$75 billion and \$100 billion respectively, with its share falling to 9.94% and then 6.96%. China, in contrast, has replaced the US as the world’s largest semiconductor manufactured goods trade player, with exports totaling over US\$95 billion and US\$250 billion respectively; its share of global semiconductor exports increased from 1.54% in 1999 to 12.02% in 2009 and 16.47% in 2019 (Table 3). Trade in manufactured goods between China and neighboring economies has continued to grow, benefiting from a huge and continuously escalating digital consumer market and a significant increase in investment by multinational companies in China. The year 2019 saw South Korea become China’s largest source of manufactured semiconductor imports, with a trade value of over US\$100 billion, which also makes them the world’s largest manufactured goods trade pair (Figure 2). Overall, the trade in manufactured semiconductors has evolved from a bilateral structure of “USA–Asia-Pacific” to a “core-fringe” structure dominated by Asia-Pacific.
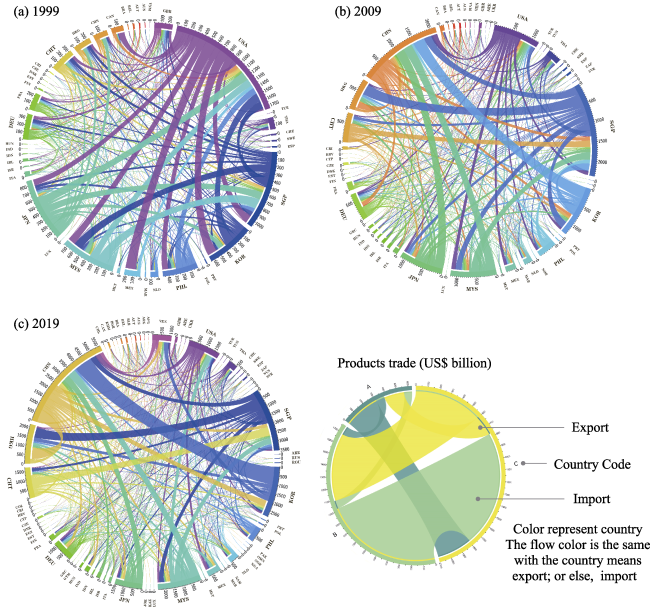
Table 3 Changes in the trade value and proportion of semiconductor manufactured goods in key economies
Unit 1999 2009 2019
% Export Specific gravity Import Specific gravity Export Specific gravity Import Specific gravity Export Specific gravity Import Specific gravity
China 66.09 1.54 137.15 3.2 930.11 12.02↑ 1676.98 21.76↑ 2477.62 16.47↑ 3387.09 22.64↑
China
Taiwan
151.04 3.52 184.98 4.31 521.37 6.74↑ 267.11 3.47↓ 1337.05 8.89↑ 480.12 3.21↓
Korea 369.84 8.62 288.83 6.73 815.27 10.53↑ 509.4 6.61↓ 2015.63 13.4↑ 831.52 5.56↓
United States 993.82 23.16 766.87 17.88 769.44 9.94↓ 469 6.09↓ 1047.7 6.96↓ 816.28 5.46↓
Japan 622.19 14.5 255.85 5.97 792.56 10.24 355 4.61↓ 1081.27 7.19↓ 474.65 3.17↓
Germany 159.2 3.71 205.46 4.79 298.99 3.86↑ 409.21 5.31↑ 526.85 3.5↓ 670.74 4.48↓
Netherlands 48.14 1.12 71.83 1.7 105.02 1.36↑ 126.58 1.64↓ 221.52 1.47↑ 336.02 2.25↑
United Kingdom 103.73 2.42 160.18 3.74 46.89 0.61 41.35 0.54↓ 74.84 0.5↓ 74.81 0.5↓
Malaysia 371.8 8.67 388.73 9.06 723.95 9.35↑ 502.58 6.52↓ 1786.5 11.87↑ 757.3 5.06↓
Singapore 514.33 11.99 579.8 13.52 1390.48 17.97↑ 1036.76 13.45↓ 1936.05 12.87↓ 1617.19 10.81↓

Note: The unit of import and export is USD billion, the unit of proportion is %, and ↓ and ↑ represent the increase and decrease of import and export trade volume compared with the previous nodal year respectively.

Figure 2 Global trade flow of semiconductor manufactured goods
Between 1984 and 1987, the traditional IDMs were no longer able to absorb the huge R&D costs of VLSI (Very Large Scale Integration) production on their own. The design and production sides of the semiconductor industry began to separate as the IDMs could no longer afford the huge R&D costs required for VLSI production on their own. Specialized businesses, represented by E-Silicon (located in California USA) and TSMC (located in Hsinchu Taiwan China), began to participate in the global production division of labor, promoting the global production layout of multinational companies and releasing the production efficiency of integrated circuits, discrete devices, and optoelectronic components. In contrast, China continued to expand its semiconductor device production scale in the form of Sino-foreign joint ventures by accelerating the integration of multinational corporate capital with local state-owned semiconductor plants, taking on many global semiconductor production functions for low-end manufactured goods. Semiconductor production in China Taiwan entered a period of rapid growth in the 1980s. Wafer foundry and chip manufacturing companies represented by TSMC, UMC, Power Chip, and other companies established capital with upstream companies in Europe and America, and technical cooperation network to establish the world’s largest foundry manufacturing cluster of advanced process wafers. In addition, Southeast Asian economies have established a limited scale of semiconductor device production using the original electronic assembly foundry base. At the same time, Japan and South Korea are more focused on the local R&D, design and production of advanced process semiconductor devices.

3.3 Trade in materials: frequent interaction among East Asian economies

Manufacturing materials include basic resources such as high-purity silicon, electronic gases, and PCB (Print circuit boards), and are the upstream link in the production of manufactured goods. In the past 20 years, global trade flows of semiconductor materials have been concentrated between the US and East Asia (Figure 3). In 1999, the US, Japan, and China Taiwan were the major players in global trade of semiconductor materials, with the US accounting for 18.29% of imports and 18.24% of exports, and trade was concentrated in East Asia and the neighboring countries of Canada and Mexico. In 2009 and 2019, China’s share of imports and exports of semiconductor materials increased from 4.71% and 6.38% in 1999 to 19.16% and 29.70% in 2019, respectively, surpassing the US as the world’s largest trading country for semiconductor materials (Table 4). The strength of trade between China, China Taiwan, South Korea, and Japan continues to strengthen, with the materials trade thus gradually becoming more regionally integrated in East Asia. Although Japan and China Taiwan both accounted for more than 10% of the material export trade in 2019, the gap between their trade scale and that of China has gradually widened. By 2019, US semiconductor material import trade volume and export trade volume had dropped to 6.69% and 5.87%, as the US has maintained relatively limited semiconductor trade links with some economies in East and Southeast Asia, and the influence of the material trade has weakened significantly. It is worth noting that the scale of import and export of semiconductor materials from Vietnam and Germany has grown to around \$10 billion during this period. In 2019, Vietnam’s trade in semiconductor materials imported from South Korea and China reached around \$3 billion and \$2.5 billion respectively, and the country has gradually entered the global semi-conductor division of labor system and become an emerging stakeholder in the semiconductor industry in Southeast Asia.
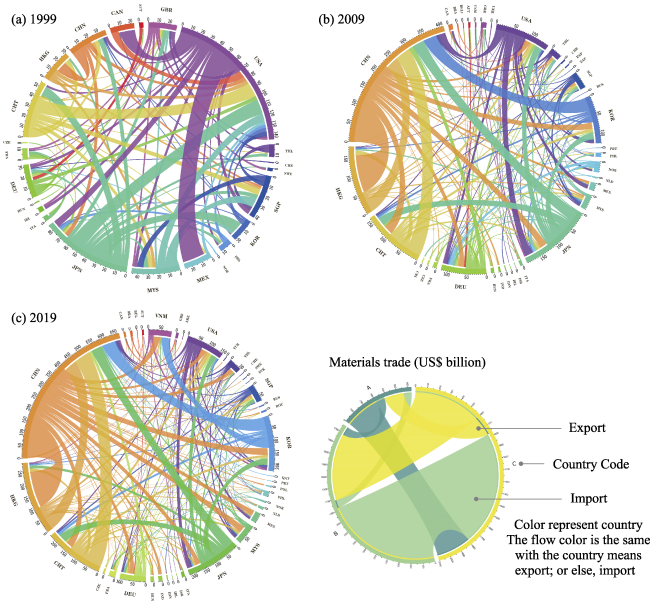
Figure 3 Global trade flow of semiconductor materials
Table 4 Changes in the trade value and proportion of semiconductor materials in key economies
Unit 1999 2009 2019
% Export Specific gravity Import Specific gravity Export Specific gravity Import Specific gravity Export Specific gravity Import Specific gravity
China 27.59 6.38 20.42 4.71 277.89 26.91↑ 234.86 22.86↑ 419.98 29.7↑ 270.35 19.16↑
China
Taiwan
48.27 11.15 16.79 3.88 106.77 10.34↓ 73.8 7.18↑ 151.22 10.69↓ 98.71 7↓
Korea 14.59 3.37 17.14 3.96 75.12 7.27↑ 62.07 6.04↑ 132.54 9.37↑ 98.48 6.98↑
United States 79.14 18.29 78.98 18.24 98.16 9.51↓ 71.62 6.97↓ 83.04 5.87↓ 98.22 6.96↓
Japan 71.25 16.46 26.11 6.03 136.02 13.17↓ 77.29 7.52↑ 172.44 12.2↓ 66.61 4.72↓
Germany 24.18 5.59 25.05 5.78 63.13 6.11↑ 70.74 6.88↑ 58 4.1↓ 64.07 4.54↓
Netherlands 2.46 0.57 5.54 1.28 4.79 0.46↓ 8.24 0.8↓ 7.76 0.55↑ 12.3 0.87↑
United Kingdom 14.69 3.39 22.5 5.2 11.31 1.1↓ 14.97 1.46↓ 8.49 0.6↓ 16.77 1.19↓
Malaysia 27.57 6.37 25.72 5.94 15.45 1.5↓ 35 3.41↓ 27.5 1.94↑ 66.01 4.68↑
Singapore 16.4 3.79 33.28 7.68 26.01 2.52↓ 30.85 3↓ 33.09 2.34↓ 46.2 3.27↑

Note: The unit of import and export is USD billion, the unit of proportion is %, and ↓ and ↑ respectively represent the increase and decrease of import and export trade volume compared with the previous period.

3.4 Trade in equipment: the high concentration of supply and demand

The key equipment of semiconductor manufacturing is mainly ion implanter, etching machine, and lithography machine, which is the value link with the most concentrated technology, capital, talents and other specialized elements and the highest resource allocation requirements in the semiconductor industry chain. Compared to trade in manufactured goods and materials, trade in critical equipment is relatively small in terms of trade participants and the scale of bilateral trade relations (Figure 4); and there is also significant regional heterogeneity in trade in semiconductor equipment compared to trade in most manufactured goods and materials (Table 5). Key equipment is the core link between materials and manufactured goods, and its trade exhibits the basic characteristics of a high degree of monopoly. In 1999, the US and the UK completely dominated the export side of key equipment, with the two economies together accounting for over 91% of exports; their exports were concentrated in the major semiconductor industry-dominant regions such as China Taiwan, China, Singapore, the Netherlands, Japan, Italy, Israel, and Germany. Between 2009 and 2019, despite the spread of the range of participating subjects, the production advantage is still highly concentrated in the USA, Netherlands, and Japan, with the total share of exports from the three economies reaching 77.20% and 75.29%, respectively. Singapore and South Korea also export a small amount of equipment, accounting for 9.26% and 4.28% of global exports respectively. On the other hand, the consumer market for key equipment is highly concentrated. China Taiwan has been the largest destination for equipment imports over the past 20 years, with its import share consistently remaining at around 30%, followed by China, the United States, and South Korea, whose equipment import shares continued to rise, reaching 25.86%, 15.66, and 12.58% respectively in 2019, far higher than those of other economies. Semiconductor manufacturing equipment has not seen the same significant shift in production focus as manufactured goods and materials; the US, Japan,and the Netherlands are further deepening their control over the global semiconductor production system through equipment exports, and have formed a highly interactive, close relationship.
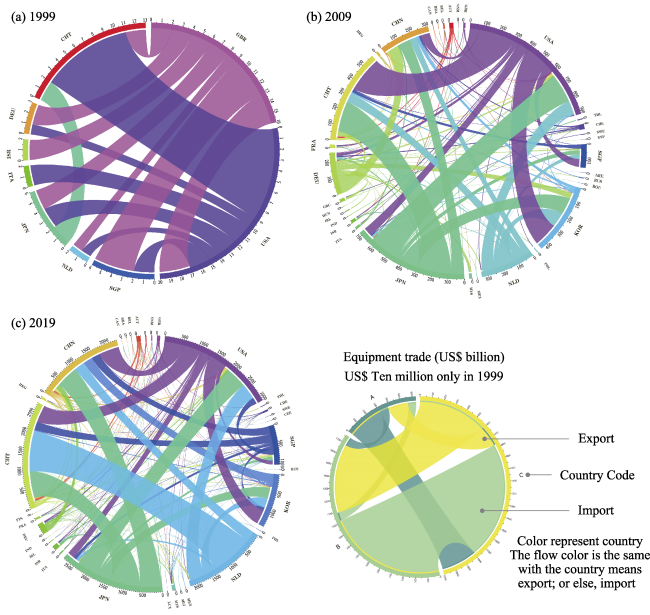
Figure 4 Global trade flow of semiconductor equipment
Table 5 Changes in the trade value and proportion of semiconductor equipment in key economies
Unit 1999 2009 2019
% Export Specific gravity Import Specific gravity Export Specific gravity Import Specific gravity Export Specific gravity Import Specific gravity
China 0 0 0 0 1.15 0.56↑ 31.14 15.2↑ 15.34 1.84↑ 216.58 25.86↑
China
Taiwan
0 0 1.24 32.46 1.87 0.91↑ 57 27.83↓ 17.06 2.04↑ 264.02 31.52↑
Korea 0 0 0 0 4.9 2.39↑ 40.12 19.59↑ 35.74 4.28↑ 105.38 12.58↓
United States 1.8 47 0.34 8.9 61.17 29.86 31.97 15.61↑ 177.59 21.26↓ 131.13 15.66↑
Japan 0.21 5.48 0.41 10.73 63.73 31.11↑ 8.73 4.26↓ 235.79 28.23↓ 39.24 4.69↑
Germany 0.02 0.52 0.31 8.12 21.49 10.49↑ 5.72 2.79↓ 21.81 2.61↓ 7.88 0.94↓
Netherlands 0.07 1.83 0.26 6.81 33.25 16.23↑ 1.14 0.56↓ 215.49 25.8↑ 4 0.48↓
United Kingdom 1.7 44.39 0.02 0.52 1.15 0.56↓ 0.54 0.26↓ 7.8 0.93↑ 1.21 0.14↓
Malaysia 0 0 0 0 0.31 0.15↑ 1.94 0.95↑ 3.26 0.39↑ 6.33 0.76↓
Singapore 0.01 0.26 0.68 17.8 3.32 1.62↑ 11.96 5.84↓ 77.36 9.26↑ 26.59 3.17↓

Note: The unit of import and export is USD billion, the unit of proportion is %, and ↓ and ↑ respectively represent the increase and decrease of import and export trade volume compared with the previous period.

In summary, the spatial and temporal evolution of trade flows of semiconductor manufactured goods, materials, and equipment highlights the significant differences in trade structures in different segments. Compared to trade in manufacturing products in general, the higher technical barriers in the semiconductor industry give rise to of spatial agglomeration and imbalance in its trade. The center of gravity in the downstream segment of semiconductor manufacturing is basically stable in East and Southeast Asia, while the technological advantage of upstream equipment is still monopolized by the US and some EU economies. In the three key segments, the US, UK, Germany, Japan, Korea, China, China Taiwan, Singapore, and Malaysia are participants in the entire semiconductor industry chain, forming a more stable and specialized division of labor system. The US, the Netherlands, and Japan still have a monopoly advantage in the equipment segment; while China, Japan, and South Korea have a dominant voice in the materials segment; While China, China Taiwan, Japan, and South Korea dominate the production of manufactured goods.

4 Global trade dependencies and geographical labor model in semiconductor industry

4.1 Demand dependence in trade of manufactured goods and materials

Market dependence is manifested by the dominance of consumer markets in trade relations. Because economies have some manufacturing capacity for finished products and production has relatively weak control over trade, trade in manufactured goods mainly shows a consumer market-led dependence. In Table 6, a comparative analysis of the HM Index for 1999, 2009, and 2019 shows a structural shift in the market dependence of trade in manufactured semiconductors, with the dependence of Asian economies on the US market evolving into a market dependence dominated by China. Specifically, in 1999, the US held six of the top 10 global trade dependencies; global market dependence on manufactured semiconductors was manifested in the dependence of Asian economies such as Malaysia, South Korea, China Taiwan, China, and Singapore on the consumer market of the US. Since 2009, China’s ability to dominate the consumer market has increased significantly, and it is now a major dependency market for the US as well as East Asian economies. In 2019, the intensity of the market dependence of Israel, South Korea, and Japan on China reached 0.53, 0.45 and 0.31, significantly higher than other economies. Singapore is the second-largest consumer market for manufactured semiconductors after China and a major destination for semiconductors from China Taiwan and Malaysia. China Taiwan’s market dependence on Singapore increased from 0.19 in 1999 to 0.34 in 2019, while its market dependence on China is relatively low and does not feature in the top 10 of the HM Index. The trade dependence between China Taiwan and China has been weakened largely by the increased capacity of China’s domestic wafer fabrication plants and the high volume of transshipments via Hong Kong. The two-way dependence between Singapore and Malaysia evolved into a one-way market dependence of Malaysia on Singapore in 2019. With limited industrial land and an advanced producer services orientation, Singapore has gradually entered a phase of “capacity retirement” in the midstream wafer and IC manufacturing segment and has strengthened its presence in the upstream chip design and manufacturing equipment development and downstream digital end-consumer segments. In contrast, China is more widely distributed in terms of where it sources its manufactured goods, and the world’s market dependence on China is more concentrated on mid- and low-end IC products.
Table 6 HM index of manufactured goods trade between key economies (top 10)
Place of production Place of
consumption
HM1999 Place of production Place of consumption HM2009 Place of
production
Place of consumption HM2019
Malaysia Singapore 0.29 Korea China 0.36 Israel China 0.53
Korea United States 0.28 Malaysia China 0.31 Korea China 0.45
China
Taiwan
United States 0.25 Japan China 0.3 China
Taiwan
Singapore 0.34
Malaysia United States 0.23 China
Taiwan
Singapore 0.29 Japan China 0.31
China
Taiwan
Singapore 0.19 Malaysia Singapore 0.22 Malaysia China 0.24
Japan United States 0.18 Korea Singapore 0.19 United States China 0.22
Singapore United States 0.18 United States China 0.15 Malaysia Singapore 0.16
China United States 0.16 Singapore China 0.14 Singapore China 0.15
Japan Singapore 0.16 United States Malaysia 0.12 Korea Vietnam 0.11
Singapore Malaysia 0.15 Germany Malaysia 0.11 Germany China 0.1
There is a high degree of similarity in terms of market dependence between the trade in semiconductor manufacturing materials and manufactured goods (Table 7). China has replaced the US as the dominant consumer market and has established a system of regional trade dependence in Asia with Japan, Malaysia, Singapore, South Korea, and China Taiwan. China Taiwan has the highest market dependence on China, with an HM index of 0.41. China Taiwan shows high dependence on China for trade in materials compared to that in manufactured goods. Within the Asian region, South Korea’s dependence index on China’s consumer market shows a marked decrease, from 0.45 in 2009 to 0.35 in 2019. Singapore and Malaysia’s dependence index for China was relatively low in 2009, failing to rank in the top 10, but in 2019 Singapore and Malaysia’s dependence intensity on China had increased markedly, to 0.19 and 0.12 respectively, ranking sixth and tenth in the hm index of the global materials trade. The reliance on semiconductor materials between Southeast Asia and China has been further strengthened.
Table 7 HM index of semiconductor materials trade between key economies (top 10)
Place of production Place of
consumption
HM1999 Place of
production
Place of
consumption
HM2009 Place of production Place of
consumption
HM2019
Korea United States 0.30 Korea China 0.45 China
Taiwan
China 0.41
Malaysia United States 0.27 China Taiwan China 0.36 Korea China 0.35
China
Taiwan
United States 0.27 Japan China 0.21 Japan China 0.23
Malaysia Singapore 0.27 Singapore Malaysia 0.20 Malaysia Singapore 0.20
Singapore Malaysia 0.23 Singapore Korea 0.18 Singapore Korea 0.19
Singapore United States 0.23 United States China 0.17 Malaysia China 0.19
Japan United States 0.19 Malaysia Singapore 0.16 Japan China Taiwan 0.17
Japan Korea 0.14 United States Japan 0.15 Singapore China Taiwan 0.15
China United States 0.13 Malaysia United States 0.14 Japan Korea 0.14
China
Taiwan
Singapore 0.12 Japan China Taiwan 0.14 Singapore China 0.12

4.2 Supply dependence in equipment trade

Production dependence is mainly manifested by the dominance of the place of production in trade relations and the strong control of production capacity over trade (Table 8). The high concentration of global production of key semiconductor equipment has led to a clear production dependence in its trade, with the average dependence index increasing from 0.248 in 1999 to 0.356 in 2019; the center of gravity of consumption has gradually concentrated in China, China Taiwan, and the US; the center of gravity of production shows a multi-polar character, evolving from the UK and US poles to Japan, the Netherlands, South Korea, the UK, Germany, and Singapore. In terms of trade partner selection, China, China Taiwan, and the US have different trade preferences. China is highly dependent on South Korea and Germany for key semiconductor equipment, and the degree of dependence is increasing. In 2009, China’s dependence indices on South Korea and Germany were 0.39 and 0.32 respectively, while in 2019 they had increased to 0.71 and 0.50. China Taiwan, on the other hand, shows a high dependence on the Netherlands, Japan, and Singapore. In 2009, Taiwan’s HM Index was as high as 0.61 and 0.31 for Singapore and Japan respectively, while in 2019, China Taiwan’s HM Index for the Netherlands reached 0.52, while it remained high at 0.30 and 0.29 for Japan and Singapore. The Netherlands is currently the sole producer of advanced process chip manufacturing equipment, prominently represented by nanoscale lithography machines, while South Korea and Germany focus more on the development and production of associated equipment such as ion implanters and etchers. The US is also one of the major consumer markets for key equipment, but its external dependence is lower than that of China and China Taiwan; US dependency indices for Japan, the UK, and South Korea are 0.28, 0.22, and 0.21 respectively. Among the major producing economies, Singapore’s production capacity has increased significantly in 2009 and 2019, and it is an emerging major player in the production of critical equipment as well as a major trade dependency for China Taiwan, with an HM index of 0.29. A comparative analysis of the manufactured goods and materials trade dependency indices shows that Singapore is gradually transitioning from midstream manufacturing to upstream equipment in the semiconductor industry chain. Meanwhile, China, China Taiwan, and the US all share a common trade dependence on Japan. Japan was the early monopoly in the market for micron-level semiconductor chip manufacturing equipment, and although it no longer has an absolute advantage in production technology, it still has a significant advantage in related equipment such as etchers and ion implanters.
Table 8 HM index of semiconductor equipment trade between key economies (top 10)
Place of
consumption
Place of
production
HM 1999 Place of
consumption
Place of production HM 2009 Place of
consumption
Place of
production
HM 2019
China Taiwan Japan 0.86 China Taiwan Singapore 0.61 China Korea 0.71
China Taiwan United States 0.48 China Korea 0.39 China Taiwan Netherlands 0.52
Singapore United Kingdom 0.24 China Taiwan United States 0.38 China Germany 0.50
United States United Kingdom 0.20 China Germany 0.34 China Taiwan Japan 0.30
Israel United Kingdom 0.14 China Taiwan Japan 0.31 China Taiwan Singapore 0.29
Singapore United States 0.13 Korea Netherlands 0.29 United States Japan 0.28
Japan United States 0.12 United States Netherlands 0.26 China United
Kingdom
0.28
China Taiwan United Kingdom 0.12 Korea United States 0.25 China Japan 0.25
Japan United Kingdom 0.10 United States Japan 0.23 United States United
Kingdom
0.22
Germany United Kingdom 0.09 Korea Germany 0.18 United States Korea 0.21
The results of the combined Gini coefficient and HM index show that the global semiconductor trade exhibits a high degree of spatial unevenness and asymmetry in trade dependence. It exhibits oligopolistic characteristics on both the supply and demand sides: the consumer-side trade in manufactured products and materials, and the production-side trade in key equipment have formed oligopoly patterns. In the semiconductor industry chain, China and China Taiwan basically monopolize the advanced process technology of integrated circuits and foundry manufacturing; the production advantages of the United States, Japan, and South Korea are highly concentrated in materials, equipment, and their core components; and the manufacturing of complete equipment has been completely monopolized by the Netherlands.

4.3 Semiconductor trade geographical model

Driven by the inertia of the historical experience of Moore’s Law, the accelerated iteration of semiconductor design and manufacturing technologies has created a natural imperfectly competitive market for inter-product trade and increased heterogeneity of companies and products. The transformation of the organizational model of semiconductor production from “vertical integration” to “vertical division of labor” has promoted the gradual integration of semiconductor trade from a hierarchical division of labor system to a highly regionalized and monopolistic organizational model (Figure 5).
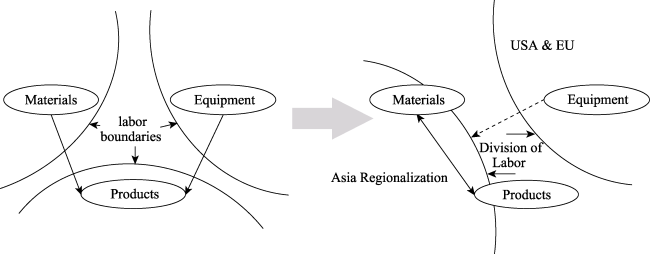
Figure 5 Geographical model evolution in the semiconductor trade space model
Since the 1980s, with the accelerated upgrading of semiconductor technology and global industrial layout, three relatively independent and well-defined segments have gradually formed: manufactured goods, materials, and key equipment. Europe, the United States, Japan, and South Korea have constructed monopolistic semiconductor trade patterns through the design of trade agreements and the establishment of corporate alliances. On the one hand, these economies strongly advocate a clear global industrial division of labor and promote the global layout of different links of the industrial chain in order to make full use of the comparative advantages of different regions as far as possible and strengthen their possession of the global market; on the other hand, they control the dominance of the industrial chain through trade agreements and technological monopolies, thus blocking the basic path of late-developing economies using trade interactions to upgrade to high-value areas. The supply frontier brought about by the organization of trade agreements is a determining factor in the formation of monopolistic patterns in the equipment trade. The Wassenaar Agreement reached by Western countries severely restricts the global transfer of semiconductor-related technologies, with the aim of prohibiting the export of dual-use technologies. The SIAC (Semiconductors in America Coalition), a US initiative, has promoted the establishment of exclusive cooperation mechanisms between 70 leading companies from Japan, South Korea, China Taiwan, China, and Western European economies in the upstream and midstream areas of the industry chain. These economies have strengthened the control of key links in the industry chain through cross-investment, technology customization, and priority supply, forming an organizational model of the semiconductor space characterized by monopolies and boundaries. Since the 1990s, South Korea, China Taiwan, and China have continued to invest and gain relative competitive advantages in niche segments such as memory device R&D, wafer foundry, and packaging and testing, and have become deeply embedded in the global semiconductor industry chain. At the same time, East and Southeast Asia’s combination of consumer markets and scale production advantages in the materials and finished goods segments has given rise to regionalized trade, breaking down the division of labor between materials and finished goods, and the geographical proximity of midstream production and downstream consumer markets has further strengthened this pattern. However, key equipment remains controlled by the US and the EU, creating a pattern of spatial organization that is both regionalized and monopolistic. Thus, the regionalization of trade patterns in manufactured goods and materials is largely rooted in the “clumping” of global trade (Poon, 1997; Kim and Shin, 2002; Andresen, 2009). Regional trade patterns in manufactured goods and materials have developed strong spatial stickiness in East Asia, with the potential for long-term fixation; while the supply-side monopoly character of trade in equipment has severely hindered the global spread of the semiconductor industry. The global spread of the semiconductor industry is severely hampered by the supply-side monopoly character of the equipment trade. In the future, the trade pattern between key links in the semiconductor industry chain will show a long-term locking of trade targets and one-way control of equipment supply, and the risk of deglobalization caused by trade protection may spread further.

5 Conclusions and discussion

The study of semiconductor trade is aimed at revealing the international division of labor in the global semiconductor trade and its dynamic evolution of asymmetric dependencies. This paper constructs a trade matrix through an industry chain perspective and based on cross-border trade data, and uses the Gini coefficient and a trade dependency index to portray the spatial and temporal evolution of the global semiconductor trade pattern, trade dependency relations, and summarize its trade organization patterns, and obtains the following conclusions.
(1) The semiconductor trade space is highly unbalanced. The Gini coefficients of manufactured semiconductor products, materials and equipment exceeded 0.9 in all three nodal years, concentrating on a highly monopolistic structure at both the production and consumption ends, and this structure has continued to strengthen and will likely do so in future as well.
(2) The regionalization of trade in manufactured semiconductors and materials in East Asia is becoming more pronounced and has basically formed an intra-regional supply and demand cycle, while trade in semiconductor equipment has formed a distinct “production-consumption” boundary. China has become the world’s largest semiconductor trader, and Asian economies are becoming more and more dependent on it for manufactured goods and materials. China Taiwan and China, which focus on midstream manufacturing, are highly dependent on a very small number of upstream semiconductor equipment exporting economies, with the Netherlands, Japan, Germany, and South Korea taking the lead and Singapore emerging as a major player in the equipment trade.
(3) The heterogeneous structure of the global semiconductor trade in its different segments stems from its specific production organization patterns, namely, the regionalization of the production of finished goods and materials and the monopolization of equipment production. The regionalized pattern of trade in manufactured goods and materials in Asia is due to the long-term investment of East Asian economies in the segmentation of manufactured products on the one hand and to the expansion of regional consumer markets in East Asia on the other. The formation of monopolistic patterns for key manufacturing equipment is to a greater extent influenced by the intervention of developed economies in trade protection practices, such as the erection of trade barriers and the establishment of exclusive business organizations.
It is noteworthy that the structure of the semiconductor trade is continuously changing. In future research, first, it is necessary to strengthen understanding of the mechanism of global flow of key technologies in the upstream segment of semiconductors. Since 2018, the trade game between China and the US around the semiconductor industry has shown that the US has desperately tried to achieve monopolistic control of the upstream segment of semiconductors through technology blockade, while China’s capability in the upstream high-value-added segment of the industry chain has been increasing. However, whether China can break through the technology blockade and path dependence, and in the field of equipment manufacturing break the established monopoly order, still faces great uncertainty. Second, research on the impact of manufacturing reverse globalization on the semiconductor industry should be strengthened. The COVID-19 pandemic has further intensified the localization and regionalization of the global manufacturing layout, and enhancing the resilience of the manufacturing chain and security of supply has become an important means for the re-industrialization of Western countries. This will further intensify the game between economies in advanced process chips and other segments, and reshape the current structure of global trade in manufactured goods and materials.

Appendix: Country name and code

Country name ISO-3 Country name ISO-3 Country name ISO-3 Country name ISO-3
Afghanistan AFG Algeria DZA Saint Lucia LCA Rwanda RWA
Angola AGO Ecuador ECU Liechtenstein LIE Saudi Arabia SAU
Albania ALB Egypt EGY Sri Lanka LKA Sudan SDN
Andorra AND Eritrea ERI Lesotho LSO Senegal SEN
United Arab Emirates ARE Spain ESP Lithuania LTU Singapore SGP
Argentina ARG Estonia EST Luxembourg LUX Solomon Islands SLB
Armenia ARM Ethiopia ETH Latvia LVA Sierra Leone SLE
Antigua and Barbuda ATG Finland FIN Morocco MAR El Salvador SLV
Australia AUS Fiji FJI Monaco MCO San Marino SMR
Austria AUT France FRA Moldova MDA Somalia SOM
Azerbaijan AZE Micronesia FSM Madagascar MDG Serbia SRB
Burundi BDI Gabon GAB Maldives MDV South Sudan SSD
Belgium BEL United Kingdom GBR Mexico MEX Sao Tome and Principe STP
Benin BEN Georgia GEO Marshall Islands MHL Suriname SUR
Burkina Faso BFA Ghana GHA North Macedonia MKD Slovakia SVK
Bangladesh BGD Guinea GIN Mali MLI Slovenia SVN
Bulgaria BGR Gambia GMB Malta MLT Sweden SWE
Bahrain BHR Guinea-Bissau GNB Myanmar MMR Swaziland SWZ
Bahamas BHS Equatorial Guinea GNQ Montenegro MNE Seychelles SYC
Bosnia and
Herzegovina
BIH Greece GRC Mongolia MNG Syria SYR
Belarus BLR Grenada GRD Mozambique MOZ Chad TCD
Belize BLZ Guatemala GTM Mauritania MRT Togo TGO
Bolivia BOL Guyana GUY Mauritius MUS Thailand THA
Brazil BRA Honduras HND Malawi MWI Tajikistan TJK
Barbados BRB Croatia HRV Malaysia MYS Turkmenistan TKM
Brunei BRN Haiti HTI Namibia NAM Timor-Leste TLS
Bhutan BTN Hungary HUN Niger NER Tonga TON
Botswana BWA Indonesia IDN Nigeria NGA Trinidad and
Tobago
TTO
Central African Republic CAF India IND Nicaragua NIC Tunisia TUN
Canada CAN Ireland IRL Niue NIU Turkey TUR
Switzerland CHE Iran IRN Netherlands NLD Tuvalu TUV
Chile CHL Iraq IRQ Norway NOR Tanzania TZA
China CHN Iceland ISL Nepal NPL Uganda UGA
Côte d’Ivoire CIV Israel ISR Nauru NRU Ukraine UKR
Cameroon CMR Italy ITA New Zealand NZL Uruguay URY
Democratic Republic of the Congo COD Jamaica JAM Oman OMN United States of America USA
Republic of the Congo COG Jordan JOR Pakistan PAK Uzbekistan UZB
Cook Islands COK Japan JPN Panama PAN Holy See VAT
Colombia COL Kazakhstan KAZ Peru PER Saint Vincent and the Grenadines VCT
Comoros COM Kenya KEN Philippines PHL Venezuela VEN
Cape Verde CPV Kyrgyzstan KGZ Palau PLW Vietnam VNM
Costa Rica CRI Cambodia KHM Papua New Guinea PNG Vanuatu VUT
Cuba CUB Kiribati KIR Poland POL Samoa WSM
Cyprus CYP Saint Kitts and
Nevis
KNA Democratic People’s Republic of Korea PRK Yemen YEM
Czech Republic CZE Republic of Korea KOR Portugal PRT South Africa ZAF
Germany DEU Kuwait KWT Paraguay PRY Zambia ZMB
Djibouti DJI Laos LAO Palestine PSE Zimbabwe ZWE
Dominica DMA Lebanon LBN Qatar QAT
Denmark DNK Liberia LBR Romania ROU
Dominican
Republic
DOM Libya LBY Russia RUS
[1]
Andresen M A, 2009. Regionalizing global trade patterns, 1981-2001: Application of a new method. Le Géographe Canadien, 53(1): 24-44.

DOI

[2]
Appleyard M M, 1996. How does knowledge flow? Interfirm patterns in the semiconductor industry. Strategic Management Journal, 17(Suppl.2): 137-154.

DOI

[3]
Arita T, Fujita M, 2001. Local agglomeration, and global networks of the semiconductor industry: A comparative study of US and Japanese firms. Review of Urban & Regional Development Studies, 13(2): 85-109.

[4]
Arita T, McCann P, 2002. The spatial and hierarchical organization of Japanese and US multinational semiconductor firms. Journal of International Management, 8(1): 121-139.

[5]
Baldwin R E, 2003. The spoke trap: Hub and spoke bilateralism in East Asia. Korea Institute for International Economic Policy (KIEP) Working Paper.

[6]
Dibiaggio L, 2007. Design complexity, vertical disintegration and knowledge organization in the semiconductor industry. Industrial and Corporate Change, 16(2): 239-267.

DOI

[7]
Dicken P, 2007. Global Shift:Mapping the Changing Contours of the World Economy. New York: The Guilford Press.

[8]
Duan D Z, Du D B, 2020. Structural evolution of global high-tech trade system: Products, networks and influencing factors. Acta Geographica Sinica, 75(12): 227-244. (in Chinese)

[9]
Durand C, Milberg W, 2020. Intellectual monopoly in global value chains. Review of International Political Economy, 27(2): 404-429.

DOI

[10]
Funk J L, 2008. Systems, components, and modular design: The case of the US semiconductor industry. International Journal of Technology Management, 42(4): 387-413.

DOI

[11]
Gao B Y, Li J W, 2017. The geography of global electric information industry trade network. World Regional Studies, 26(1): 1-11. (in Chinese)

[12]
Grimes S, Du D B, 2020. China’s emerging role in the global semiconductor value chain. Telecommunications Policy, 46(2): 101959.

DOI

[13]
Grimes S, Sun Y T, 2016. China’s evolving role in Apple’s global value chain. Area Development and Policy, 1(1): 94-112.

DOI

[14]
Kim S, Shin E H, 2002. A longitudinal analysis of globalization and regionalization in international trade: A social network approach. Social Forces, 81(2): 445-468.

DOI

[15]
Krugman P, 1991. Increasing returns and economic geography. Journal of Political Economy, 99 (3): 483-499.

DOI

[16]
Liu Q, Yang Y C, Jiang X R et al., 2021. Trade network evolution of global mobile phone and its supply-demand relationship: Based on community analysis of complex networks. Economic Geography, 41(3): 113-125. (in Chinese)

[17]
Liu Y, Yan Z, Cheng Y et al., 2018. Exploring the technological collaboration characteristics of the global integrated circuit manufacturing industry. Sustainability, 10(1): 196.

DOI

[18]
Martin X, Salomon R M, Wu Z, 2010. The institutional determinants of agglomeration: A study in the global semiconductor industry. Industrial and Corporate Change, 19(6): 1769-1800.

DOI

[19]
Nenni D, McLellan P, 2014. Fabless:The transformation of the semiconductor industry. California: CreateSpace Independent Publishing Platform.

[20]
Pierucci F, 2019. The American Trap:My Battle to Expose America’s Secret Economic War Against the Rest of the World. London: Hodder & Stoughton Press.

[21]
Poon J P, 1997. The cosmopolitanization of trade regions: Global trends and implications, 1965-1990. Economic Geography, 73(4): 390-404.

[22]
Qu R X, Li J, 2020. International high-tech products trade pattern and China’s trade status. Economic Geography, 40(3): 105-112, 143. (in Chinese)

[23]
Rasiah R, Shahrivar R B, Yap X S, 2016. Institutional support, innovation capabilities, and exports: Evidence from the semiconductor industry in Taiwan. Technological Forecasting and Social Change, 109: 69-75.

DOI

[24]
Rasiah R, Shan Y X, 2016. Institutional support, regional trade linkages and technological capabilities in the semiconductor industry in Malaysia. Asia Pacific Business Review, 22(1): 165-179.

DOI

[25]
Samuel G, Wey V, 2019. The South Korea-Japan trade dispute in context: Semiconductor manufacturing, chemicals, and concentrated supply chains. USITC Office of Industries Working Papers, 1-25.

[26]
Scott A J, 1987. The semiconductor industry in South-East Asia: Organization, location and the international division of labor. Regional Studies, 21(2): 143-159.

DOI

[27]
Scott A J, Angel D P, 1988. The global assembly-operations of US semiconductor firms: A geographical analysis. Environment and Planning A, 20(8): 1047-1067.

[28]
Song Y, Yu C, Hao L et al., 2021. Path for China’s high-tech industry to participate in the reconstruction of global value chains. Technology in Society, 65(5): 101486.

DOI

[29]
Song Z Y, Wang C, Bergmann L, 2020. China’s prefectural digital divide: Spatial analysis and multivariate determinants of ICT diffusion. International Journal of Information Management, 52: 102072.

DOI

[30]
Sun Y T, Grimes S, 2016. China’s increasing participation in ICT’s global value chain: A firm-level analysis. Telecommunications Policy, 40(2/3): 210-224.

DOI

[31]
Sun Y T, Grimes S, 2017. China and Global Value Chains: Globalization and the Information and Communications Technology Sector. London: Routledge.

[32]
Triolo P, 2019. US-China competition:The coming decoupling. The report. Singapore: Nanyang Technological University.

[33]
Wang C C, Sung H Y, Chen D Z et al., 2017. Strong ties, and weak ties of the knowledge spillover network in the semiconductor industry. Technological Forecasting and Social Change, 118: 114-127.

DOI

[34]
Wang Q Q, Du D B, Zhang Y et al., 2019. Research on evolution characteristics of global mobile phone trade network. World Regional Studies, 28(2): 170-178. (in Chinese)

[35]
Xie F, Yang P, Cui W et al., 2020. Structural properties and evolution of global integrated circuit trade relations network. In: The International Conference on Natural Computation, Fuzzy Systems and Knowledge Discovery. Cham: Springer.

[36]
Xie Z F, Chen D M, 2020. Semiconductor Chip Matters. Shanghai: Shanghai Science and Technology Press. (in Chinese)

[37]
Yeung H W, 2019. Global production and economic development in Asia a study of leading electronics firms and their production networks. Executive Report, Global Production Network Centre, National University of Singapore.

[38]
Zhang Y J, Zhang X P, Gong Z Z, 2017. Trade interdependency between China and countries along the Belt and Road. Economic Geography, 37(4): 21-31. (in Chinese)

[39]
Zhu Y W, 2019. A 50-Year Retrospective of the Integrated Circuit Industry. Beijing: Electronic Industry Press. (in Chinese)

[40]
Zou J L, Liu C L, Yin G Q et al., 2015. Spatial patterns and economic effects of China’s trade with countries along the Belt and Road. Progress in Geography, 34(5): 598-605. (in Chinese)

Outlines

/