Research Articles

Growing impacts of low-flow events on vegetation dynamics in hydrologically connected wetlands downstream Yangtze River Basin after the operation of the Three Gorges Dam

  • WANG Dandan , 1 ,
  • LIU Ying 1 ,
  • ZHENG Lilin , 2, 3, * ,
  • LI Dahui 4
Expand
  • 1. Nanjing Institute of Environmental Sciences, Ministry of Ecology and Environment, Nanjing 210042, China
  • 2. Key Laboratory of Geographic Information Science (Ministry of Education), School of Geographic Sciences, East China Normal University, Shanghai 200241, China
  • 3. Key Laboratory of Watershed Geographic Sciences, Nanjing Institute of Geography and Limnology, CAS, Nanjing 210008, China
  • 4. School of Geospatial Engineering and Science, Sun Yat-Sen University, Zhuhai 519082, Guangdong, China
*Zheng Lilin (1994-), PhD, specialized in remote sensing and hydrology. E-mail:

Wang Dandan (1978-), PhD, specialized in environmental science, hydrology and watershed management. E-mail:

Received date: 2022-03-11

  Accepted date: 2022-11-30

  Online published: 2023-05-11

Supported by

Open Research Fund of State Key Laboratory of Information Engineering in Surveying, Mapping and Remote Sensing, Wuhan University(20R01)

East China Normal University Excellent Doctoral Students’ Academic Innovation Ability Improvement Plan Project(YBNLTS2021-028)

Abstract

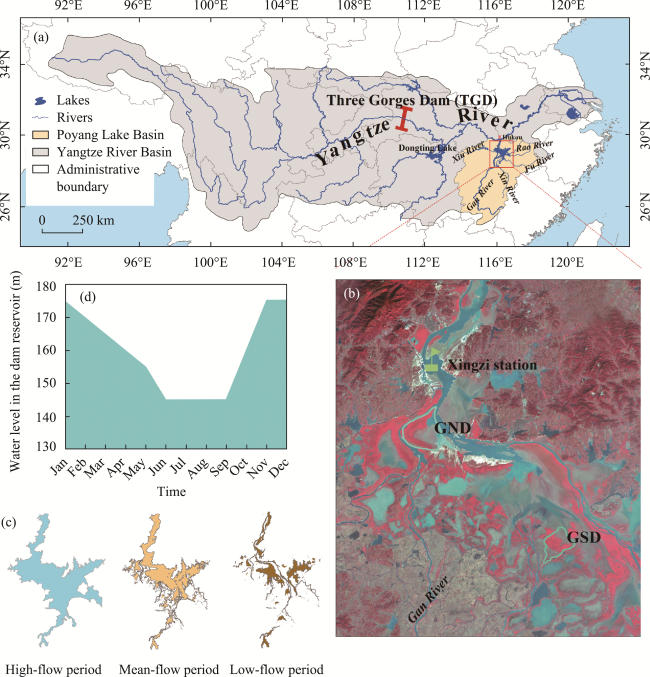
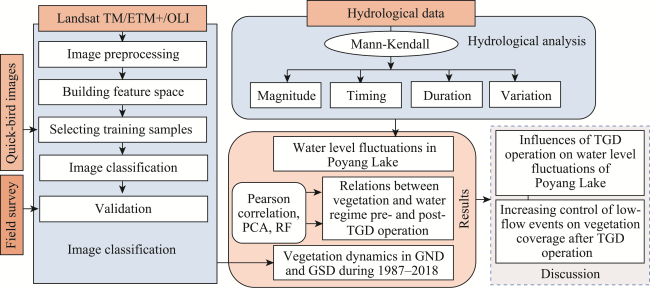
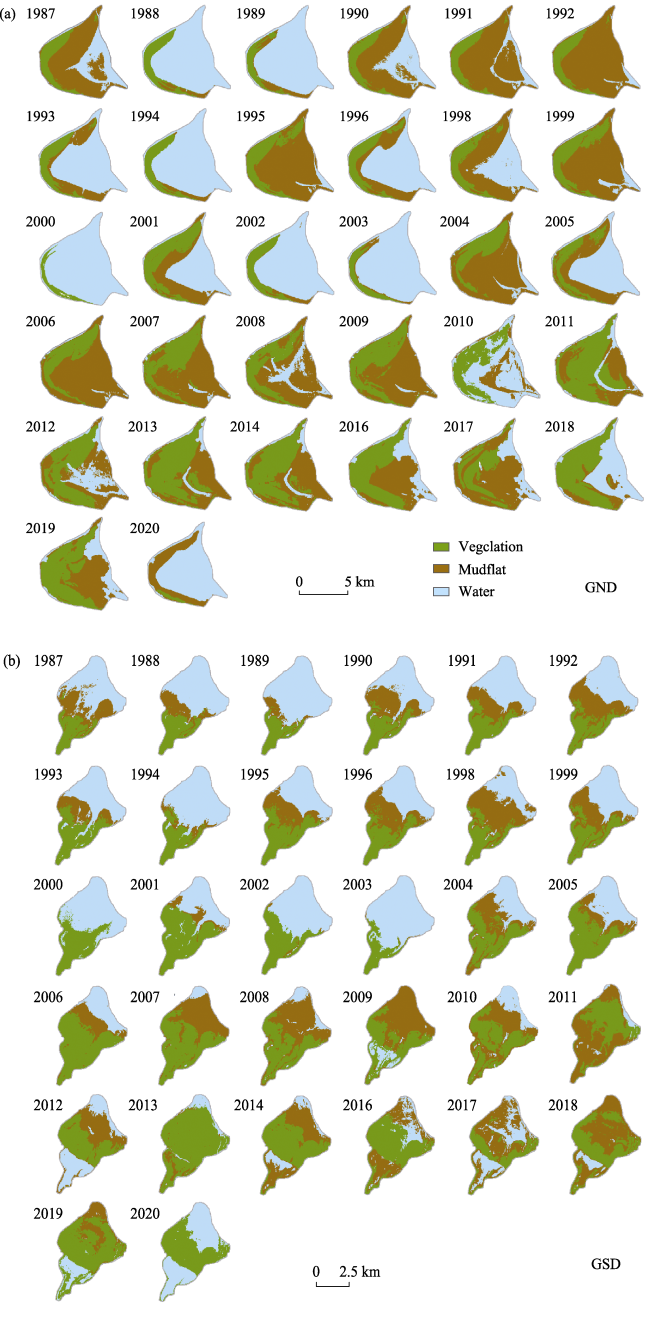
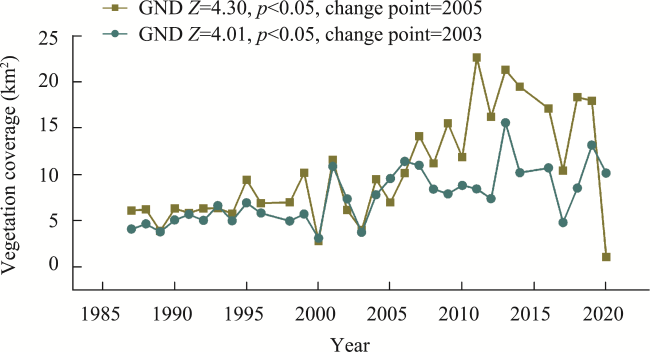
Wetland vegetation is intimately related to floodplain inundations, which can be seriously affected by dam operation. Poyang Lake is the largest floodplain wetland in China and naturally connected with the Yangtze River and the Three Gorges Dam (TGD) upstream. To understand the potential impacts of TGD on Poyang Lake wetlands, we collected remote sensing imagery acquired during dry season from 1987 to 2020 and extracted vegetation coverage data in the Ganjiang Northern-branch Delta (GND) and the Ganjiang Southern-branch Delta (GSD), using the Object-oriented Artificial Neural Network Regression. Principal components analysis, correlation analysis, and the random forest model were used to explore the interactions between vegetation extent in the two deltas and 33 hydrological variables regarding magnitude, duration, timing, and variation. The implementation of the TGD advanced and extended the low-flow periods in Poyang Lake. Vegetation coverage in the GND and GSD increased at the rates of 0.39 and 0.22 km2/year, respectively. The reservoir storage at the end of September accelerated the runoff recession in the GND and the GSD, making low-flow events more influential for vegetation dynamics and shortening the response time of vegetation to the water regime. This study provides an important reference for evaluating the impacts of dam engineering on downstream wetlands.

Cite this article

WANG Dandan , LIU Ying , ZHENG Lilin , LI Dahui . Growing impacts of low-flow events on vegetation dynamics in hydrologically connected wetlands downstream Yangtze River Basin after the operation of the Three Gorges Dam[J]. Journal of Geographical Sciences, 2023 , 33(4) : 885 -904 . DOI: 10.1007/s11442-023-2111-0

1 Introduction

Wetlands link terrestrial and aquatic habitats. Despite occupying only about 4%-6% of the Earth’s surface (Kentula, 2000), wetlands play an essential role in maintaining the ecological balance, providing nutrients, and ensuring productivity (Nicholls, 2004; Mu et al., 2020). As vegetation coverage is a sensitive and critical feature of wetlands and reflects hydrological processes (Casanova et al., 2000; Maihemuti et al., 2020), monitoring the long-term vegetation dynamics can help quantify the effects of hydrological events on wetlands.
The wetlands landscape is formed as a result of the long-term adaptation to hydrological processes and other natural factors (Zedler et al., 2005). However, the establishment of dams destroys the ecological equilibrium between vegetation and hydrological processes. Globally, by 2020, about 58,713 dams have been built, of which 40% are located in China (Jiang et al., 2019). Although dams are used for flood control, electricity generation, and shipping (Nilsson et al., 2005), their negative environmental impacts are considerable. According to previous studies, the operation of large dams can substantially alter downstream hydrological processes (Alizadeh-Choobari et al., 2016; Cheng et al., 2018; Jiang et al., 2019). For example, dam operation in the Amazon remarkably altered the frequency, duration, and change rates of high-flow events (Ely et al., 2020). After the first damming of the Tocantins River (eastern Amazon), more than half of the river floodplains were no longer inundated by floods, and the hydroperiod decreased by 15 days (Swanson et al., 2021). The Three Gorges Dam (TGD) in the upstream of the Yangtze River is the world’s largest dam and remains one of the most controversial projects in China. Previous studies showed that TGD operation, which began in 2003, has significantly changed the hydrological rhythm downstream (Zhang et al., 2015; Wang et al., 2019; Peng et al., 2020; Zheng et al., 2021). For example, Zhang et al. (2015) found that the waterflow from downstream lakes connected to the Yangtze River has increased by 57 billion m3 as compared with that during pre-TGD period. In addition, as to the TGD frequently rises the water level ahead of the dam after the flood season (Figure 1), flood recession in the downstream floodplain has been accelerated, and the water level in low-flow periods declined significantly (Wang et al., 2019; Sun et al., 2020). The flow alterations caused by dam operation might even exceed those caused by climatic changes, making it crucial to evaluate the ecological effects of dam operation.
Figure 1 Location of the Poyang Lake: (a) location of Poyang Lake in the Yangtze River Basin; (b) location of Ganjiang Northern-branch Delta (GND) and Ganjiang Southern-branch Delta (GSD) in Poyang Lake; (c) water body coverage of Poyang Lake when the lake levels reach 10, 14, and 19 m, respectively; (d) annual regulation of Three Gorges Dam
Poyang Lake wetland, the largest seasonally inundated alluvial plain in China, is hydrologically connected with the Yangtze River at the end of its middle reaches, about 1,050 km downstream of the TGD. After flood recede in autumn, the landscape composed of shallow water, mudflat, and vegetation will emerge, providing food resources and habitat for aquatic animals and wintering waterbirds (Dai et al., 2015). Landscape dynamics are driven by antecedent water regimes, which are often characterized by magnitude, frequency, duration, timing, and change rate (Casanova and Brock, 2000; Dai et al., 2016; Dai et al., 2019). For example, long flood periods can destroy aquatic vegetation by declining seedling establishment and regeneration as well as reducing plant growth rates (Maihemuti et al., 2020). An earlier arrival of low-flow periods can advance the start of the growing season, resulting in the expansion of vegetation to the lake center (Zheng et al., 2021). Although plant communities can recover to their previous state within 1 or 2 years after extreme low- or high-flow events (Li et al., 2004), long-term changes in hydrological rhythm might permanently destroy the equilibrium relationships between vegetation and hydrological factors, resulting in wetland degradation or disappearance (Fan et al., 2019; Xie et al., 2019). Both field investigation and remote sensing imagery showed that the vegetation in Poyang Lake has been continuously expanding towards the lake center, occupying the space of water and mudflats (Xie et al., 2019; Mu et al., 2020; Ni et al., 2020). Vegetation expansion and xerophilization might be related to low-flow events and were ascribed to climatic changes by Hu et al. (2015) and Mu et al. (2020). However, recent studies highlighted human activities (e.g., dam operation, sand mining) as the main factors (Lai et al., 2014; Jiang et al., 2015; Zheng et al., 2021). Han et al. (2015) and Mu et al. (2020) compared the vegetation coverage during pre-TGD and post-TGD periods and found that vegetation significantly expanded after 2003. However, it is still largely unclear how vegetation coverage is related to water level fluctuations under the operation of the TGD.
We hypothesized that TGD operation might have altered the hydrological rhythm of Poyang Lake, leading to accelerated vegetation evolution. To test this hypothesis, daily water level data were used to determine the water regimes of Poyang Lake. Additionally, Landsat imagery, which provides optical information of landcover, was applied to monitor vegetation coverages in two typical delta wetlands from 1987 to 2020 and to explore their relationships with water regimes (Figure 2). The aims of this study were as follows: (1) to investigate the changes in the water regime of Poyang Lake after TGD operation; (2) to determine the vegetation dynamics in two typical delta wetlands, namely the Ganjiang Northern-branch Delta (GND) and the Ganjiang Southern-branch Delta (GSD); (3) to understand the effects of water regime on vegetation coverage; and (4) to explore how vegetations were affected by TGD operation. This study is of great significance for understanding wetland evolution as affected by dam operation and provides a reference for optimizing basin management.
Figure 2 Flowchart showing the research methodology and the structure of this study

2 Material and methods

2.1 Study area

Poyang Lake is situated at the end of the middle reaches of the Yangtze River (28°22′-29°45′N and 115°47′-116°45′E). It receives water from rivers that originate from the surrounding mountains and discharges the waterflow into the Yangtze River through its northern outlet (Dai et al., 2014) (Figure 1). Affected by the monsoonal climate and the hydrological connectivity between rivers and lakes, the Poyang Lake water level fluctuates rhythmically. The water body covers areas of 735, 2670, and 3109 km2 when the lake levels reach 10, 14, and 19 m during low-, mean-, and high-flow periods, respectively (Figure 1c). During low-flow periods, extensive vegetation forms a zonal distribution along elevation bands, with the following typical plant communities: Carex-Phalaris community (12.5 m), Artemisia-Phragmites-Triarrhena community (13.2 m), and Cynodon community (14.3 m) (Tan et al., 2016; Zheng et al., 2020b).
Characterized by complex water regimes and a diverse topography, the Poyang Lake bottom is dominated by the delta wetland, which covers more than 60% of it (You et al., 2015). Both the GND and the GSD, located at the estuary of the northern and southern branches of the Ganjiang River, were selected for this study. They cover 39.47 and 20.08 km2, respectively, and are essential migratory bird habitats, with neglectable human disturbance. The GND, which is closer to the Yangtze River, is more susceptible to the operation of the TGD as compared to the GSD. The two deltas merge during the flood season; after flood recession, they are exposed and become vegetated (Zheng et al., 2020b).

2.2 Water regime analysis

Daily water level observations at the Xingzi station (Figure 1b) between 1987 and 2020 were used for water regime analysis. The water level data were provided by the Hydrological Bureau of Jiangxi Province and the Yangtze River Water Resources Commission and measured using Wusong’s reference elevation system, which is approximately 1.97 m a.s.l. higher than that using the Huanghai National Height Datum elevation system (Dai et al., 2016).
According to the definition of water regime (Casanova and Brock, 2000), 33 hydrological variables regarding magnitude, duration, timing, and range of variance were calculated based on daily water level observations. Specifically, average water level (AWL), water extremes (highest/lowest water level, HWL/LWL), and range of water level fluctuations (ROV) at annual and seasonal scales were calculated to determine the water conditions at different phenological stages. According to Dai et al. (2016, 2019), the antecedent water level index (AWI) is closely related to the vegetation coverage extent; therefore, average water levels of 5-30 days antecedent to the remote sensing imagery shooting were applied. In addition, the duration of the flood/dry season (DFS, DDS) may affect the length of the vegetation growing season, whereas the beginning of the flood/dry season (BFS, BDS) may lead to the advance/delay of the start/end of the growing season (Table 1).
Table 1 Hydrological variables selected for this study.
Aspect Time scale Hydrological variable
Magnitude Annual/spring/summer/autumn/winter,
antecedent 5/10/15/20/25/30 days
AWL (annual/spr/sum/aut/win), AWI day 5/10/15/20/25/30
Extremes Annual/spring/summer/autumn/winter HWL (annual/spr/sum/aut/win), LWL
(annual/spr/sum/aut/win)
Range of water level Annual/spring/summer/autumn/winter ROV (annual/spr/sum/aut/win)
Duration Flood/dry season DDS (9 m), DDS(11 m), DFS (15 m),
DFS (17 m), DFS (19 m)
Timing Flood/dry season BDS (11 m), BFS (15 m)

* AWI day 10 indicates the average water level for the antecedent 10 days. DDS (11 m) indicates the duration of lake level lower than 11 m. DFS (17 m) means the duration of lake level higher than 17 m. BDS (11 m) means the date with lake level firstly lower than 11 m after flood recede. BFS (15 m) means the date with lake level firstly higher than 15 m.

2.3 Vegetation coverage extraction

Overall, 32 remote sensing images obtained from Landsat 5 TM (1987-2011, n = 24), Landsat 7 ETM+ (2012, n = 1), and Landsat 8 OLI (2013-2020, n = 7) were collected from the United States Geological Survey (USGS, https://glovis.usgs.gov/app). All Landsat images were taken during November and December to ensure similar phenological states (Han et al., 2015). Because of cloud cover, images in 1997 and 2015 were not fit for use and were therefore excluded from the time series.
Preprocessing, including image subset mosaicking, geographic correction, radiometric correction, and Fast Line-of-sight Atmospheric Analysis of Spectral Hypercubes atmosphere correction, were completed before image classification (Han et al., 2015; Wan et al., 2019). Landscapes in the GND and the GSD were classified into vegetation, water, and mudflat areas using the Object-oriented Artificial Neural Network Regression Tool, which includes the following procedures: (1) Image segmentation with the Cognition tool; (2) calculation and combination of wave bands, where Bands 1-4, components of principal component transform, and the Normalized Difference Vegetation Index (NDVI) were selected and combined for image classification; (3) selection of training samples from contemporaneous Quickbird images; (4) Classification of Landsat images with the selected wave bands and training samples. Neural Network Regression classifiers were developed and applied for image classification. Both preprocessing and image classification were completed on the Google Earth engine platform (GEE, http://earthengine.google.org/).
In total, 309 ground truth points in GND and 222 ground truth points in GSD, collected by drones with a 20-megapixel camera, were selected for validation. Wetland cover types and the coordinate information of each sample were recorded. The standard error matrix was applied to calculate producers’ accuracy, users’ accuracy, and overall accuracy (Congalton, 1991). The kappa chance correction statistics were used to determine the kappa coefficients (Congalton, 1991). The principle of Kappa analysis is a KHAT statistic, which is computed as follows:
$K=\frac{~N\mathop{\sum }_{i=1}^{r}{{X}_{ii}}-\mathop{\sum }_{i=1}^{r}\left( {{X}_{i+}}*{{X}_{+i}} \right)}{{{N}^{2}}-\mathop{\sum }_{i=1}^{r}\left( {{X}_{i+}}*{{X}_{+i}} \right)}$
where r is the total number of rows of the matrix; Xij is the number of observations in row i and column i; Xi+ and X+i are the marginal totals of row i and column i; N is the total number of observations (Congalton, 1991).

2.4 Statistical methods

Change trends in the 33 hydrological variables, as well as the vegetation coverage in GSD and GND, were determined using the Mann-Kendall (MK) trend test. The MK statistic “S” was calculated based on the following formula (Hamed et al., 1998):
$S=\underset{i=1}{\overset{n-1}{\mathop \sum }}\,\underset{j=i+1}{\overset{n}{\mathop \sum }}\,\text{sgn}\left( {{X}_{j}}-{{X}_{i}} \right)$
where sgn(XjXi) can be computed by using Equation (3):
$\text{sgn}\left( {{x}_{j}}-{{x}_{i}} \right)\left\{ \begin{matrix} +1,\ \text{if}\ {{X}_{j}}-{{X}_{i}}>0 \\ 0,\ \text{if}\ {{X}_{j}}-{{X}_{i}}=0 \\ -1,\ \text{if}\ {{X}_{j}}-{{X}_{i}}<0 \\ \end{matrix} \right.$
where Xj and Xi are the ranked values of the series (j>i), and n is the total number of observations. For independently and identically distributed data with zero mean, the variance statistic of S is given as follows:
$var\left( S \right)=\left[ n\left( n-1 \right)\left( 2n+5 \right)-\underset{t=1}{\overset{m}{\mathop \sum }}\,t\left( t-1 \right)\left( 2t+5 \right) \right]/18$
where n is the number of observations, and t is the ties of the sample time series. The test statistics Z is as follows:
$Z=\left\{ \begin{matrix} \left( S-1 \right)/\sqrt{{{S}_{t}}},if\ {{S}_{t}}>0 \\ 0,\ if\ {{S}_{t}}=0 \\ \left( S+1 \right)/\sqrt{{{S}_{t}}},if\ {{S}_{t}}<0 \\ \end{matrix} \right.$
When the MK test is applied, it was proposed that “there is no change trend” at the 0.05 confidence level (Hamed and Rao, 1998). The statistic Z value was used to show the up/down trends; if Z > 0, the sequence is increasing and vice versa. Additionally, the possible sudden change points of time series data within a certain year from 1987 to 2020 were determined by using Pettitt’s test (Pettitt, 1979).
The influences of water regimes on vegetation coverages in the GND and the GSD were studied by applying principal components analysis (PCA), correlation analysis, and random forest analysis (RF). The PCA is a useful statistical model for incorporating a large set of relevant variable, and then extracting irrelevant variables that account for most of the variance (Brogueira et al., 2006). Factors with larger eigenvalues can be considered as significant (Brogueira and Cabecadas, 2006). All hydrological variables and vegetation coverage data were first explored for PCA constraints.
Linear relationships between hydrological variables and vegetation coverages in the GND and the GSD were analyzed by Pearson’s correlation analysis. The significance level of the correlations was determined using one-tailed significance tests. The values of the correlation coefficient ranged from -1 to 1, indicating positive (> 0)/negative (< 0) influences of hydrological variables, with larger absolute values indicating stronger relationships.
The importance of hydrological variables for vegetation coverage in the GND and the GSD was evaluated using the RF model. This model established a pre-determined number of non-linear regression trees (e.g., 1000 in this study), applying a random, bootstrapped subset of approximately 70% of the sample for training while remaining 30% of the sample for accuracy evaluation (Breiman, 2001; Cutler et al., 2007). The importance was assessed based on the percentage increase in prediction error, caused by randomly permuting the value of an explanatory variable (“Mean Decrease Accuracy”). Here, the importance of the 33 hydrological variables for vegetation coverage in the GND and the GSD was evaluated according to the “Mean Decease Accuracy” section. The above analyses were conducted in the R language.

3 Results

3.1 Water level fluctuations in Poyang Lake

Poyang Lake water levels suffered decline trends from 1987 to 2020. According to the results of the MK test (Table 2), the magnitude of the water level at multiple scales mostly declined, with the most significant decline occurring in autumn (Z = -2.68, p = 0.01). Significant declining trends (Z < 0, p < 0.05) were also found in HWL (aut), LWL (annual), LWL (spr), LWL (aut), and LWL (win), with Z values of -2.09, -2.32, -2.17, -2.45, and -3.11, respectively. Regarding the duration of the flow events, a significant increasing trend was found in DDS (11 m), with a Z value of 2.89, whereas smaller changes were found in DDS (9 m), DFS (15 m), DFS (17 m), and DFS (19 m), with Z values of 1.51, -1.56, -0.88, and -0.87, respectively. This suggests that low-flow periods became significantly longer and high-flow periods were slightly shorter during the last three decades. Regarding the timing of the dry/flood season, a significant advancing trend was found in BDS (p = 0.00, Z = -3.47), whereas no remarkable change was found in BFS (p = 0.30, Z = 1.04). Overall, the Poyang Lake wetland was subject to aridity over the last three decades.
Table 2 Change trends of 33 hydrological variables from 1987 to 2020
Aspect Hydrological variable Change point Z p
Magnitude AWL (annual) 2003 -2.09 0.04
AWL (spr) 2003 -1.41 0.16
AWL (sum) 1999 -0.47 0.64
AWL (aut) 2002 -2.68 0.01
AWL (win) 2003 -1.35 0.18
AWI day 5 2005 -1.64 0.1
AWI day 10 2005 -1.64 0.1
AWI day 15 2005 -1.27 0.21
AWI day 20 2005 -1.35 0.18
AWI day 25 2005 -1.31 0.19
AWI day 30 2005 -1.44 0.15
Extremes HWL (annual) 1999 -0.57 0.57
HWL (spr) 2005 -0.34 0.73
HWL (sum) 1999 0 1
HWL (aut) 2005 -2.09 0.04
HWL (win) 2003 -1.33 0.18
LWL (annual) 2002 -2.32 0.02
LWL (spr) 2003 -2.17 0.03
LWL (sum) 2005 -0.88 0.38
LWL (aut) 2005 -2.45 0.01
LWL (win) 2002 -3.11 0
Range of water level ROV (annual) 1999 -0.05 0.96
ROV (spr) 1998 0.65 0.52
ROV (sum) 2000 0.36 0.72
ROV (aut) 2010 0.05 0.96
ROV (win) 2003 -0.49 0.63
Duration DDS (9 m) 2003 1.51 0.13
DDS (11 m) 2003 2.89 0
DFS (15 m) 2000 -1.56 0.12
DFS (17 m) 1999 -0.88 0.38
DFS (19 m) 1999 -0.87 0.39
Timing BFS (15 m) 2003 1.04 0.3
BDS (11 m) 2005 -3.47 0
According to the results of Pettitt’s test, Poyang Lake level suffered a sudden change after the implementation of the TGD. Specifically, among the nine hydrological variables that significantly changed (p < 0.05), sudden changes in AWL (aut), LWL (annual), and LWL (win) occurred in 2002, whereas AWL (annual), LWL (spr), and DDS (11 m) drastically changed in 2003. The HWL (aut), LWL (aut), and BDS (11 m) suddenly changed in 2005 (Table 2). Figure 3 shows the interannual variations of the nine significantly changed hydrological variables. The sudden change points as detected by Pettitt’s test are the result of sharp drops in water level, especially during dry seasons. Overall, the Poyang Lake water level during the dry season rapidly decreased after the impoundment of the TGD in 2003.
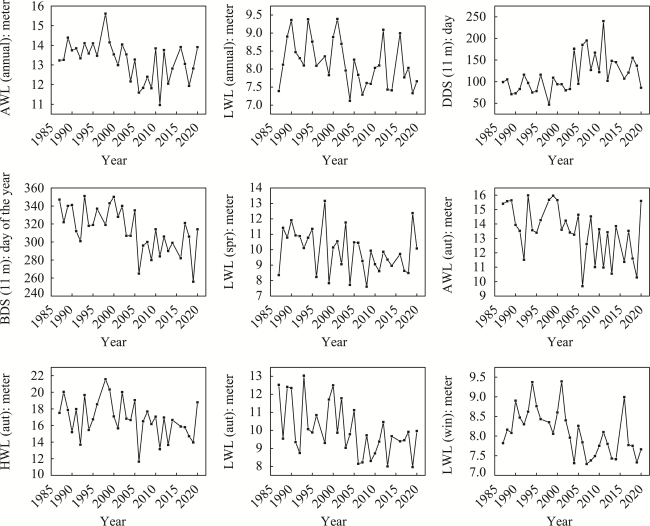
Figure 3 Interannual variations in 9 significantly changed hydrological variables

3.2 Vegetation coverage dynamics in the GND and the GSD

Landcover types in the GND and the GSD were classified into vegetation, water, and mudflat, using Object-oriented Artificial Neural Network Regression (Figure 4). The overall classification accuracy of the GND and the GSD in 2017 reached 97.41% and 95.94%, respectively, and the Kappa coefficients were 0.94 and 0.96, respectively (Tables 1 and 2 in Supplementary Material).
Figure 4 Classification maps of the GND and the GSD between 1987 and 2020
Vegetation coverage area in both the GND and the GSD increased significantly (p < 0.05) over the last three decades, with Z values of 4.30 and 4.01, respectively (Figure 5). In the GND, vegetation coverage increased at a rate of 0.39 km2/year. Vegetation covered 6.11 km2 in 1987 and peaked in 2017 (18.37 km2). However, vegetation coverage dropped to only 1.08 km2 in 2020 due to the extremely high-water level during dry seasons. In the GSD, vegetation coverage increased at a rate of 0.22 km2/year. Vegetation covered 4.10 km2 in 1987 and peaked in 2013, reaching 15.60 km2. The results of Pettitt’s test show that the sudden change point of vegetation coverage in the GND and GSD occurred in 2005 and 2003, respectively. In addition, greater annual variations in vegetation coverage were detected after the impoundment of the TGD as compared with those during pre-TGD periods (Figure 5).
Figure 5 Change trends in vegetation coverages in the GND and the GSD between 1987 and 2020

3.3 Vegetation responses to water level fluctuations in the GSD and GND

We applied PCA to determine the relationships between vegetation coverage and 33 hydrological variables. Figure 6a shows the loadings of the first two factors for the GND, which explained 58.6% of the total variation. The eigenvalues of Factors 1 and 2 were 3.23 and 2.19, respectively. Figure 6b shows the first two loadings in the GSD, which explained 58.0% of the total variance. The eigenvalues of Factors 1 and 2 were 3.20 and 2.17, respectively. In both the GND and the GSD, Factor 1 was closely linked with variables indicating low-flow events, e.g., DDS (9 m), DDS (11 m), HWL (aut), and AWL (win), whereas Factor 2 was closely linked with ROV (spr), ROV (sum), and AWI day 5/10/15/20/25/30. The relationships between vegetation coverage and hydrological variables, as indicated by the PCA, were similar between the GND and the GSD, and the vegetation area was negatively related with the water level in the dry season, especially the AWI day 5/10/15/20/25/30.
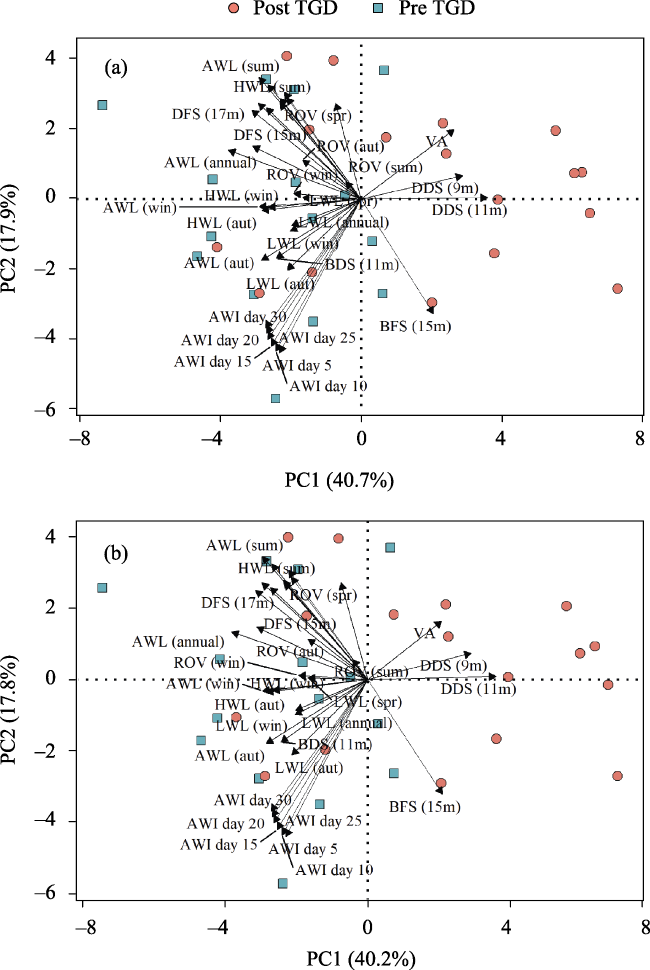
Figure 6 Ordination plot by principal component analysis (PCA) based on 33 hydrological variables and vegetation area (VA = vegetation area): (a) GND; (b) GSD
During pre-TGD period (1987-2002), vegetation coverage in the GND was most responsive to AWI day 5/10/15/20/25/30, with coefficient values of -0.54, -0.51, -0.52, -0.54, -0.55, and -0.54 respectively. During the post-TGD period (2003-2020), the correlation coefficients of AWI day 5/10/15/20/25/30 increased, reaching values of -0.61, -0.64, -0.65, -0.65, -0.63, and -0.61, respectively. In addition, during the post-TGD period, the correlation coefficients of some low-flow events, such as AWL (aut), HWL (aut), DDS (11 m), and BDS (11 m), were -0.62, -0.57, -0.54, 0.55, and -0.50, respectively, and were considerably higher than those during pre-TGD (0.2, 0.02, 0.21, 0.15, and -0.19, respectively) (Figure 7a). In the GSD, vegetation coverage was less responsive to water level fluctuations than in the GND. During pre-TGD periods, LWL (win), DFS (15 m), AWI day 25/30, and AWL (aut) were more closely related with vegetation coverage, with coefficient values of 0.54, -0.45, -0.33, -0.35, and -0.32, respectively. After the implementation of the TGD, low-flow events, e.g., BDS (11 m), LWL (aut), AWL (aut), and AWI day 5/10/15/20/25/30, were more significantly related with vegetation coverage, with coefficient values of -0.49, -0.42, -0.44, -0.34, -0.36, -0.35, -0.34, -0.34, and -0.33, respectively (Figure 7b). In summary, vegetation coverage was more responsive to water level fluctuations after the implementation of the TGD in both the GND and the GSD.
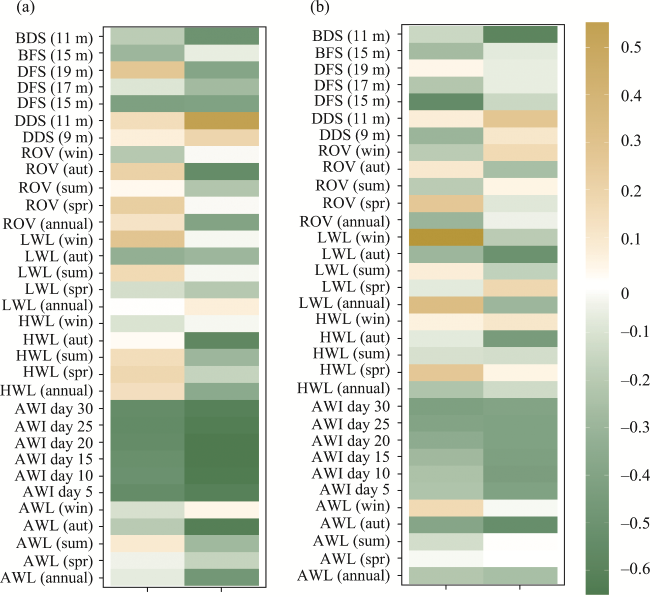
Figure 7 Correlation coefficients between vegetation coverage and 33 hydrological variables pre/post-TGD operation: (a) GND; (b) GSD
The RF model was used to assess the importance of hydrological variables in affecting vegetation coverage in the GND and the GSD before and after the impoundment of the TGD (Figure 8). During the pre-TGD period (1987-2002), the three hydrological variables AWI day 25, AWI day 30, and AWI day 20 were the most important ones (Figure 8a). However, after the implementation of the TGD (2003-2020), BDS (11 m), AWI day 20, and AWI day 10 were the most important variables (Figure 8b). The above results indicate that the lake bottom in the GND was subject to fluctuating water regimes, with vegetation distribution changes every 25-30 days to adapt to the everchanging inundation conditions before the implementation of the TGD. However, after TGD implementation, the response time was reduced to 10-20 days. Additionally, BDS (11 m) became the most significant hydrological variable in affecting vegetation coverage after TGD implementation. In summary, after the impoundment of the TGD, the response time of vegetation to water level fluctuations in the GND was shortened, and low-flow events, especially BDS (11 m), became more influential for vegetation coverage.
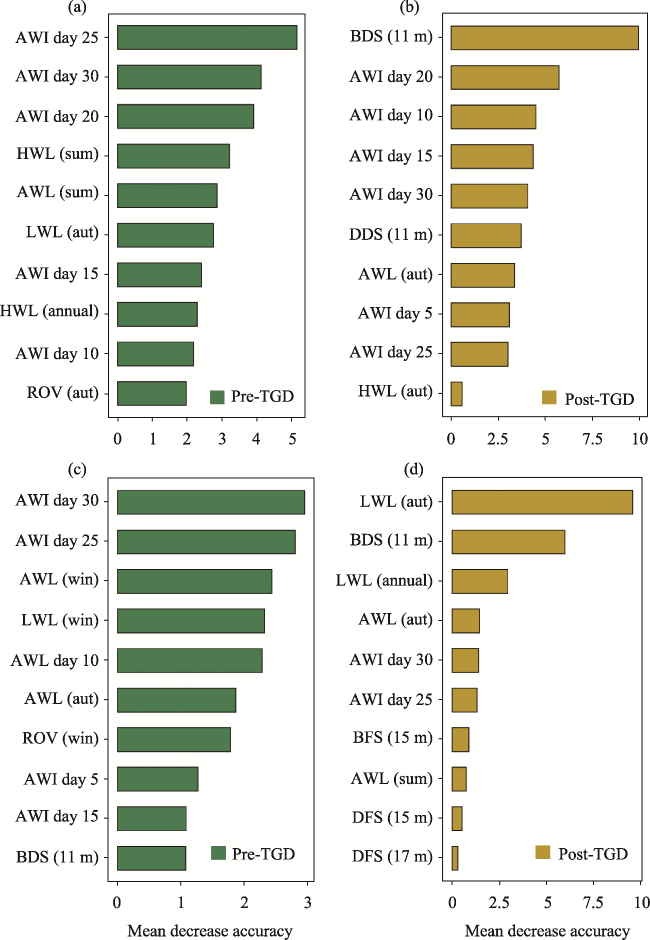
Figure 8 Variable importance plot for the hydrological variables in the random forest regression model. Higher value means the variable is more important in determining the accuracy of the prediction (a and b: GND; c and d: GSD)
In the GSD, the top three hydrological variables during the pre-TGD period (1987-2002) were AWI day 30, AWI day 25, and AWL (win), respectively (Figure 8c). After the operation of the TGD (2003-2020), low-flow events, e.g., LWL (aut), BDS (11 m), and LWL (annual), became the most important hydrological variables in affecting vegetation coverage (Figure 8d). In summary, vegetation coverage in the GSD was also more responsive to low-flow events after the implementation of the TGD.

4 Discussion

This study assessed the vegetation dynamics in typical delta wetlands of Poyang Lake in relation to the TGD. Damming of the Yangtze River coincided with significant variations in Poyang Lake inundation. As we predicted, after the implementation of the TGD, Poyang Lake became drier, especially during the low-flow periods, making the delta wetland vegetation more responsive to low-flow events.

4.1 Influences of TGD operation on water level fluctuations in connected wetlands

Since the operation of TGD, the potential impacts of TGD on the downstream wetlands have been of high concern. Previous studies confirmed that the TGD has significantly altered the downstream hydrological rhythm by regularly storing and releasing water (Chen et al., 2018; Cheng et al., 2018; Wang et al., 2019; Huang et al., 2021), which works as follows: (1) The dam reservoir level is controlled at a level of about 145 m during June to September (flood season for the Yangtze River basin) for flood control. (2) In September, the dam reservoir starts to raise the operating water level to store water for electricity generation when the reservoir level reaches 175 m in November. (3) From November to January the following year (dry season for the Yangtze River basin), the reservoir level is maintained at 175 m. (4) From January onward, the dam reservoir starts to increase the outflow to ensure standard power generation until the reservoir level reaches 145 m in June (Peng et al., 2020; Zheng et al., 2020a).
Water regimes in Poyang Lake indicating magnitude, variation, duration, and timing showed drying trends after the implementation of the TGD. The drying of Poyang Lake might result from the “empty effects of the TGD”, which can be explained by the following processes: (1) Enhancement of channel erosion after the implementation of the TGD. According to previous studies, sediment transported from upstream of the Yangtze River during 2003-2017 was reduced by 67.8%-92.7% as compared with that during pre-TGD periods (1955-2002) (Sun and Ma, 2020; Yang et al., 2022). Topographic measurements showed that channel erosion on convex banks, e.g., Hukou (Figure 1a), considerably lowered the river beds, which resulted in a decline in the downstream water level (Luo et al., 2014; Zhu et al., 2014; Yang et al., 2018); (2) The operation regulation of the TGD lowered the downstream water level during the dry season. At the end of the flood season (September), the impoundment of the TGD reduces the discharge of outflow to maintain a high reservoir level for electricity generation, and such operations might decrease the water level of the Yangtze River. For example, as compared with pre-TGD periods (1957-2002), the water level at Hukou station during January-March increased by 0.14-0.44 m as a result of TGD operation, whereas the average water level from September to November decreased by 1.7 m after TGD implementation (Jiang et al., 2019; Wang et al., 2019); (3) The above two processes increased hydraulic gradient between Poyang Lake and Yangtze River, and finally accelerated the drainage of Poyang Lake especially in the dry seasons (Peng et al., 2020; Zheng et al., 2021). Since the TGD impounds water approximately 30 days before the dry season, most downstream lakes, including Dongting Lake (Figure 1a) and Poyang Lake, are exposed prematurely (Cheng et al., 2018; Zheng et al., 2021). This may explain the lower lake level during autumn as well as the earlier arrival and longer duration of the dry season.

4.2 Increasing impacts of low-flow events on vegetation coverage after TGD implementation

Interactions between water level fluctuations and vegetation coverage are generally changeable, and shifts in the hydrological rhythm might lead to changes in driving factors for vegetation coverage. By applying correlation coefficient analysis and the non-linear RF model, two major changes were detected. First, the impacts of low-flow events on delta vegetation coverage increased, and second, the response time of delta vegetation to water regime changes shortened.
The growing impact of low-flow events on Poyang vegetation dynamics, as indicated in Figures 7 and 8, can be explained as follows: First, Poyang Lake is in a region with a warm and humid climate, with abundant solar radiation and fertile floodplain soil. Consequently, inundation is the only limiting factor for vegetation growth (Mu et al., 2020). The multiple responses of vegetation growth to upstream dams are complex and occur because of several sequential processes, including water level fluctuations, inundation changes, and vegetation succession. According to Dai et al. (2016), vegetation growth can be completed within 20-30 days after wetland exposure, but extremely high lake levels over a long period of time may disrupt the vegetation growth rhythm. For example, the catastrophic floods in 1998 decreased both vegetation species number and biomass in 1999 (Li et al., 2004). This indicates that vegetation is jointly controlled by both low-flow and high-flow events. Since the dam reservoir level was controlled at a level of approximately 145 m during the wet season for flood control, the frequency, magnitude, and duration of floods decreased significantly, leading to fewer flood disturbances for vegetation. However, dam impoundment accelerated the drainage of Poyang Lake and enhanced the low-flow periods, resulting in an earlier and longer exposure of the delta and, consequently, in earlier seed germination (Jiang et al., 2019; Zheng et al., 2021). More extensive low-flow events inevitably exerted greater influences on Poyang Lake vegetation. Second, the lower lake level during the dry season also allows for more exposed delta wetlands, leading to the expansion of vegetation to the lake center. According to previous studies, in both Poyang Lake and Dongting Lake, some typical xerophytes, such as Herba Lespedezae Cuneatae, Arundinella hirta (Thunb.) C. Tanaka, and Imperata cylindrica (Linn.) Beauv, invaded and occupied the wetlands at higher elevation bands (Xie et al., 2008; Hu et al., 2015; Wu et al., 2017). Hydrophytes and phreatophytes then expanded towards the lake center, resulting in inundation shrinkage and the risk of wetland degradation (Zheng et al., 2021). This vegetation succession and expansion might further amplify the positive effects of low-flow events on vegetation in delta wetlands.
The shortened response time of delta vegetation to water regime changes is also closely related to the operation of the TGD. Results of the correlation analysis and importance ranking from the RF model indicated that, from 1987 to 2002, AWI day 25 and AWI 30 were most important for vegetation coverage in the GND. However, during 2003 and 2020, AWI day 20 and AWI 10 were more important. Similarly, in the GSD, the correlation coefficient of AWI day 30 was highest among the antecedent near-term fluctuations during the pre-TGD period, whereas after TGD implementation, the correlation coefficient of AWI day 10 was highest. In summary, the response time of vegetation to water level fluctuation was 20-30 days before TGD implementation and was shorter afterward. Water storage of the dam begins in September, and impoundment reduces the discharge and lowers the downstream river level; consequently, the hydraulic gradient in Hukou passively increases, which accelerates the drainage of Poyang Lake. Therefore, the recession of Poyang Lake was completed within a shorter period as compared to that during the pre-TGD period. The rapidly declining lake level results in the sudden exposure of a large mudflat area, providing more space and time for vegetation growth (Xie et al., 2019; Sun and Ma, 2020; Zheng et al., 2021). Against the background of a changing climate and human disturbances (e.g., dam operation), vegetation communities sensitive to water level fluctuations (e.g., Ottelia alismoides, Potamogeton maackianus A. Bennett) are decreasing, whereas those insensitive to environmental changes (e.g., Potamogeton crispus L.) are gradually expanding (Hu et al., 2015; Fan et al., 2019). The reduced sensitivity of the vegetation to water level changes may also be one of the reasons why vegetation growth is completed within a shorter period.
Damming effects on downstream wetlands have received more attention in recent years (Tombolini et al., 2014). The role of dam operation in hydrogeomorphic alterations and downstream wetland vegetation is linked to dam management and local climate patterns. Dongting Lake, the second largest freshwater lake in China, shares many similarities with Poyang Lake. Dongting Lake is located 300 km2 upstream of Poyang Lake and also naturally connected with the Yangtze River at the south bank (Figure 1a). After the implementation of the TGD, the magnitude, duration, and frequency of flood events in Dongting Lake significantly decreased, and hygrophytes at higher elevation bands gradually evolved into xerophytes. The succession sequence generally began after the implementation of the TGD in 2003 and was as follows: aquatic plants, Phalaris arundinacea or Carex sp., Phragmites australis, and ligneous plants (Xie and Chen, 2008; Yang et al., 2019). Vegetation evolution caused by dam operation has also been reported for Europe and North America (Benjankar et al., 2012; Ceschin et al., 2015; Swanson et al., 2021). Most previous studies concluded that the main vegetation changes occurred during the first decade after dam construction, with the gradual formation of new sub-lentic wetlands (Tombolini et al., 2014; Ablat et al., 2019). However, the scales of the above dams are much smaller than that of the TGD. Large dams generate far-reaching impacts on the basin (Huang et al., 2021), and obviously, the vegetation patterns in Poyang Lake and Dongting Lake are far from being balanced, thought the TGD has been operating for about 2 decades. It is therefore of great significance to continue monitoring ecological changes in wetlands downstream the Yangtze River. We also highlight that more basin management strategies or new dam operation regulations are needed to protect the delta wetlands from xerophilization and degradation.

5 Conclusions

This study compared vegetation coverage and responses to water level fluctuations across two typical delta wetlands pre- and post-TGD operation. We concluded that (1) after the impoundment of the TGD, the Poyang Lake became drier, especially during low-flow periods, as indicated by the lower lake level as well as the earlier arrival and longer period of the dry season; (2) vegetation coverage in the GND and GSD increased and varied considerably after the implementation of the TGD; (3) low-flow events, e.g., BDS and DDS, had higher impacts on vegetation growth after TGD implementation; (4) the impoundment of the TGD in September shortened the response time of vegetation to water regime changes. This study improves our knowledge of the effects of TGD operation on downstream wetlands and provides a starting point for evaluating the potential impacts of newly proposed dams on wetlands.
[1]
Ablat X, Liu G, Liu Q et al., 2019. Application of Landsat derived indices and hydrological alteration matrices to quantify the response of floodplain wetlands to river hydrology in arid regions based on different dam operation strategies. Science of the Total Environment, 688: 1389-1404.

DOI

[2]
Alizadeh-Choobari O, Ahmadi-Givi F, Mirzaei N et al., 2016. Climate change and anthropogenic impacts on the rapid shrinkage of Lake Urmia. International Journal of Climatology, 36(13): 4276-4286.

DOI

[3]
Benjankar R, Jorde K, Yager E M et al., 2012. The impact of river modification and dam operation on floodplain vegetation succession trends in the Kootenai River, USA. Ecological Engineering, 46: 88-97.

DOI

[4]
Breiman L, 2001. Random forests. Machine Learning, 45: 5-32.

DOI

[5]
Brogueira M J, Cabecadas G, 2006. Identification of similar environmental areas in Tagus estuary by using multivariate analysis. Ecological Indicators, 6(3): 508-515.

DOI

[6]
Casanova M T, Brock M A, 2000. How do depth, duration and frequency of flooding influence the establishment of wetland plant communities? Plant Ecology, 147(2): 237-250.

DOI

[7]
Ceschin S, Tombolini I, Abati S et al., 2015. The effect of river damming on vegetation: Is it always unfavourable? A case study from the River Tiber (Italy). Environmental Monitoring and Assessment, 187(5): 301.

DOI PMID

[8]
Chen M, Deng J, Fan S et al., 2018. Applying energy theory to understand the relationship between the Yangtze River and Poyang Lake. Journal of Geographical Sciences, 28(8): 1059-1071.

DOI

[9]
Cheng J, Xu L, Wang X et al., 2018. Assessment of hydrologic alteration induced by the Three Gorges Dam in Dongting Lake, China. River Research and Applications, 34(7): 686-696.

DOI

[10]
Congalton R G, 1991. A review of assessing the accuracy of classifications of remotely sensed data. Remote Sensing of Environment, 37(1): 35-46.

DOI

[11]
Cutler D R, Edwards T J, Beard K H et al., 2007. Random forests for classification in ecology. Ecology, 88(11): 2783-2792.

DOI PMID

[12]
Dai X, Wan R, Yang G et al., 2014. Temporal variation of hydrological rhythm in Poyang Lake and the associated water exchange with the Changjiang River. Scientia Geographica Sinica, 34(12): 1488-1496. (in Chinese)

DOI

[13]
Dai X, Wan R R, Yang G S, 2015. Non-stationary water-level fluctuation in China’s Poyang Lake and its interactions with Yangtze River. Journal of Geographical Sciences, 25(3): 274-288.

DOI

[14]
Dai X, Wan R R, Yang G S et al., 2016. Responses of wetland vegetation in Poyang Lake, China to water-level fluctuations. Hydrobiologia, 773(1): 35-47.

DOI

[15]
Dai X, Wan R R, Yang G S et al., 2019. Impact of seasonal water-level fluctuations on autumn vegetation in Poyang Lake wetland, China. Frontiers of Earth Science, 13(2): 398-409.

DOI

[16]
Ely P, Fantin-Cruz I, Tritico H M et al., 2020. Dam-induced hydrologic alterations in the rivers feeding the pantanal. Frontiers in Environmental Science, 8: 579031.

DOI

[17]
Fan H, Xu L, Wang X et al., 2019. Relationship between vegetation community distribution patterns and environmental factors in typical wetlands of Poyang Lake, China. Wetlands, 39(1): S75-S87.

[18]
Hamed K H, Rao A R, 1998. A modified Mann-Kendall trend test for autocorrelated data. Journal of Hydrology, 204(1-4): 182-196.

DOI

[19]
Han X, Chen X, Feng L, 2015. Four decades of winter wetland changes in Poyang Lake based on Landsat observations between 1973 and 2013. Remote Sensing of Environment, 156: 426-437.

DOI

[20]
Hu Z, Ge G, Liu C L, 2015. Cause analysis and early warning for wetland vegetation degradation in Poyang Lake. Resources and Environment in the Yangtze Basin, 24(3): 381-386. (in Chinese)

[21]
Huang S, Xia J, Zeng S et al., 2021. Effect of Three Gorges Dam on Poyang Lake water level at daily scale based on machine learning. Journal of Geographical Sciences, 31(11): 1598-1614.

DOI

[22]
Jiang C, Zhang Q, Luo M, 2019. Assessing the effects of the Three Gorges Dam and upstream inflow change on the downstream flow regime during different operation periods of the dam. Hydrological Processes, 33(22): 2885-2897.

DOI

[23]
Jiang F, Qi S, Liao F et al., 2015. Hydrological and sediment effects from sand mining in Poyang Lake during 2001-2010. Acta Geographica Sinica, 70(5): 837-845. (in Chinese)

DOI

[24]
Kentula M E, 2000. Perspectives on setting success criteria for wetland restoration. Ecological Engineering, 15(3/4): 199-209.

DOI

[25]
Lai X, Shankman D, Huber C et al., 2014. Sand mining and increasing Poyang Lake’s discharge ability: A reassessment of causes for lake decline in China. Journal of Hydrology, 519: 1698-1706.

DOI

[26]
Li W, Liu G, Xiong B et al., 2004. The restoration of aquatic vegetation in lakes of Poyang Lake Nature Reserve after catastrophic flooding in 1998. Journal of Wuhan Botanical Research, 22(4): 301-306. (in Chinese)

[27]
Luo W, Zhang X, Deng Z et al., 2014. Runoff and sediment load transport and cause analysis in Poyang Lake basin over the period 1956-2008. Advances in Water Science, 25(5): 658-667. (in Chinese)

[28]
Maihemuti B, Aishan T, Simayi Z et al., 2020. Temporal scaling of water level fluctuations in shallow lakes and its impacts on the lake eco-environments. Sustainability, 12(9): 3541.

DOI

[29]
Mu S, Li B, Yao J et al., 2020. Monitoring the spatio-temporal dynamics of the wetland vegetation in Poyang Lake by Landsat and MODIS observations. Science of the Total Environment, 725: 138096.

DOI

[30]
Ni Z, Wang S, Wu Y et al., 2020. Influence of exposure time on phosphorus composition and bioavailability in wetland sediments from Poyang Lake, since the operation of the Three Gorges Dam. Environmental Pollution, 263: 114591.

DOI

[31]
Nicholls R J, 2004. Coastal flooding and wetland loss in the 21st century: Changes under the SRES climate and socio-economic scenarios. Global Environmental Change: Human and Policy Dimensions, 14(1): 69-86.

DOI

[32]
Nilsson C, Reidy C A, Dynesius M et al., 2005. Fragmentation and flow regulation of the world’s large river systems. Science, 308(5720): 405-408.

DOI

[33]
Peng T, Tian H, Singh V P et al., 2020. Quantitative assessment of drivers of sediment load reduction in the Yangtze River Basin, China. Journal of Hydrology, 580: 124242.

DOI

[34]
Pettitt A N, 1979. A non-parametric approach to the change-point problem. Journal of the Royal Statistical Society Series, 28(2): 126-135.

[35]
Sun F, Ma R, 2020. Hydrologic changes of Poyang Lake based on radar altimeter and optical sensor. Acta Geographica Sinica, 75(3): 544-557. (in Chinese)

DOI

[36]
Swanson A C, Kaplan D, Toh K B et al., 2021. Changes in floodplain hydrology following serial damming of the Tocantins River in the eastern Amazon. Science of the Total Environment, 800: 149494.

DOI

[37]
Tan Z, Zhang Q, Li Y et al., 2016. Distribution of typical vegetation communities along elevation in Poyang Lake wetlands. Wetland Science, 14(4): 506-515. (in Chinese)

[38]
Tombolini I, Caneva G, Cancellieri L et al., 2014. Damming effects on upstream riparian and aquatic vegetation: The case study of Nazzano (Tiber River, central Italy). Knowledge and Management of Aquatic Ecosystems, 412: 350-353.

[39]
Wan R, Wang P, Wang X et al., 2019. Mapping aboveground biomass of four typical vegetation types in the Poyang Lake wetlands based on random forest modelling and landsat images. Frontiers in Plant Science, 10: 1281.

DOI PMID

[40]
Wang D, Zhang S, Wang G et al., 2019. Quantitative assessment of the influences of Three Gorges Dam on the water level of Poyang Lake, China. Water, 11(7): 1519.

DOI

[41]
Wu G, Liu Y, 2017. Assessment of the hydro-ecological impacts of the Three Gorges Dam on China’s largest freshwater lake. Remote Sensing, 9(10): 1069.

DOI

[42]
Xie D, Huang Q, Yi Q et al., 2019. Changes in floodplain vegetation in Poyang Lake wetlands. Acta Ecologica Sinica, 39(11): 4070-4079. (in Chinese)

[43]
Xie Y, Chen X, 2008. Effects of Three-Gorge Project on succession of wetland vegetation in Dongting Lake. Research of Agricultural Modernization, 29(6): 684-687. (in Chinese)

[44]
Yang N, Mo W, Zhang X et al., 2019. Analysis of vegetation spatio-temporal variation based on NDVI of east Dongting wetland over the past 30 years. Journal of Central South University of Forestry & Technology, 39(7): 19-30. (in Chinese)

[45]
Yang Y, Zhang M, Sun Z et al., 2018. The relationship between water level change and river channel geometry adjustment in the downstream of the Three Gorges Dam. Journal of Geographical Sciences, 28(12): 1975-1993.

DOI

[46]
Yang Y, Zheng J, Zhang H et al., 2022. Impact of the Three Gorges Dam on riverbed scour and siltation of the middle reaches of the Yangtze River. Earth Surface Processes and Landforms, 47(6): 1514-1531.

DOI

[47]
You H, Xu L, Liu G et al., 2015. Effects of inter-annual water level fluctuations on vegetation evolution in typical wetlands of Poyang Lake, China. Wetlands, 35(5): 931-943.

DOI

[48]
Zedler J B, Kercher S, 2005. Wetland resources: Status, trends, ecosystem services, and restorability. Annual Review of Environment and Resources, 30: 39-74.

DOI

[49]
Zhang Z, Chen X, Xu C Y et al., 2015. Examining the influence of river-lake interaction on the drought and water resources in the Poyang Lake basin. Journal of Hydrology, 522: 510-521.

DOI

[50]
Zheng L, Xu J, Tan Z et al., 2020a. A thirty-year Landsat study reveals changes to a river-lake junction ecosystem after implementation of the Three Gorges Dam. Journal of Hydrology, 589: 125185.

DOI

[51]
Zheng L, Xu J, Wang D et al., 2021. Acceleration of vegetation dynamics in hydrologically connected wetlands caused by dam operation. Hydrological Processes, 35(2): e14026.

[52]
Zheng L, Zhan P, Xu J et al., 2020b. Aquatic vegetation dynamics in two pit lakes related to interannual water level fluctuation. Hydrological Processes, 34(11): 2645-2659.

DOI

[53]
Zhu L, Chen J, Yuan J et al., 2014. Sediment erosion and deposition in two lakes connected with the middle Yangtze River and the impact of Three Gorges Reservoir. Advances in Water Science, 25(3): 348-357. (in Chinese)

Outlines

/