
Journal of Geographical Sciences >
Coordinated development efficiency between cultivated land spatial morphology and agricultural economy in underdeveloped areas in China: Evidence from western Hubei province
|
Xiang Jingwei (1987-), Associate Professor, specialized in land use change and sustainable use of land resources in mountain areas. E-mail: xiangjw@cug.edu.cn |
Received date: 2022-05-07
Accepted date: 2022-09-26
Online published: 2023-05-11
Supported by
National Natural Science Foundation of China(71804168)
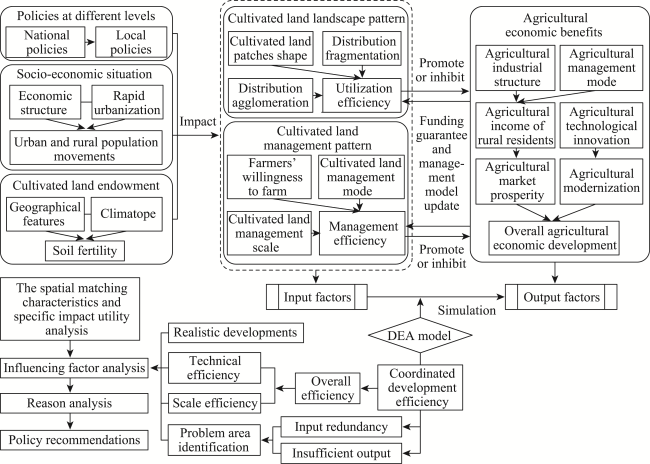
Suitable spatial morphology of cultivated land is a basic requirement for sustaining agricultural economic development in mountainous areas. Coordinated development efficiency of cultivated land spatial morphology and agricultural economy (CECA) is of great practical significance to measure the efficiency of cultivated land use, and thereby promote regional rural revitalization. However, few studies to date have focused on coordinated development efficiency between cultivated land use and agricultural economy in mountainous areas from the perspective of cultivated land spatial morphology. Thus, the present study explores CECA with this focus using the data envelopment analysis method, and analyzes the key influencing factors via a geographical detector model in 16 counties in western Hubei province. The results show the following: (1) CECA exhibits significant spatial heterogeneity that is high in the south of the study area and low in the north; (2) scale efficiency is the primary limiting factor for CECA; (3) the insufficient output of cultivated land use mainly restricts CECA in the south of the study area, while individual county in the north suffered from input redundancy and insufficient output; and (4) population density in the southern region has the most significant effect on CECA, and gross domestic product has the greatest impact in the northern region. The results contribute to the derivation of specific measures by which to promote cultivated land use efficiency and sustainable development of the social economy.
XIANG Jingwei , HAN Peng , CHEN Wanxu . Coordinated development efficiency between cultivated land spatial morphology and agricultural economy in underdeveloped areas in China: Evidence from western Hubei province[J]. Journal of Geographical Sciences, 2023 , 33(4) : 801 -822 . DOI: 10.1007/s11442-023-2107-9
Figure 1 Research framework of CECA in underdeveloped areas |
Table 1 Evaluation index system of CECA based on an input-output model |
| Elements | Factor | Index | Calculation | Data sources |
|---|---|---|---|---|
| Input elements | Landscape pattern | Cultivated land fragmentation (X1) | Cultivated land patch quantity / land area | Chinese County Statistical Yearbook (1995-2015), Hubei Province Statistical Yearbook (1995-2015), Resources and Environmental Sciences Data Center of the Chinese Academy of Sciences (2019) |
| Cultivated land agglomeration (X2) | Adjacent patch quantity / cultivated land patch quantity | |||
| Proportion of paddy in cultivated land (X3) | Paddy field quantity / cultivated land quantity | |||
| Management pattern | Management of cultivated land fragmentation (X4) | Simpson Index | ||
| Per capita cultivated land (X5) | Cultivated land quantity / permanent resident population | |||
| Per household land plots (X6) | Cultivated land patch quantity / household quantity | |||
| Output elements | Agricultural economic benefits | Agricultural output (Y1) | Agricultural output statistics | Chinese County Statistical Yearbook (1995-2015), Hubei Province Statistical Yearbook (1995-2015) |
| Added value of agriculture (Y2) | Agricultural added value statistics | |||
| Per capita agricultural income for rural residents (Y3) | Agricultural income of rural residents / rural population |
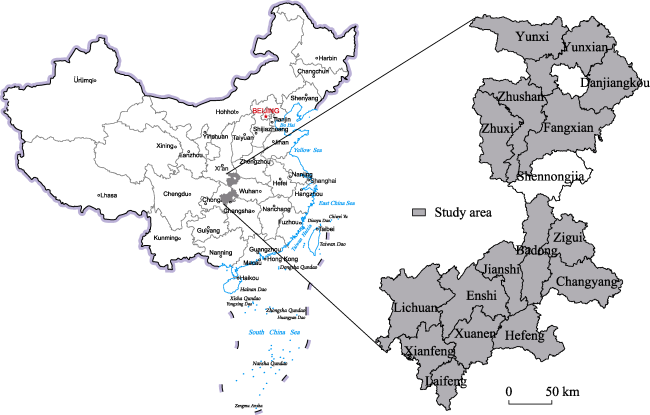
Figure 2 Location of the study area (western Hubei province, central China) |
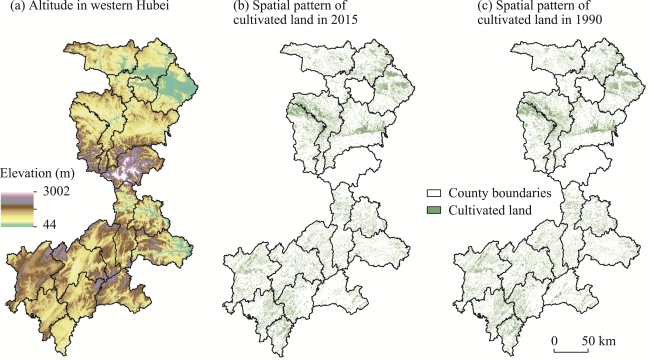
Figure 3 Altitude and spatial pattern of cultivated land in western Hubei province(Source: Resources and Environmental Sciences Data Center of the Chinese Academy of Sciences, 2019) |
Table 2 Efficiency values for coordinated development |
| Counties | Overall efficiency | Technical efficiency | Scale efficiency | Scale gains |
|---|---|---|---|---|
| Yunxian | 1.000 | 1.000 | 1.000 | — |
| Zigui | 1.000 | 1.000 | 1.000 | — |
| Changyang | 1.000 | 1.000 | 1.000 | — |
| Enshi | 1.000 | 1.000 | 1.000 | — |
| Lichuan | 1.000 | 1.000 | 1.000 | — |
| Laifeng | 1.000 | 1.000 | 1.000 | — |
| Hefeng | 1.000 | 1.000 | 1.000 | — |
| Danjiangkou | 0.999 | 1.000 | 0.999 | Increased |
| Zhuxi | 0.996 | 1.000 | 0.996 | Increased |
| Zhushan | 0.897 | 1.000 | 0.897 | Increased |
| Fangxian | 0.869 | 1.000 | 0.869 | Increased |
| Jianshi | 0.853 | 1.000 | 0.853 | Increased |
| Badong | 0.811 | 1.000 | 0.811 | Increased |
| Xianfeng | 0.771 | 1.000 | 0.771 | Increased |
| Yunxi | 0.652 | 0.999 | 0.653 | Increased |
| Xuan’en | 0.444 | 1.000 | 0.444 | Increased |
Table 3 Counties with problems of input redundancy and insufficient output in 16 counties in western Hubei province |
| Counties | Types | Location | Input redundancy | Insufficient output | |||||||
|---|---|---|---|---|---|---|---|---|---|---|---|
| X1 | X2 | X3 | X4 | X5 | X6 | Y1 | Y2 | Y3 | |||
| Yunxi | Input redundancy and insufficient output are balanced | North of the study area | 0.001 | 0.001 | 0.001 | 0.001 | 0.007 | 0.003 | 0.323 | 0.457 | 0.034 |
| Jianshi | Insufficient output dominated | South of the study area | 0.000 | 0.000 | 0.000 | 0.000 | 0.004 | 0.002 | 0.000 | 0.349 | 0.018 |
| Badong | 0.000 | 0.000 | 0.000 | 0.000 | 0.004 | 0.001 | 0.017 | 0.000 | 0.013 | ||
| Xianfeng | 0.000 | 0.000 | 0.000 | 0.000 | 0.001 | 0.000 | 0.215 | 0.614 | 0.007 | ||
| Xuan’en | 0.000 | 0.000 | 0.000 | 0.000 | 0.006 | 0.001 | 1.181 | 1.123 | 0.042 | ||
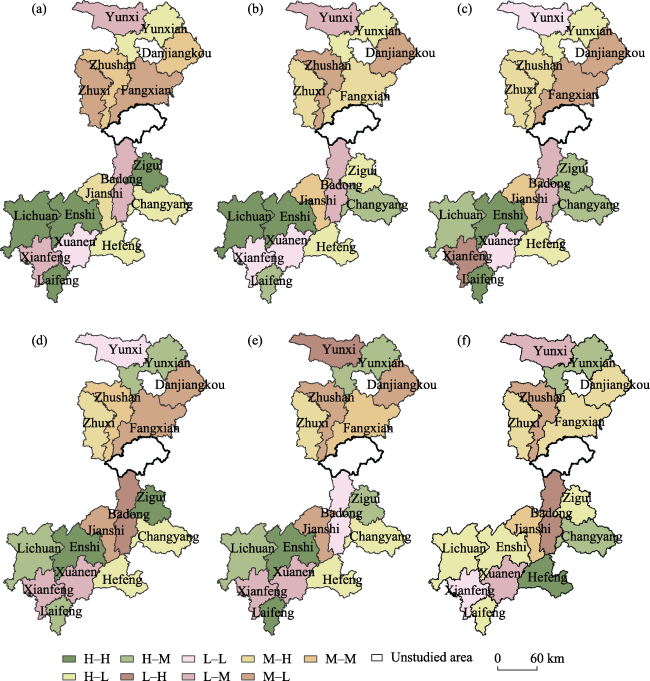
Figure 4 Spatial matching characteristics of coordinated development efficiency and influencing factors in western Hubei province(Notes: H-H: High coordinated development efficiency and high element level; H-M: High coordinated development efficiency and medium element level; H-L: High coordinated development efficiency and low element level; M-L: Medium coordinated development efficiency and high element level; M-M: Medium coordinated development efficiency and medium element level; M-L: Medium coordinated development efficiency and low element level; L-H: Low coordinated development efficiency and high element level; L-M: Low coordinated development efficiency and medium element level; L-L: Low coordinated development efficiency and low element level; a. Population density; b. Urbanization rate; c. GDP; d. Primary industry added value as a proportion of GDP; e. Percentage of forest cover; f. Ecological services value) |
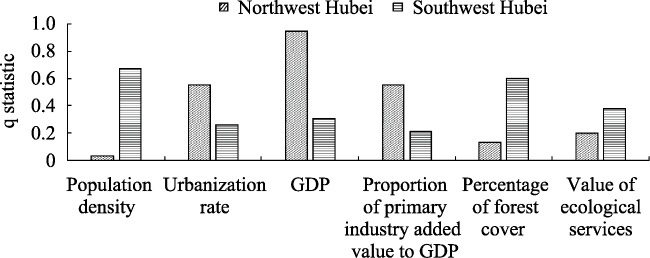
Figure 5 Detector results of influencing factors |
Table 4 Interaction detector results based on different combinations of influencing factors |
| Region | Factor | Population density | Urbanization rate | GDP | Proportion of primary industry added value to GDP | Percentage of forest cover | Value of ecological services |
|---|---|---|---|---|---|---|---|
| Northwest Hubei | Population density | 0.032 | |||||
| Urbanization rate | 0.927 | 0.551 | |||||
| GDP | 1.000 | 1.000 | 0.946 | ||||
| Proportion of primary industry added value to GDP | 0.927 | 0.626 | 1.000 | 0.551 | |||
| Percentage of forest cover | 0.451 | 1.000 | 1.000 | 1.000 | 0.130 | ||
| Value of ecological services | 0.378 | 0.927 | 1.000 | 0.927 | 0.451 | 0.196 | |
| Southwest Hubei | Population density | 0.668 | |||||
| Urbanization rate | 1.000 | 0.258 | |||||
| GDP | 0.967 | 0.945 | 0.300 | ||||
| Proportion of primary industry added value to GDP | 0.836 | 0.920 | 0.526 | 0.211 | |||
| Percentage of forest cover | 0.836 | 0.945 | 0.935 | 0.836 | 0.599 | ||
| Value of ecological services | 0.803 | 0.865 | 0.990 | 0.521 | 0.713 | 0.373 |
| [1] |
|
| [2] |
|
| [3] |
|
| [4] |
|
| [5] |
|
| [6] |
|
| [7] |
|
| [8] |
|
| [9] |
|
| [10] |
|
| [11] |
|
| [12] |
|
| [13] |
|
| [14] |
|
| [15] |
Hubei Municipal Bureau of Statistics, National Bureau of Statistics Survey Office in Hubei (HMBSNBS), 1995-2015. Hubei Statistical Yearbook. Beijing: China Statistics Press.
|
| [16] |
|
| [17] |
|
| [18] |
|
| [19] |
|
| [20] |
|
| [21] |
|
| [22] |
|
| [23] |
|
| [24] |
|
| [25] |
|
| [26] |
|
| [27] |
|
| [28] |
|
| [29] |
|
| [30] |
|
| [31] |
|
| [32] |
|
| [33] |
|
| [34] |
|
| [35] |
|
| [36] |
|
| [37] |
|
| [38] |
|
| [39] |
|
| [40] |
|
| [41] |
|
| [42] |
|
| [43] |
|
| [44] |
|
| [45] |
|
| [46] |
|
| [47] |
|
| [48] |
|
| [49] |
Rural Socioeconomic Investigation Department, National Bureau of Statistics of China (RSIDNBS), 1995- 2015. China County Statistical Yearbook. Beijing: China Statistics Press.
|
| [50] |
|
| [51] |
|
| [52] |
|
| [53] |
|
| [54] |
|
| [55] |
|
| [56] |
|
| [57] |
|
| [58] |
|
| [59] |
|
| [60] |
|
| [61] |
|
| [62] |
|
| [63] |
|
| [64] |
|
| [65] |
|
| [66] |
|
| [67] |
|
| [68] |
|
| [69] |
|
| [70] |
|
| [71] |
|
| [72] |
|
| [73] |
|
| [74] |
|
| [75] |
|
| [76] |
|
| [77] |
|
/
| 〈 |
|
〉 |