Research Articles

Quantitative identification and the evolution characteristics of production-living-ecological space in the mountainous area: From the perspective of multifunctional land

  • JI Zhengxin , 1, 2 ,
  • LIU Chao 3 ,
  • XU Yueqing , 1, 2, * ,
  • SUN Minxuan 1, 2 ,
  • WEI Hejie 4 ,
  • SUN Danfeng 1, 2 ,
  • LI Yaoyao 1, 2 ,
  • ZHANG Ping 1, 2 ,
  • SUN Qiangqiang 1, 2
Expand
  • 1. College of Land Science and Technology, China Agricultural University, Beijing 100193, China
  • 2. Key Laboratory of Agricultural Land Quality, Ministry of Natural Resources, Beijing 100193, China
  • 3. College of Public Administration, Central China Normal University, Wuhan 430079, China
  • 4. College of Resources and Environmental Sciences, Henan Agricultural University, Zhengzhou 450002, China
*Xu Yueqing (1972-), Associate Professor, specialized in multifunctional land use and spatial planning. E-mail:

Ji Zhengxin (1997-), PhD Candidate, specialized in land system and spatial planning. E-mail:

Received date: 2022-04-09

  Accepted date: 2022-09-08

  Online published: 2023-05-11

Supported by

National Natural Science Foundation of China(41971238)

National Natural Science Foundation of China(42101282)

National Natural Science Foundation of China(42001234)

Abstract

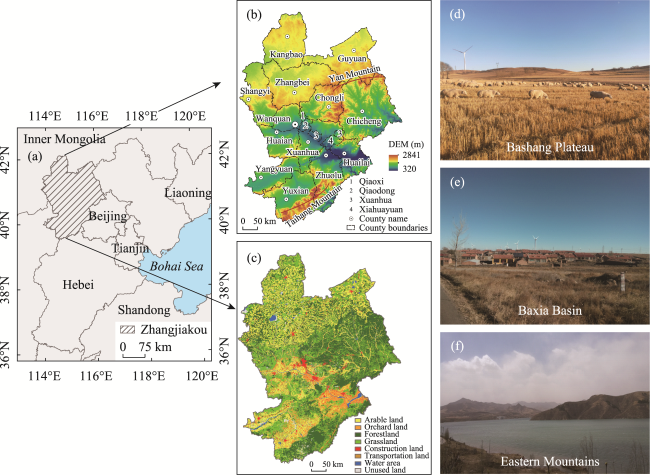
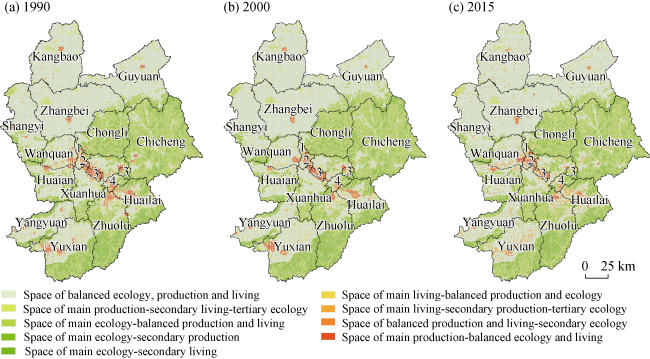
Developed here is an integrated framework for identifying production-living-ecological space (PLES) quantitatively at grid scale from the perspective of multifunction land use, and 25 compound space types are classified to highlight the multiple functions of PLES. As a typical mountainous city in northern Hebei province, Zhangjiakou is used as a case study, and the results show that more than 80% of the land space in Zhangjiakou has remarkable triple functionality. The living-dominated space and the production-dominated space are distributed mainly in the valleys of the Yanghe, Sanggan, and Huliu rivers and have obvious spatial consistency, while the ecological-dominated space is concentrated mostly at the eastern Yanshan Mountains and southern Taihang Mountains and complements the other two types of space. The former two are spatially fragmented, while the latter has been expanding to the periphery over time. From 1990 to 2015, the ecological-dominated space has increased the most by 1555.02 km2, while the living-dominated space has increased the least by 816.79 km2. The types of PLES are more diverse in the medium and low mountains and the areas with gentle slope, and the influencing factors include natural ecological environment, socioeconomic development, human consumption demand, and institutional policies. Therefore, these findings can mitigate conflicts among PLES in mountainous and similar areas, and promote the balanced development of land space.

Cite this article

JI Zhengxin , LIU Chao , XU Yueqing , SUN Minxuan , WEI Hejie , SUN Danfeng , LI Yaoyao , ZHANG Ping , SUN Qiangqiang . Quantitative identification and the evolution characteristics of production-living-ecological space in the mountainous area: From the perspective of multifunctional land[J]. Journal of Geographical Sciences, 2023 , 33(4) : 779 -800 . DOI: 10.1007/s11442-023-2106-x

1 Introduction

Land use change caused by human interaction with biophysical environment is a main driver of global change (MA, 2005; Verburg et al., 2009). The salient feature of this interaction is the multiple functions endowed with land use, such as nature reserve and wood production (Koomen et al., 2008; Tan et al., 2018). As these functions come together in the same land space, it can be mutually beneficial, but can also lead to conflict (Willem, 2019). Planners worldwide thus seek to reconcile spatial conflicts among different land uses through use zoning in spatial planning policies (Brown et al., 2018; Chaiyapon et al., 2018; Mustafa et al., 2018; Fu et al., 2019), similar to designated wildlife corridors and economic activity zones (Hersperger et al., 2018; Ghoddousi et al., 2021), as is exemplified in the National Spatial Planning Policies for Biodiversity in England and the Master Plan for the Greater Paris Region.
Other countries such as China embraced the zoning concept of international spatial planning and adopted a series of zoning work (Lin et al., 2022). The focus of regionalization has metamorphosed to serve economic construction from the earlier emphasis on agricultural production. However, with the acceleration of industrialization, urbanization and agricultural modernization in recent times, conflicts among human production, living, and ecosystems have become increasingly fierce, resulting in many problems including environmental damage, ecological degradation, and inefficient use of resources (Liu et al., 2014; Tang et al., 2015; Fang et al., 2018). This has posed great challenges for regional sustainable development, and in this context, the Chinese government has proposed building a livable national space comprising “intensive and efficient production space, moderate livable space, and unspoiled and beautiful ecological space” (Xinhuanet, 2015). This proposal points out the latest goal of spatial planning zoning and the Chinese vision for the future. Production space is the area dominated by specific production functions and provides people with mainly agricultural, industrial, and commercial products or services. Living space is the area dominated by living functions and that meets various needs and activities of people, such as living, consumption or entertainment. Ecological space is the area dominated by ecological functions and plays a crucial part in maintaining ecological security as well as providing ecosystem products or services (Huang et al., 2017; Li et al., 2021). Therefore, a core part of spatial planning is how best to resolve the contradiction among PLES types and realize their coordinated development.
Recently, numerous scholars have conducted in-depth and detailed research on PLES, including its concept and classification (Zhu et al., 2015; Zhang et al., 2017), its spatiotemporal evolution (Zhou et al., 2017; Lin et al., 2019; Dong et al., 2020; Tao, 2021; Wu et al., 2021), its reconstruction and optimization (Long, 2013; Tian et al., 2020; Chen et al., 2021), and its subspaces (Yu et al., 2020). However, the following deficiencies still exist. 1) Previous studies often used administrative units as the research scale and used regional average values for the conditions of entire region (Liao et al., 2020; Yu et al., 2020). However, administrative units can have large spatial heterogeneity, especially in mountainous areas with complex topography, thereby making it difficult to describe spatial information in detail. Fortunately, using a geographic grid is effective for compensating for this deficiency and realizing the quantification, localization, and accuracy of PLES. 2) PLES is identified and divided using two main methods. One is land-use-type merging, which establishes the connection with national land-classification standards by reclassifying and merging land-use types from the perspective of ecological, living, and production functions based on regional land-use data or remote sensing image data (Liu et al., 2017; Duan et al., 2021). However, not enough consideration is given to spatial composite functions (e.g., grassland is important land for agricultural production, providing forage and other biological products, but it also has ecosystem cycle functions including climate, soil and water regulation, or nutrient cycling). The other method is an indicator system, i.e., identifying PLES quantitatively by establishing a comprehensive evaluation index system (Yang et al., 2020; Yu et al., 2020). However, although this approach is pertinent and has comprehensive advantages, there are difficulties in multisubject integration and multiscale integrated expression (Huang et al., 2017). PLES is essentially a functional space divided according to the various types of products or services provided by land space (Huang et al., 2020; Ji et al., 2020). The level of LUFs reflects the capacity of land system to supply products or services (Liu et al., 2018) and is the basis and premise for identifying PLES. Thus, identifying PLES quantitatively from the perspective of LUFs is an effective way to clarify the relationship between PLES and human well-being. Meanwhile, the functional value of PLES is a good link between nature and social economy because it reflects intuitively the capacity of land space to provide various products or services.
As special areas with complex topography and fragile ecological environments, mountainous areas are more susceptible to anthropogenic activities (Yang et al., 2008; Shi et al., 2018). Against the background of new-type urbanization in China, the socioecological system in mountainous areas has undergone more-drastic changes than elsewhere, spawning a series of environmental effects that lead to PLES evolution. Hence, it is extremely important to take mountainous areas as separate research objects, which can also improve theoretical and empirical research on the optimization of territorial space.
Given the above, we took Zhangjiakou—a central city in the mountainous area of northern Hebei—as the study area. The objectives of this paper are to propose a theoretical framework for quantitative identification of PLES from the perspective of land use function value, by the fusion of multisource data and multidisciplinary model at grid cells, and reveal the spatiotemporal variations of PLES and explore its driving mechanisms. Specifically, this study aims to (i) develop an integrated method for identifying and evaluating PLES quantitatively at grid scale from an LUF perspective, (ii) reveal the spatiotemporal changes of PLES in Zhangjiakou during 1990-2015 and explore the driving factors, and (iii) propose policy implications for coordinating PLES.

2 Study area and methods

2.1 Study area

Zhangjiakou city is situated in the northwest of Hebei province and borders Beijing, Shanxi Province, and Inner Mongolia (Figure 1). Its geographical coordinates are 39°30′-42°10′N and 113°50′-116°30′E, and terrain is lower in the southeast while higher in the northwest, with elevations in a range of 320-2841 m. The study area can be divided roughly into the Bashang Plateau and the Baxia Basin according to the east part of the Yinshan Mountains. It is also considered as a typical mountainous area and an ecologically fragile area in China, with frequent natural disasters, sandy land, degraded pastures, and extensive land use (Sun et al., 2016).
Figure 1 Location of Zhangjiakou, Hebei province, North China
Zhangjiakou includes 4 districts and 13 counties, covering approximately the area of 3.68×10⁴ km2. This city is also known as a main component of the poverty belt around Beijing and Tianjin, which has a large poverty-stricken population but lacks infrastructure and development opportunities. In 2015, its GDP was 136.35 billion yuan, ranking eighth among eleven cities in Hebei province, and its urbanization level was 49.21% lower than the provincial level (51.33%). Since the implementation of BTH Coordinated Development Plan and Beijing and Zhangjiakou jointly organizing the 2022 Winter Olympics, this area has gradually become an important undertaking ground for the gradient transfer of industries and the decentralization of functions in Beijing and Tianjin. Consequently, competition for land use among various industries or departments has intensified, and contradiction among PLES has become more marked. Therefore, it is necessary to identify and evaluate PLES quantitatively, analyze its spatiotemporal characteristics and driving mechanisms, and achieve ordered development of PLES in this region.

2.2 Methods

2.2.1 Data sources and processing

In our study, multisource remote-sensing, meteorological, hydrological, terrain, soil, traffic, and statistical data were used for LUF evaluation (see Table 1 for specific data descriptions). The land-use data were obtained from Landsat-TM (1990 and 2000) and Landsat-OLI (2015) images (http://www.gscloud.cn/) whose preprocessing included atmospheric correction, geometric rectification, and supervised classification in ENVI 5.1. The interpretation accuracies were 86.82%, 88.92%, and 86.38%, respectively, meeting recommended values. The types of land use were divided into the eight categories of arable land, orchard land, forestland, grassland, construction land, transportation land, water area, and unused land. The normalized difference vegetation index (NDVI, https://lpdaac.usgs.gov/) was processed by using the linear method to obtain a standard vegetation index. Meteorological data (http://cdc.cma.gov.cn/) such as precipitation, temperature, and evaporation were obtained using the kriging interpolation method through the software ArcGIS 10.4. In addition, aforementioned data involving different formats and characteristics had to be unified in the same evaluation unit, so a 1 km × 1 km fishnet was produced to realize the spatial fusion of multisource data, model construction, and calculation.
Table 1 Categories, descriptions, and sources of data used in this study
Category Description Sources
Remote sensing data Landsat-TM (1990 and 2000) and Landsat-OLI (2015) images (30 m ×30 m raster); Geospatial Data Cloud Platform;
NDVI (250 m × 250 m raster); NASA;
Nighttime light data (500 m × 500 m raster). Earth Observation Group.
Meteorological data Total solar radiation, sunshine, duration, temperature, and precipitation. National Meteorological Information Center and Zhangjiakou Meteorological Administration
Hydrologic data Rivers, lakes, and reservoirs (vector). Zhangjiakou City Hydrometric Network Map
Terrain data Elevation (30 m × 30 m raster) Geospatial Data Cloud Platform
Soil data Nitrogen, phosphorus, potassium, and organic carbon content, etc. Hebei Soil Survey Database
Traffic data National highways, provincial highways, etc. (vector) Zhangjiakou City Transportation Bureau
Statistical data Population data, grain output, GDP, etc.; Individual output values of agriculture, animal husbandry, forestry, fishery, etc. Zhangjiakou Statistical Yearbook
(1990, 2001, and 2016); Zhangjiakou Economic Yearbook (1990, 2001, and 2016)

2.2.2 Functional classification system for PLES

The scientific classification of PLES functions was regarded as the first step in identifying and assessing PLES. Considering previous research related to LUF, ecosystem function, and landscape function (Wiggering et al., 2006; Barthelemy et al., 2007; Liu et al., 2016), combining the actual situation of Zhangjiakou and following the dominant PLES functions, a multilevel functional classification system for PLES was established. More specifically, the primary functional classification of PLES is divided into production, living, and ecological function according to the three dimensions of production-life-ecological in territorial spatial planning; we not only focus on the characteristics of land use process and the coupling of socio-economic elements, but also emphasize the particularity of the regional geographic environment. Thus, the secondary classification of production function includes agricultural production and non-agricultural production, the secondary classification of living function includes food supply and residence support, and the secondary classification of ecological function includes soil conservation and gas regulation.

2.2.3 Functional evaluation system for PLES

Land space is a self-organized system with multiple functions and structures formed by natural elements (ecology, resources, environment) and human elements (economy, society) (Lin et al., 2019). Correspondingly, from a perspective of coupled natural and socioeconomic elements, the biophysical calculation and standard monetization evaluation of LUFs are key for PLES identification. Essentially, the functional evaluation system of PLES is a process of converting products or services provided by the land-use system into specific monetary values, which comprises two steps: biophysical calculation and standard monetization evaluation. The methods and processes of land-use subfunction quantification are given in appendix A (Tables A1 and A2).
Biophysical calculation assesses the quality of each subfunction by adopting biophysical indicators. Notably, for agricultural production and non-agricultural production, their biophysical calculation and monetization evaluation are equivalent. Thus, in our study, the functional biophysical calculation was related to only food supply, residence support, soil conservation, as well as gas regulation. The food-supply function refers to the crucial service of fulfilling basic human needs, which can be characterized by grain yield (Taelman et al., 2016); its spatialization was a remote-sensing yield estimation model based on vegetation index. The residence-support function means providing a major residential carrier for human daily life, which is highly correlated with urban and rural construction land and nighttime light data, so the function was quantified using construction land and NPP/VIIRS nighttime light data (Tan et al., 2018). The gas-regulation function reflects the capacity of terrestrial vegetation to maintain the CO2 and O2 balance, regulate gas, and other aspects, which can be expressed specifically as the fixation of CO2 and the release of O2; the physical quantity of the gas regulation was estimated according to the revised CASA model (Peng et al., 2016). The soil-conservation function is the capacity of terrestrial vegetation to conserve soil and its fertility, and its physical quantity can be evaluated through the revised universal soil loss equation (RUSLE) (Xiao et al., 2015).
Standard monetization evaluation involves assessing the economic value of each subfunction using the methods of environmental economics and ecological economics according to the results of biophysical calculation (Liu et al., 2018). The value of the agricultural-production function reflects the economic value generated by agricultural production activities, and it is generally characterized by the total output of agriculture, forestry, animal husbandry, and fishery (Huang et al., 2009). The value of the non-agricultural-production function is a main driving force for the regional development, and it was calculated as the output of the secondary and tertiary industries, which was related to the urban and rural construction land, nighttime light area, and average light intensity (Dai et al., 2017). The value of the food-supply function refers to people’s willingness to pay for arable land to meet their food needs. In this study, because the outputs of wheat, corn, millet, naked oats, and potatoes had been converted into standard grain (winter wheat) yields, the value of this function could be estimated using the market price method based on the price of wheat. The value of the residence-support function reflects people’s willingness to pay for construction land to meet their housing needs, and it was measured by the market value method. Based on the results for the physical quantity of the gas-regulation function, the substitution cost was selected to characterize its monetary value. Based on the results for the physical quantity of the soil-conservation function, the shadow price method, market value method, and opportunity cost method were used to assess the values of protected soil fertility, reduced land abandonment, and mitigated sedimentation.

2.2.4 Functional combination modes of PLES

Land use is multifunctional, and different types of space formed by functional clustering have multiple functions; the relationship between space and function is either one-to-one or one-to-multiple (Huang et al., 2020). Therefore, the recognition of PLES includes the single-space mode and the compound-space mode. The single-space mode implies that land space is divided into production, living space, and space according to a single function (Li et al., 2018; Lin et al., 2021). Considering the different combinations of functions, the compound-space mode implies that land space is divided into compound space types, such as production-ecological space, living-production space, ecological-production space, and so on (Zhang et al., 2015; Xie et al., 2021). Under the demand of multifunctional space utilization, the compound-space model had been accepted by researchers (Xi et al., 2016; Yang et al., 2020; Wei et al., 2021).
Herein, the values of production, living, and ecological functions are divided into main, secondary, and tertiary using a natural break-point method. Based on the arrangement rule in combinatorics, 25 space types are obtained (Figure 2). Single function means that only one of production, living and ecological functions exists in the grid unit. Double function means that there are two functions of production, living and ecological functions in the grid unit. If the two functions are not at the same level, it is “main and secondary function” pattern, and if they belong to the same level, it is “balanced double function” pattern. Triple function refers to the simultaneous existence of production, living and ecological functions in the grid unit. If three functional value do not belong to the same level, it is “main, secondary and tertiary function” pattern, if all three functional values belong to the same level, it is “balanced triple function” pattern, and if two of the functional values belong to the same level, it is “main and balanced double function” or “balanced double and secondary function” pattern.
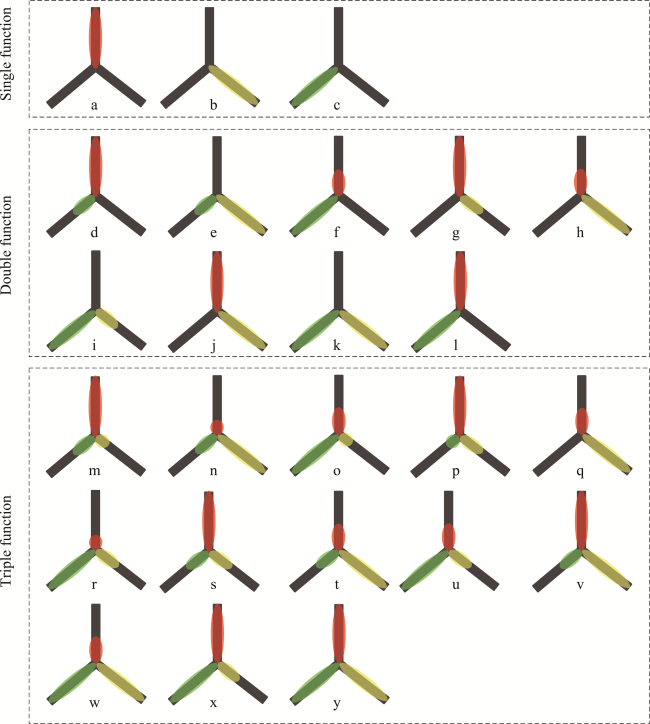
Figure 2 Composite function patterns of PLES: a—production; b—living; c—ecological; d—production (main), ecological (secondary); e—living (main), ecological (secondary); f—ecological (main), production (secondary); g—production (main), living (secondary); h—living (main), production (secondary); i—ecological (main), living (secondary); j—production and living (balanced); k—living and ecological (balanced); l—ecological and production (balanced); m—production (main), ecological (secondary), living (tertiary); n—living (main), ecological (secondary), production (tertiary); o—ecological (main), production (secondary), living (tertiary); p—production (main), living (secondary), ecological (tertiary); q—living (main), production (secondary), ecological (tertiary); r—ecological (main), living (secondary), production (tertiary); s—production (main), ecological and living (balanced); t—living (main), production and ecological (balanced); u—ecological (main), production and living (balanced); v—production and living (balanced), ecological (secondary); w—living and ecological (balanced), production (secondary); x—ecological and production (balanced), living (secondary); y—ecological, production, and living (balanced)

3 Results

3.1 Economic value of land use functions

The values of production, living, and ecological functions rose rapidly in Zhangjiakou during 1990-2015, as illustrated in Figure 3. The highest value of production-function unit in 1990, 2000, and 2015 was 785.27×10⁴ yuan, 2976.17×104 yuan, and 29 633.50×10⁴ yuan, respectively, with a total value increase of 462.27×10⁸ yuan. Its high-value areas exhibit an obvious distribution in the form of “one belt and multicore,” where the “one belt” is the concentrated development zone of the Yanghe River valley and the “multicore” is the central area of each county. The reason for this is that these areas are both economically developed and arable-land concentrated, and the output of agriculture, secondary and tertiary industries are far higher than elsewhere. The highest value of the living-function unit in 1990, 2000, and 2015 was 3210.10×104 yuan, 8108.76×104 yuan, and 48,387.86×104 yuan, respectively, with a total value increase of 3010.04×108 yuan. Its high-value areas are spatially fragmented, which is consistent with the distribution of arable land. Nevertheless, the low-value areas are concentrated at Zhuolu county, Chicheng county, Yuxian county, and Chongli county, where there are poorer living infrastructure and food supply, but more grasslands or forests. The highest value of ecological-function unit in 1990, 2000, and 2015 was 195.53×10⁴ yuan, 194.69×10⁴ yuan, and 237.76×10⁴ yuan, respectively, with a total value increase of 40.14×10⁸ yuan. Its high-value areas are centralized in the eastern and southeast mountainous areas, because there are more forests, grasslands, and water networks in these areas, which is conducive to gas regulation and soil conservation.
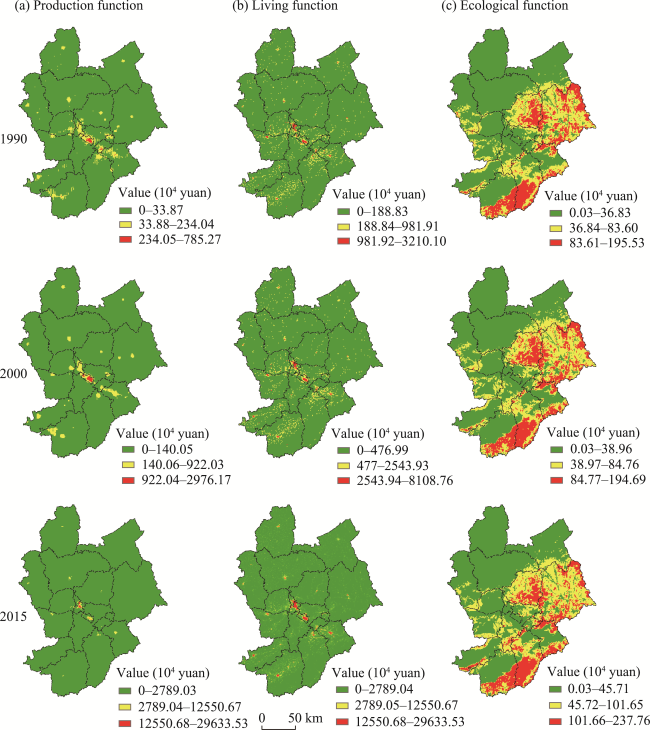
Figure 3 The classified value of production, living, and ecological functions in Zhangjiakou during 1990-2015

3.2 Recognition and mapping of PLES

As shown in Figure 4, the study area of Zhangjiakou has nine of the 25 space types: (i) balanced ecological, production, and living space (BEPL), (ii) main ecological and secondary living space (ME-SL), (iii) main ecological and secondary production space (ME-SP), (iv) main ecological and balanced production and living space (ME-BPL), (v) main living, secondary production, and tertiary ecology space (ML-SP-TE), (vi) main living and balanced production and ecological space (ML-BPE), (vii) balanced production and living and secondary ecological space (BPL-SE), (viii) main production and balanced ecological and living space (MP-BEL), and (ix) main production, secondary living, and tertiary ecological space (MP-SL-TE). More than 80% of the land space has the triple functions of ecological, living, and production. The spatial superposition and mixture of multiple functions can meet the various needs of people to a certain extent, but it is also accompanied by fierce competition and conflict among functions. Consequently, identifying the multiple functions of space quantitatively is an objective requirement for sustainable development and management of land space.
Figure 4 Spatial patterns of PLES in Zhangjiakou during 1990-2015
The distributions of production-dominated space (MP-BEL, MP-SL-TE) and living-dominated space (ML-SP-TE, ML-BPE) show obviously spatial consistency. These areas are scattered in the valleys of the Yanghe, Sanggan, and Huliu rivers and are fragmented, the specific reason being that a large amount of arable land has been converted to construction land in this area. However, the distributions of these two types of space are basically complementary to that of the ecological-dominated space (ME-SL, ME-SP, ME-BPL), which is distributed mainly in the eastern mountains (e.g., Yanshan Mountains) and southern mountains (e.g., Taihang Mountains) because of there being more forests and grasslands there, and it has expanded gradually to the periphery over time.

3.3 Quantity structure evolution of PLES

The quantity structure changes of PLES from 1990 to 2015 are shown in Figure 5. ME-SL, ML-BPE, and BPL-SE increased substantially, reaching 1166.52 km2, 560.61 km2, and 565.88 km2, respectively. ME-BPL increased from 1990 to 2000 (1.84%) and then decreased (−0.21%) from 2000 to 2015. The areas of BEPL, MP-SL-TE, and MP-BEL decreased con- tinuously in 1990-2015, and the rates changed from 51.24%, 4.20%, and 2.11% to 49.09%, 0.29%, and 0.19%, respectively. The rates of ME-SL and ML-SP-TE were relatively stable, with an increase or decrease of less than 1%. Overall, it is evident that over the study period, the space dominated by ecological function (ME-SL, ME-SP, ME-BPL) increased the most by 1555.02 km2 whereas that dominated by living function (ML-SP-TE, ML-BPE) increased the least by 816.79 km2, which indicates that the primary direction of land use is oriented toward pursuing ecological stability in the study area at the current stage of socioeconomic development.
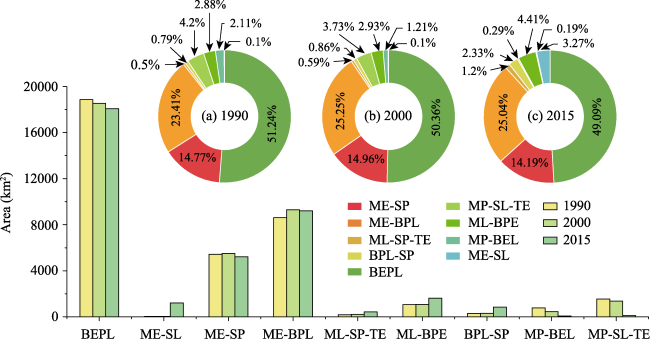
Figure 5 Areas and proportions of PLES in Zhangjiakou during 1990-2015
The transformation characteristics of PLES are expressed further in Figure 6 by using a Sankey diagram. The results show that the most remarkable change over the past 25 years was characterized by huge conversion from other space types to ecological-dominated space, with an amount of around 2822 km2. Moreover, compared with 1990-2000, since the rapid urbanization and industrialization of the region during 2000-2015, much of the BEPL space was converted to living-dominated space and production-dominated space, i.e., around 356 km2 and 141 km2 (35% and 13.86% of all transferred BEPL), respectively.
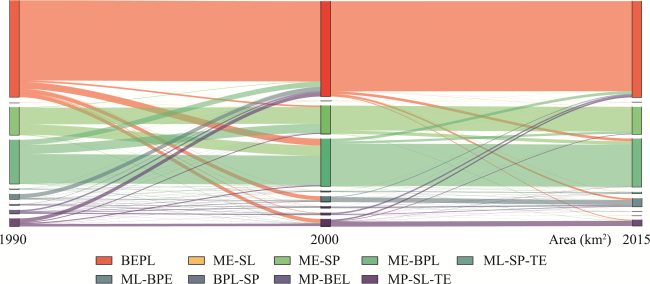
Figure 6 Transfer areas of PLES in Zhangjiakou during 1990-2015

3.4 Vertical gradient evolution of PLES

On the basis of previous studies and regional features, the study area was divided into five elevation zones: <500 m (plains), 500-1000 m (hills), 1000-1500 m (low mountains), 1500-2000 m (medium mountains), and ≥2000 m (high mountains). As shown in Figure 7, the PLES proportions were calculated separately in the different elevation zones from 1990 to 2015. The proportion of ME-SP increases continuously with elevation and is the largest space in the high mountains, with 78%, 73%, and 65% of PLES in 1990, 2000, and 2015, respectively. The proportions of BEPL, MP-SL-TE, MP-BEL, and BPL-SE exhibit obviously phased characteristics with increasing elevation, of which the proportion of BEPL is dominant in the plains, hills, and low mountains. The proportion of ME-BPL increases continuously for elevations below 2000 m and reaches its maximum in the medium mountains, with 33%, 41%, and 39% in 1990, 2000, and 2015, respectively. The proportions of ME-SL, ML-BPE, and ML-SP-TE decrease gradually with increasing elevation.
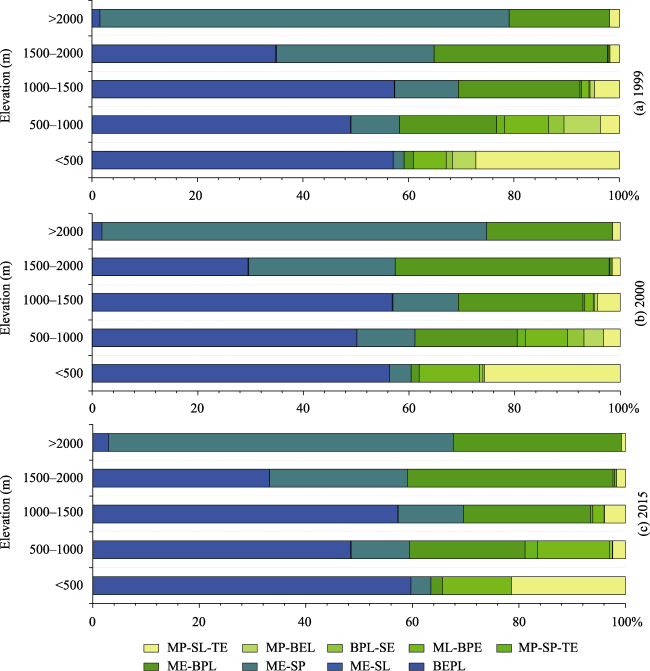
Figure 7 Proportions of PLES at different elevations in Zhangjiakou during 1990-2015
Generally, the types of PLES were more diverse at elevations below 2000 m during 1990-2015 and were mostly production-dominated and living-dominated spaces, showing that human activities (social, economic, cultural, etc.) in Zhangjiakou are generally more common in areas with lower elevation such as plains, hills, and low mountains. However, ecological-dominated space was scattered mainly in the higher-elevation zones. Furthermore, the evolution of PLES in the different elevation zones is manifested mainly by the competition between ME-BPL and ML-BPE. ME-BPL has expanded to higher-elevation zones, and its proportion has increased by 13% in the medium and high mountains over the past 25 years. This means that Zhangjiakou’s ecological engineering construction has been strengthened. ML-BPE has migrated to lower-elevation zones, and its proportion has increased by 15% in plains and hills over the past 25 years, which was caused by the process of urbanization and the construction of infrastructure.
According to the classification principles of “Technical Regulations for the Third National Land Survey (TD∕T1055-2019)” issued by the Ministry of Natural Resources in China, slope was binned into five classes, namely, flat, gentle slope, slope, steep slope, and dangerous slope, and the corresponding classes are, ≤2°, 2°-6°, 6°-15°, 15°-25° and >25°. As shown in Figure 8, the proportions of PLES were calculated separately in the different slope zones from 1990 to 2015. The proportions of ME-SP and ME-SL increase slightly with increasing slope, of which ME-SP had the largest proportion in dangerous slope (>25°) with 58%, 51%, and 48% in 1990, 2000, and 2015, respectively. The proportions of BEPL, ML-BPE, BPL-SE, MP-BEL, and MP-SL-TE decrease with increasing slope, being concentrated in flat and gentle slope. Taking steep slope as the segmentation point (50%, 51%, and 53% in the three periods), the proportion of ME-BPL increases and then decreases with increasing slope. The proportion of ML-SP-TE has differed less across the slopes in the past 25 years.
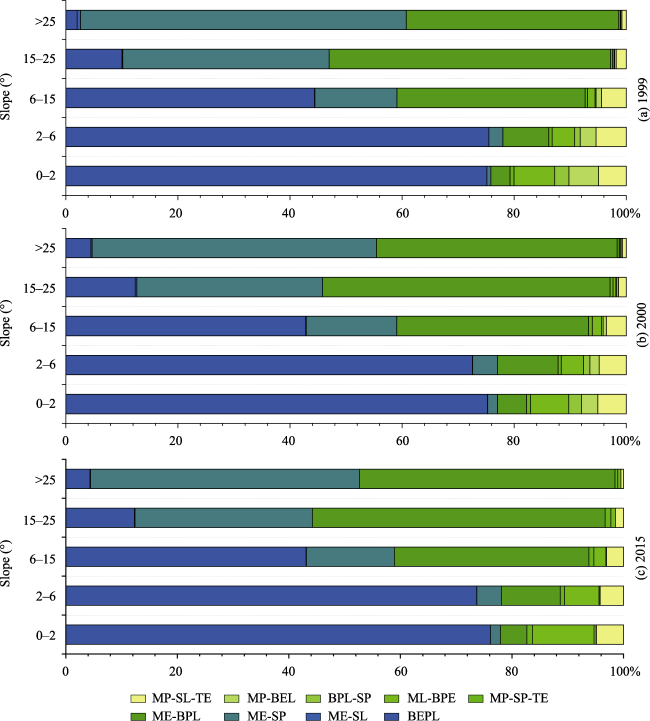
Figure 8 Proportions of PLES at different slopes in Zhangjiakou during 1990-2015
Overall, the types of PLES were more diverse in areas with slopes below 25° during 1990-2015, and were mainly production-dominated and living-dominated spaces, indicating that human activities are more likely to happen in lower-slope areas including flat, gentle slope, slope, and steep slope. Nevertheless, ecological-dominated space is distributed mainly in the higher-slope areas. Moreover, the limitation of slope is more prominent for production-dominated and living-dominated spaces because these have greater human-activity intensity. Thus, these spaces spread gradually to lower-slope areas including flat and gentle slope.

3.5 Driving mechanism of PLES evolution

The changes to regional PLES resulted from internal factors interacting with external ones (Liu et al., 2021). The internal factors (natural environment) determined the basic layout of PLES (Jin et al., 2021), while the external ones (economic society, human consumption needs, and policies) influenced the quantity structure and spatial evolution of PLES (Zhang et al., 2019) (Figure 9).
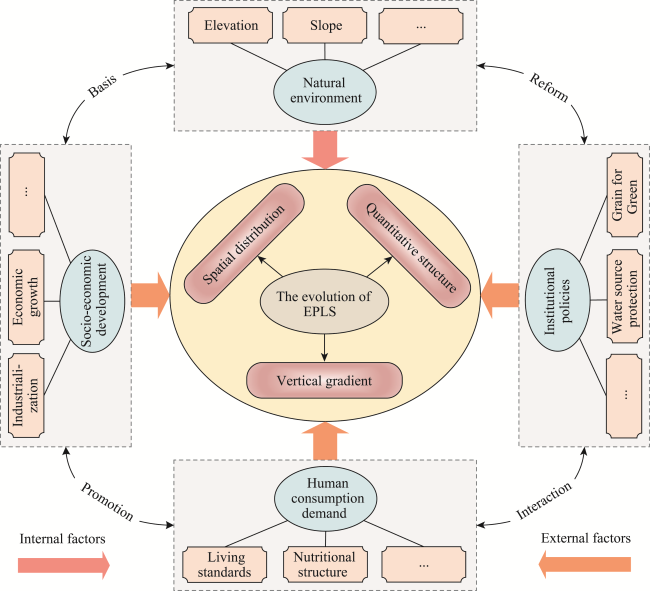
Figure 9 Influence mechanism of evolution of PLES in Zhangjiakou
The natural ecological environment restricted the spatial distribution of PLES. The Bashang Plateau, river valley, hills, and mountainous areas of Zhangjiakou contribute 35%, 16.6%, 11.9%, and 36.5% of total area, respectively, which determined that the main types of land use in this area were forestland, grassland, and farmland at 12,299.98 km2, 10,471.46 km2, and 9251.80 km2, respectively. Correspondingly, ecological-dominated space (ME-SL, ME-SP, ME-BPL) had the largest proportion, being located mostly in the southern Taihang Mountains and the eastern Yanshan Mountains because of the abundant forestland there. Production-dominated and living-dominated spaces occurred mainly in Yanghe River valley, which is also a core area for local agricultural and industrial production with its abundant resources of soil and water. BEPL was centralized in the northwestern Bashang Plateau, whose climatic conditions are cold and dry, and the agricultural production structure is semi-agricultural and semi-pastoral. Beyond that, the terrain also played a critical role in the distribution of PLES. Production-dominated and living-dominated spaces are concentrated mainly in areas with lower slope and altitude (below 25° and 2000 m), while ecological- dominated space is distributed widely in areas with higher slope and elevation (above 25° and 2000 m).
Socioeconomic development was the main factor in the regional PLES change. During 1990-2015, the GDP of Zhangjiakou increased from 28.01×10⁸ yuan to 1363.54×108 yuan, and the urbanization rate increased from 19.50% to 49.21%. Against this background of rapid economic development and industrialization, a large amount of lower-benefit agricultural land was occupied by higher-benefit industrial, mining land and residential land, resulting in around 4239 km2 of production-dominated and living-dominated spaces being were derived from the conversion of BEPL. Simultaneously, the total population in Zhangjiakou increased by 36.94×10⁴ during the same period, which inevitably led to increasing demand of production and living spaces, and so the occupation for ecological space became increasingly serious. Statistics showed that around 2102 km2 of ecological-dominated space was converted to production-dominated and living-dominated spaces in 1990-2015. Moreover, since the accelerated flow of urban and rural populations, mass rural inhabitants migrated to urban areas and non-agricultural industries, triggering changes in the vertical gradient of PLES. For example, with the increased off-farm income in cities, farmers no longer made a living by opening up wasteland on steep slopes, which led to less pressure on the arable land and the phenomenon of “forestland up, arable land down.” Correspondingly, the transformation of the human-land relationship promoted the expansion of ecological space (ME-BEL) to high-elevation and high-slope areas, while the expansion of BEPL to low-elevation and low-slope areas.
Human consumption demand was the key driving force for the PLES evolution. In the context of regional economic development and residents’ higher living standards, the Engel coefficient in Zhangjiakou decreased from 51.50% in 1990 to 32.60% in 2015, and people paid more attention to the nutritional structure of their daily diet, thus leading to increased intake of meat, eggs, milk, fruits, and vegetables. Furthermore, as a critical agricultural-product supply area for Beijing-Tianjin-Hebei region, to meet the demand on residents’ consumption upgrade in these areas, Zhangjiakou made full use of its climatic advantages and vigorously developed special agriculture and animal husbandry. According to statistics in 2019, the total output of fruits, vegetables, and milk in Zhangjiakou separately reached 211,000 tons (up 8.7% from the previous year), 5,338,000 tons (down 1.1% from the previous year), and 875, 000 tons (up 6.9% from the previous year), 85% of which were exported to metropolises such as Beijing and Tianjin, which stimulated the expansion of agricultural-production space such as orchard land, arable land, and grassland.
Institutional policies played a guiding or controlling role in the PLES evolution. Zhangjiakou is a crucial ecological green-shelter of the Beijing-Tianjin-Hebei eco-sphere and water supply resource of the economic circle around capital in China. A series of policies related to ecological restoration have been issued in Zhangjiakou since 1980, such as the Grain for Green Project, Beijing-Tianjin Sandstorm Control Program, the Grazing Restriction Program, the Key Shelterbelt Construction Program, and Water Source Protection. Under the control of these policies, by 2019 Zhangjiakou had completed afforestation of 8.79×10⁴ ha, controlled soil erosion of 241.5 km2, and forest coverage of 50%. Consequently, the expansion of ecological-dominated space (ME-SL and ME-BPL) was particularly significant at around 1555.02 km2. At the same time, to alleviate poverty as soon as possible, the local government implemented the Relocating the Poor project and the Moving Away from Hazards project, which had profound impacts on the human and land relationship, the urban and rural relationship, and the land use patterns in Zhangjiakou. As of 2019, this city had completed the demolition and reclamation of 137.73 ha of land (63% of Hebei province), thereby contributing to the transfer of production-dominated space (ML-BPE) to lower-elevation zones. In addition, as a result of the Beijing-Tianjin-Hebei Coordinated Development Plan and Beijing and Zhangjiakou jointly organizing the 2022 Winter Olympics, the leisure industries (e.g., tourism, elderly care, and health) and the infrastructure and supporting facilities (e.g., highways and high-speed railways) in Zhangjiakou were further improved. Subsequently, around 2137 km2 of BEPL was occupied by production-dominated and living-dominated spaces.

4 Discussion

4.1 Problem analysis and implications of PLES

The structural imbalances and spatial mismatch of PLES in Zhangjiakou are obvious. From 1990 to 2015, the ecological-dominated space accounted for a large proportion, with 38.28%, 40.32%, and 42.50% in the three periods, respectively, and was concentrated mostly in the eastern and southern mountains of Zhangjiakou. Meanwhile, the living-dominated and production-dominated spaces had relatively low proportions, with only 3.38%, 3.52%, and 5.61% (living-dominated space) and 7.10%, 5.80%, and 2.81% (production-dominated space) in the three periods, respectively, and were distributed mainly in the intermountain basin along the banks of the Yanghe, Shanggan, and Huliu rivers. This could be attributed to the topography and history of Zhangjiakou. The study area comprises mainly mountains, a plateau, and an intermountain basin, occupying around 48.4%, 35%, and 16.6% the total area, respectively, and has strong ecological conservation capacity. Throughout history, Zhangjiakou has been a stronghold of military significance for the capital Beijing, so the reform and open door policy was not implemented there until 1995. The economic development level of Zhangjiakou lags behind that of Hebei province, with 12 poverty-stricken counties at national and provincial levels. Because of Zhangjiakou’s backward economic level, inconvenient transportation, and small proportions of production and living spaces in its eastern mountainous areas, leisure tourism, forestry, and the fruit industry should be developed in the future. More significantly, it is also necessary to improve the coverage and share rate of infrastructure and public service facilities and maintain high-quality social and economic development. As for the intermountain basin, especially the central urban area, where urbanization and industrialization have developed rapidly but with a small proportion of ecological space and serious environmental pollution, it should take advantage of its location, transportation advantages, and technological support and industrial characteristics from the surrounding regions in the foreseeable future. Under the target of industry agglomeration and upgrading, green industries such as biomedicine and new materials could be further promoted, resulting in less pollution. Furthermore, more attention should be given to increasing urban green-coverage area.
The study area has experienced intense conflicts among PLES. During 1990-2015, around 2102 km2 of ecological-dominated space was squeezed by living-dominated and production-dominated spaces, whereas only 687 km2 of ecological-dominated space squeezed living-dominated and production-dominated spaces; the former was mostly found in the eastern and southern mountainous areas, while the latter was distributed mainly in the valleys of the Yanghe, Sanggan, and Huliu rivers. In the process of Beijing-Tianjin-Hebei regional integration, Zhangjiakou has undertaken many secondary or tertiary industries from Beijing and Tianjin that require more production and living space. Simultaneously, Zhangjiakou was designated as Beijing’s water conservation area and ecological reserve in “Implementation Opinions on the Construction Planning of Zhangjiakou Capital Water Conservation Functional Area and Ecological Environment Support Area (2019-2035),” so it plays an irreplaceable role in water conservation and ecological security. Consequently, this city is facing the dual pressures of ecological protection and economic development, and the contradiction between regional resource endowment and socioeconomic development is increasingly prominent, which severely restricts the coordinated and sustainable development of PLES. In the future, ecological protection lines, prime-farmland protection lines, and the spatial growth boundary of construction land should be strictly controlled to reduce the occupation of ecological space, especially in central urban area. Of course, ecological industries and ecological tourism should be developed reasonably on the basis of maintaining ecological stability. For instance, to ensure the sustainable supply of ecological functions and rapid economic development and alleviate the contradiction among different spaces, walnuts, pears, apricots, and other forest by-products should be cultivated in the counties of Huailai, Zhuolu, and Yu, while hot springs, ice and snow sports, and other ecological tourism should be promoted comprehensively in the county of Chongli.
In terms of vertical gradient zones, there is still much production-dominated and living-dominated space in high-slope and high-altitude areas in the study area, which presents a high risk of geological disasters. More specifically, in 2015, there were 9231 ha of production-dominated space in areas with slopes above 15° and 10,304 ha of such space in areas with altitudes above 1500 m. This can be ascribed to the existence of much sloping arable land and industrial and mining production land. Of these land types, sloping arable land is the key source of soil erosion, while industrial and mining production land causes serious disturbance or even damage to the ecological environment. Therefore, on one hand, priority should be given to (i) reforming sloping fields into terraced ones, (ii) gully control engineering works, and (iii) the Grain for Green Project; in particular, it is important to plant drought-tolerant and cold-resistant grass, shrub crops, or trees (e.g., caragana, sea-buckthorn, alfalfa, elm, poplar). On the other hand, the industrial and mining production land could be strictly controlled to limit the intensity and scale of utilization, and the restoration of natural ecological space should be further strengthened. Additionally, in 2015, there were 12,542 ha of living-dominated space in areas with slopes above 15° and 4302 ha of such space in areas with altitudes above 1500 m, where the topography is undulating and geological disasters occur frequently. Thus, the classification and management of geological disasters should be implemented on the basis of establishing a geological-disaster survey information system and a monitoring and early-warning system. If necessary, local planning and construction or relocation policies could be implemented for key villages regarding geological disasters.

4.2 Contributions and limitations of this study

PLES identification is the foundation of any land space planning system. Focusing on the logical relationship between land use multifunctionality and PLES, we constructed a framework for PLES research according to the core line “functional classification and evaluation of PLES → recognition and mapping of PLES → evolution and mechanism of PLES → optimization and countermeasures of PLES.” The proposed framework demonstrated great improvements over those developed in previous studies. Theoretically, we established a technical system for evaluating the functional values of PLES based on a fusion of multi-source data at grid scale, and we explored the functional combination patterns and types of PLES. This view is more practical and operational than that in previous studies because it considers multiple functions of space and offers a bridge between PLES and human well-being. Moreover, this has realized the quantification, localization, and precision of PLES research and enriched the content of multifunctional land use research. Empirically, with the case study of Zhangjiakou, we identified PLES by using the above framework, and we revealed its evolution characteristics and driving mechanism in spatial pattern, quantitative structure, and vertical gradient. The findings could also provide valuable guidance for coordinating PLES in Zhangjiakou and achieving regional synergies.
Although the established theoretical framework and empirical study have good applicability and scientific basis, this study still had certain limitations. Considering the quantifiability of functions and the accessibility of data, only six representative subfunctions were selected in the process of constructing a functional value evaluation system for PLES, while other functions (e.g., travel guarantee function, basic life guarantee function, water conservation function, etc.) are not yet considered. Therefore, a more comprehensive evaluation system is a problem that requires further discussion. Also, although we analyzed the driving mechanism of the PLES evolution in Zhangjiakou, the extent, direction, and effect of each factor differed, so it is necessary to quantify its factors further by using a geographical detector or geographical weighed regression.

5 Conclusions

The functional combination modes of PLES in Zhangjiakou are diverse, covering a total of nine types. More than 80% of the land space has triple functions, indicating that the multifunctional characteristics on land use are remarkable. Spatially, the PLES evolution presents obvious regional differences. Ecological-dominated space is centralized in the eastern Yanshan Mountains and southern Taihang Mountains and has been expanding to the periphery over time. However, the spatial distributions of the living-dominated and production-dominated spaces are opposite to that of the ecological-dominated space, which is concentrated in the valleys of the Yanghe, Sanggan, and Huliu rivers and is spatially fragmented. Structurally, the ecological-dominated space increased the most by 1555.02 km2 during the study period, while the living-dominated space increased the least by 816.79 km2. Vertically, the types of PLES are more diverse in the medium and low mountains and the areas with gentle slope. ME-BPL has expanded to high-altitude areas, while ML-BPE has shifted to lower-elevation zones. The slope was more conspicuous in limiting production-dominated and living-dominated spaces with greater intensity of human activities. The aforementioned evolution of PLES was the combined effect of multiple factors, including natural ecological environment, socioeconomic development, human consumption demand, and institutional policies.
The present study provides a systematic framework for theoretical and empirical research on regional PLES with integrated elements, as well as a valuable basis for decision-makers to formulate targeted and multiscale regulation policies of PLES in mountainous areas.

Appendix A:

Table A1 Physical-quantity models of multiple land use functions (LUFs)
Subfunctions Calculation formula Formula description
Living function Food supply $\begin{align} & GY\text{=}\sum\limits_{\text{i}}^{4}{{{Y}_{i}}\times {{\beta }_{i}}} \\ & G{{Y}_{j}}=aND{{V}_{j}}+bAR{{A}_{j}} \\
& GY_{i}^{'}=G{{Y}_{i}}\times (G{{Y}_{j}}\times G{{Y}_{jall}}) \\ \end{align}$
GY: total output of standard grains (t); Yi: actual output of crop i; βi: coefficient of yield ratio; GYj: standard grain output of town j; NDVj, ARAj: sums of NDVI and arable land area of town j; GY'i, GYi: standard grain yields of grid i after correction and prediction using statistical data; GYj, GYjall: statistical and predicted standard grain output of town j.
Residence support $POP{{D}_{\text{i}}}=\frac{PO{{P}_{\text{j}}}}{UR{{L}_{j}}}\times UR{{L}_{i}}\times \left( 1+\frac{URN{{L}_{i}}}{N{{L}_{j}}} \right)$ POPDi: population density of grid i; POPj: total population of town j; URLj, URLi: area of town j and grid i on urban and rural construction land; NLj, URNLi: nighttime light intensity of town j and grid i on urban and rural construction land.
Ecological function Gas regulation $\begin{align} & NPP(x,t)=APAR(x,t)\times \varepsilon (x,t) \\ & APAR(x,t)=SOL(x,t)\times FPAR(x,t)\times 0.5 \\ & FPAR(x,t)=\left( FPAR{{(x,t)}_{NDVI}}+FPAR{{(x,t)}_{SR}} \right)/2 \\ & FPAR{{(x,t)}_{NDVI}}=\left( FPAR(x,t)-NDV{{I}_{i,\min }} \right) \\ & \times \left( FPA{{R}_{\max }}-FPA{{R}_{\min }} \right) \\ & /\left( NDV{{I}_{i,\max }}-NDV{{I}_{i,\min }} \right)+FPA{{R}_{\min }} \\ & FPAR{{(x,t)}_{SR}}=\left( SR(x,t)-S{{R}_{i,\min }} \right) \\ & \times \left( FPA{{R}_{\max }}-FPA{{R}_{\min }} \right) \\ & /\left( S{{R}_{i,\max }}-S{{R}_{i,\min }} \right)+FPA{{R}_{\min }} \\ & SR(x,t)=\left( 1+NDVI(x,t) \right)/\left( 1-NDVI(x,t) \right) \\ & \\ \end{align}$
APAR(x,t), ε(x,t): photosynthetically active radiation and actual efficiency absorbed by pixel x in month t; SOL(x,t), SOL(x,t), FPAR(x,t): total solar radiation and absorption ratio of incident photosynthetically active radiation of pixel x in month t; FPAR(x,t)NDVI, FPAR(x,t)SR: photosynthetically active radiation absorption ratio calculated from normalized difference vegetation index and ratio vegetation index; SRi,max, SRi,min: 95% and 5% inferior percentiles of NDVI of planting cover i; NDVI(x,t), SR(x,t): normalized vegetation index and ratio vegetation index of pixel x in month t.
Soil conservation $\begin{align} & {{A}_{c}}={{A}_{p}}-{{A}_{r}}=R\times K\times LS-R\times K\times LS\times C\times P \\ & R=1.735\times \sum\limits_{i}^{12}{{{10}^{\left( 1.51g\frac{p_{i}^{2}}{p}-0.8188 \right)}}} \\ & K=\left\{ 0.2+0.3\exp \left[ -0.0256Sa(1-Si/100) \right] \right\} \\ & \times {{\left( \frac{Si}{Cl+Si} \right)}^{0.3}}\times \left[ 1-\frac{0.25Co}{Co+\exp (3.72-2.95Co)} \right] \\ & \times \left[ 1-\frac{0.7Sn}{Sn+\exp (-5.51+22.9Sn)} \right] \\ & LS={{(FlowAccum\times Cellsize/22.13)}^{0.4}} \\ & {{(\sin slope/0.0896)}^{1.3}} \\ \end{align}$
Ac, Ap, Ar: average annual soil conservation amount, potential soil erosion amount, and actual soil erosion amount; R: rainfall erosivity factor; K: soil erodibility factor; LS: slope length and steepness factor; C: cover and management factor; P: conservation practice factor; Sn=1−Sa/100; Sa, Si, Cl, Co: pure content of sand, powder, clay, and organic carbon; FlowAccum: accumulation of catchment water; Cell id size; slope: slope.size: gr
Table A2 Monetary-value model of multiple LUFs
Subfunctions Calculation formula Formula description
Production
function
Agricultural production $\begin{align} & GAO{{V}_{i}}=GA{{1}_{i}}+GA{{2}_{i}}+GA{{3}_{i}}+GA{{4}_{i}} \\ & GA{{k}_{i}}=\sum{\frac{AV{{O}_{jk}}}{ARG{{L}_{JP}}}}\times ARG{{L}_{ip}} \\ \end{align}$
GAOVi: agriculture output of grid i; GAki, AVOjk: output of agriculture, forestry, animal husbandry, and fishery at grid i and town j; ARGLip, ARGLjp: areas of arable land, forestland, grassland, and water at grid i and town j.
Non-agricultural production $\begin{align} & G{{23}_{j}}={{b}_{1}}{{S}_{j}}+{{b}_{2}}{{S}_{j}}^{2} \\ & {{S}_{j}}={{A}_{jN}}/{{A}_{j}} \\ & GDI{{23}_{i}}=G{{23}_{i}}\times (1+{{I}_{i}}) \\ & {{I}_{i}}=\sum{(D{{N}_{im}}}\times {{N}_{im}})/(D{{N}_{\text{i}\max }}\times {{N}_{il}}) \\ & GDI{{23}_{i}}^{'}=GDI{{23}_{i}}\times (G{{23}_{j}}/GDI{{23}_{jall}}) \\ \end{align}$
G23j: output of secondary and tertiary industries of county j; Sj: light area ratio of county j; AjN, Aj: total light area and total area of county j; GDI23i, G23i: output of secondary and tertiary industries of grid i after differentiation and statistical data simulation; Ii: average light intensity of grid i; DNimax, Nil: maximum light gray scale value and total number of pixels in grid i; GDI23i, GDI23jall: output of secondary and tertiary industries of grid i after correction and differentiation.
Living function Food supply $V{{G}_{\text{i}}}=G{{Y}_{i}}^{'}\times PG$ VGi: value of food supply of grid i; GYi: standard grain yield of grid i; PG: market price of wheat.
Residence support $V{{P}_{i}}=POP{{D}_{i}}\times RARE\times CHS$ VPi: value of residence support of grid i; POPDi: population density of grid i; RARE: per-capita living space; CHS: per-area commercial housing price.
Ecological function Gas regulation $VG{{R}_{i}}=VC{{O}_{i}}+V{{O}_{i}}$ VGRi: value of gas regulation of grid i; VCOi: CO2 afforestation cost of grid i; VOi:
average costs for plantation and industrial oxygen production of grid i.
Soil conservation $\begin{array}{l}
V S R_{i}=V a_{i}+V b_{i}+V c_{i} \\
V a_{i}=A c_{i} \times \sum_{j} C_{j} \times T_{j} \times P_{j} \\
V b_{i}=A c_{i} \times B /(p \times h \times 10000) \\
V c_{i}=\left(A c_{i} / p\right) \times 24 \% \times C_{c}
\end{array}$
VSRi: value of soil conservation function of grid i; Vai: value of soil fertility maintenance of grid i; Vbi: value of land abandonment reduction of grid i; Vci: value of sediment deposition alleviation of grid i; Cj: pure content of nitrogen, phosphorus, and potassium in soil; Tj: conversion coefficient; B: average income; p: soil bulk density; h: soil thickness; Cc: reservoir capacity cost.
[1]
Barthelemy D, Nieddu M, 2007. Non-trade concerns in agricultural and environmental economics: How J.R. Commons and Karl Polanyi can help us. Journal of Economic Issues, 2: 519-527.

[2]
Brown G, Sanders S, Reed P, 2018. Using public participatory mapping to inform general land use planning and zoning. Landscape & Urban Planning, 177: 64-74.

[3]
Chaiyapon K, Stefania B, 2018. Urban heat island analysis over the land use zoning plan of Bangkok by means of Landsat 8 imagery. Remote Sensing, 10(3): 440.

DOI

[4]
Chen H, Yang Q, Su K et al., 2021. Identification and optimization of production-living-ecological space in an ecological foundation area in the upper reaches of the Yangtze River: A case study of Jiangjin District of Chongqing, China. Land, 10(8): 863.

DOI

[5]
Dai Z, Hu Y, Zhao G, 2017. The suitability of different nighttime light data for GDP estimation at different spatial scales and regional levels. Sustainability, 9(2): 305.

DOI

[6]
Dong Z, Zhang J, Si A et al., 2020. Multidimensional analysis of the spatiotemporal variations in ecological, production and living spaces of Inner Mongolia and an identification of driving forces. Sustainability, 12(19): 7964.

DOI

[7]
Duan Y, Wang H, Huang A et al., 2021. Identification and spatial-temporal evolution of rural “production-living-ecological” space from the perspective of villagers’ behavior: A case study of Ertai Town, Zhangjiakou city. Land Use Policy, 106: 105457.

DOI

[8]
Fang C, Yang J, Fang J et al., 2018. Optimization transmission theory and technical pathways that describe multiscale urban agglomeration spaces. Chinese Geographical Science, 28(4): 543-554.

DOI

[9]
Fu M, Tian J, Ren Y et al., 2019. Functional zoning and space management of Three-River-Source National Park. Journal of Geographical Sciences, 29(12): 2069-2084.

DOI

[10]
Ghoddousi A, Buchholtz E K, Dietsch A M et al., 2021. Anthropogenic resistance: Accounting for human behavior in wildlife connectivity planning. One Earth, 4(1): 39-48.

DOI

[11]
Hersperger A M, Oliveira E, Pagliarin S et al., 2018. Urban land-use change: The role of strategic spatial planning. Global Environmental Change, 51: 32-42.

DOI

[12]
Huang A, Xu Y, Lu L et al., 2020. Research progress of the identification and optimization of production-living-ecological spaces. Progress in Geography, 39(3): 503-518. (in Chinese)

DOI

[13]
Huang J, Lin H, Qi X, 2017. A literature review on optimization of spatial development pattern based on ecological-production-living space. Progress in Geography, 36(3): 378-391. (in Chinese)

DOI

[14]
Huang Y, Bao A, Chen X et al., 2009. GIS based space-time simulation of GDP in arid regions: Taking the northern slope of Tianshan Mountains as an example. Progress in Geography, 28(4): 494-502. (in Chinese)

DOI

[15]
Ji Z, Liu C, Xu Y et al., 2020. Identification and optimal regulation of the production-living-ecological space based on quantitative land use functions. Transactions of the Chinese Society of Agricultural Engineering, 36(18): 222-231. (in Chinese)

[16]
Jin G, Chen K, Liao T et al., 2021. Measuring ecosystem services based on government intentions for future land use in Hubei province: Implications for sustainable landscape management. Landscape Ecology, 36(7): 2025-2042.

DOI

[17]
Koomen E, Rietveld P, de Nijs T, 2008. Modelling land-use change for spatial planning support. The Annals of Regional Science, 42(1): 1-10.

DOI

[18]
Li B, Zeng C, Dou Y et al., 2018. Change of human settlement environment and driving mechanism in traditional villages based on living-production-ecological change of human settlement environment and driving mechanism in traditional villages based on living-production-ecological space: A case study of Lanxi Village, Jiangyong County, Hunan Province. Progress in Geography, 37(5): 677-687. (in Chinese)

[19]
Li J, Sun W, Li M et al., 2021. Coupling coordination degree of production, living and ecological spaces and its influencing factors in the Yellow River Basin. Journal of Cleaner Production, 298: 126803.

DOI

[20]
Liao T, Li D, Wan Q, 2020. Tradeoff of exploitation-protection and suitability evaluation of low-slope hilly from the perspective of “production-living-ecological” optimization. Physics and Chemistry of the Earth, Parts A/B/C, 120: 102943.

[21]
Lin G, Fu J, Jiang D, 2021. Production-living-ecological conflict identification using a multiscale integration model based on spatial suitability analysis and sustainable development evaluation: A case study of Ningbo, China. Land, 10(4): 383.

DOI

[22]
Lin G, Jiang D, Fu J et al., 2022. A review on the overall optimization of production-living-ecological space: Theoretical basis and conceptual framework. Land, 11(3): 345.

DOI

[23]
Lin J, Song G, Zhang Y, 2019. Synergistic evolution mechanism of “production-living-ecology” functions in spatial planning system: A case study of Fuxin City. China Land Science, 33(4): 9-17. (in Chinese)

[24]
Lin Y, Zhao J, Zhang M et al., 2019. Identification of territory space pattern and spatio-temporal evolution analysis of urban agglomeration in central Yunnan. Transactions of the Chinese Society for Agricultural Machinery, 50(8): 176-191.

[25]
Liu C, Xu Y, Huang A et al., 2018. Spatial identification of land use multifunctionality at grid scale in farming-pastoral area: A case study of Zhangjiakou city, China. Habitat International, 76: 48-61.

DOI

[26]
Liu C, Xu Y, Lu X et al., 2021. Trade-offs and driving forces of land use functions in ecologically fragile areas of northern Hebei province: Spatiotemporal analysis. Land Use Policy, 104: 105387.

DOI

[27]
Liu C, Xu Y, Sun P et al., 2016. Progress and prospects of multi-functionality of land use research. Progress in Geography, 35(9): 1087-1099. (in Chinese)

DOI

[28]
Liu J, Liu Y, Li Y, 2017. Classification evaluation and spatial-temporal analysis of “production-living-ecological” spaces in China. Acta Geographica Sinica, 72(7): 1290-1304. (in Chinese)

[29]
Liu Y, Fang F, Li Y, 2014. Key issues of land use in China and implications for policy making. Land Use Policy, 40: 6-12.

DOI

[30]
Liu Y, Li J, Yang Y, 2018. Strategic adjustment of land use policy under the economic transformation. Land Use Policy, 74: 5-14.

DOI

[31]
Long H, 2013. Land consolidation and rural spatial restructuring. Acta Geographica Sinica, 68(8): 1019-1028. (in Chinese)

[32]
Millennium Ecosystem Assessment, 2005. http://www.millenniumassessment.org/en/index.aspx.

[33]
Mustafa A, Bruwier M, Archambeau P et al., 2018. Effects of spatial planning on future flood risks in urban environments. Journal of Environmental Management, 225: 193-204.

DOI PMID

[34]
Peng J, Chen X, Liu Y et al., 2016. Spatial identification of multifunctional landscapes and associated influencing factors in the Beijing-Tianjin-Hebei Region, China. Applied Geography, 74: 170-181.

DOI

[35]
Shi Z, Deng W, Zhang S, 2018. Spatio-temporal pattern changes of land space in Hengduan Mountains during 1990-2015. Journal of Geographical Sciences, 28(4): 529-542.

DOI

[36]
Sun P, Xu Y, Yu Z et al., 2016. Scenario simulation and landscape pattern dynamic changes of land use in the poverty belt around Beijing and Tianjin: A case study of Zhangjiakou city, Hebei province. Journal of Geographical Sciences, 26(3): 272-296.

DOI

[37]
Taelman S E, Schaubroeck T, De Meester S et al., 2016. Accounting for land use in life cycle assessment: The value of NPP as a proxy indicator to assess land use impacts on ecosystems. Science of the Total Environment, 550: 143-156.

DOI

[38]
Tan M, Li X, Li S et al., 2018. Modeling population density based on nighttime light images and land use data in China. Applied Geography, 90: 239-247.

DOI

[39]
Tang C, Fan J, Sun W, 2015. Distribution characteristics and policy implications of territorial development suitability of the Yangtze River Basin. Journal of Geographical Sciences, 25(11): 1377-1392.

DOI

[40]
Tao Y, 2021. Quantitative recognition and characteristic analysis of production-living-ecological space evolution for five resource-based cities: Zululand, Xuzhou, Lota, Surf Coast and Ruhr. Remote Sensing, 13(8): 1563.

DOI

[41]
Tian F, Li M, Han X et al., 2020. A production-living-ecological space model for land-use optimisation: A case study of the Core Tumen River Region in China. Ecological Modelling, 437: 109310.

DOI

[42]
Verburg P H, van de Steeg J, Veldkamp A et al., 2009. From land cover change to land function dynamics: A major challenge to improve land characterization. Journal of Environmental Management, 90(3): 1327-1335.

DOI PMID

[43]
Wei C, Lin Q, Li Yu et al., 2021. Research on sustainable land use based on production-living-ecological function: A case study of Hubei Province, China. Sustainability, 13(2): 996.

DOI

[44]
Wiggering H, Dalchow C, Glemnitz M et al., 2006. Indicators for multifunctional land use: Linking socio-economic requirements with landscape potentials. Ecological Indicators, 6(1): 238-249.

DOI

[45]
Willem K K A, 2019. Multiple land use planning for living places and investments spaces. European Planning Studies, 27(6): 1146-1158.

DOI

[46]
Wu J, Zhang D, Wang H et al., 2021. What is the future for production-living-ecological spaces in the Greater Bay Area? A multi-scenario perspective based on Dee. Ecological Indicators, 131: 108171.

DOI

[47]
Xi J, Wang S, Zhang R, 2016. Restructuring and optimizing production-living-ecology space in rural settlements: A case study of Gougezhuang Village at Yesanpo tourism attraction in Hebei province. Journal of Natural Resources, 31(3): 425-435. (in Chinese)

[48]
Xiao Y, Ouyang Z, Xu W et al., 2015. GIS-based spatial analysis of soil erosion and soil conservation in Chongqing,China. Acta Ecologica Sinica, 35(21): 7130-7138. (in Chinese)

[49]
Xie X, Li X, Fan H et al., 2021. Spatial analysis of production-living-ecological functions and zoning method under symbiosis theory of Henan, China. Environmental Science and Pollution Research, 28(48): 69093-69110.

DOI

[50]
Xinhuanet, 2015. Central Urban Work Conference Held in Beijing. http://www.xinhuanet.com//politics/2015-12/22/c_1117545528.html.

[51]
Yang Y, Bao W, Liu Y, 2020. Coupling coordination analysis of rural production-living-ecological space in the Beijing-Tianjin-Hebei region. Ecological Indicators, 117: 106512.

DOI

[52]
Yang Z, Liu Y, Tao W et al., 2008. Method for evaluating the degrees of land use sustainability of mountainous county and its application in Yunnan Province, China. Journal of Mountain Science, 5(2): 98-112.

DOI

[53]
Yu S, Deng W, Xu Y et al., 2020. Evaluation of the production-living-ecology space function suitability of Pingshan County in the Taihang Mountainous Area, China. Journal of Mountain Science, 17(10): 2562-2576.

DOI

[54]
Yu Z, Xu E, Zhang H et al., 2020. Spatio-temporal coordination and conflict of production-living-ecology land functions in the Beijing-Tianjin-Hebei Region, China. Land, 9(5): 170.

DOI

[55]
Zhang H, Xu E, Zhu H, 2015. An ecological-living-industrial land classification system and its spatial distribution in China. Resources Science, 37(7): 1332-1338. (in Chinese)

[56]
Zhang H, Xu E, Zhu H, 2017. Ecological-living-productive land classification system in China. Journal of Resources and Ecology, 8(2): 121-128.

DOI

[57]
Zhang Y, Long H, Tu S et al., 2019. Spatial identification of land use functions and their tradeoffs/synergies in China: Implications for sustainable land management. Ecological Indicators, 107: 105550.

DOI

[58]
Zhou D, Xu J, Lin Z, 2017. Conflict or coordination? Assessing land use multi-functionalization using production-living-ecology analysis. Science of the Total Environment, 577: 136-147.

DOI

[59]
Zhu Y, Yu B, Zeng J et al., 2015. Spatial optimization from three spaces of production, living and ecology in national restricted zone: A case study of Wufeng County in Hubei Province. Economic Geography, 35(4): 26-32. (in Chinese)

Outlines

/