Research Articles

Dynamic changes in urban land spatial inequality under the core-periphery structure in urban agglomerations

  • FANG Xiaoqian , 1 ,
  • SU Dan 1 ,
  • WU Qing 1 ,
  • WANG Jiayi 1 ,
  • ZHANG Yangjian 2 ,
  • LI Guoyu 1, 3 ,
  • CAO Yu , 1, *
Expand
  • 1. Department of Land Management, School of Public Affairs, Zhejiang University, Hangzhou 310058, China
  • 2. Institute of Geographic Sciences and Natural Resources Research, CAS, Beijing 100101, China
  • 3. Department of Forestry and Natural Resources, Purdue University, West Lafayette, IN 47907, USA
*Cao Yu, Professor, E-mail:

Fang Xiaoqian, PhD Candidate, specialized in land resources management and landscape ecology. E-mail:

Received date: 2022-03-28

  Accepted date: 2022-12-01

  Online published: 2023-05-11

Supported by

National Social Science Fund of China(20AGL025)

Abstract

Relatively coordinated development among cities can typically promote the integration of the whole urban agglomeration, while urbanization of land has been found important to economic development in developing countries. Numerous studies have measured the urban land expansion in urban agglomerations. However, urban land spatial inequality under a specific spatial structure remains poorly understood. Here, we combined the β-convergence model and the core-periphery structure to explore the dynamic changes in urban land spatial inequality in urban agglomerations. The Yangtze River Delta Urban Agglomeration (YRDUA) in China was selected as the study area. Indicators of urban land have been applied in conjunction with a modified conditional β-convergence model, while the existence of the core-periphery structure was tested by analyzing coefficients of the control variable. The results show that although the spatial inequality of urban land area had decreased during 2000-2020, the whole YRDUA had still shown an obvious core-periphery structure. Compared with urban land area, the spatial inequality of urban land economic density and population density had decreased more rapidly, and the core-periphery structure was less obvious. Our findings can help to improve our current understanding of urban agglomeration and serve as a scientific reference for the coordinated development of urban agglomerations.

Cite this article

FANG Xiaoqian , SU Dan , WU Qing , WANG Jiayi , ZHANG Yangjian , LI Guoyu , CAO Yu . Dynamic changes in urban land spatial inequality under the core-periphery structure in urban agglomerations[J]. Journal of Geographical Sciences, 2023 , 33(4) : 760 -778 . DOI: 10.1007/s11442-023-2105-y

1 Introduction

Over the last several decades, rapid urbanization and urban regionalization have become a global phenomenon (Wang et al., 2012). In the process, cities are becoming more concentrated spatially and more interconnected in infrastructure, environment, economy, and culture (Ross and Woo, 2011), resulting in the phenomenon known as urban agglomeration (Fang and Yu, 2017; Fang, 2019; Fu and Zhang, 2020). For urban agglomerations, studies have found that relatively coordinated development among cities can promote the integration of the whole region (Liu et al., 2020; Zheng and Du, 2020). Considering that urbanization of land has contributed to economic development significantly, especially in developing countries experiencing rapid urbanization of land, it is vital to measure the dynamic changes in urban land spatial inequality between cities within the urban agglomerations. Inequality is a fundamental issue of human society, and spatial inequality is one of its important aspects. In terms of the measurement of spatial inequality, the commonly used indicators include the coefficient of variation, the Gini coefficient, and Theil’s T Statistic (Wei et al., 2017). Compared to these static-level indicators, β-convergence analysis, which is originally an important economic model referring to the tendency of initially poorer countries to grow faster than richer countries, can reflect the dynamic change in spatial inequality. Nowadays, it has been frequently adopted in different research fields to analyze whether the spatial inequality among regions is expanding or contracting on a dynamic level (Mohammadi and Ram, 2012; Li et al., 2017).
Spatial structure of the urban agglomeration refers to the mutual location relationship and distribution form of social and economic factors within a certain geographical scope (Cao et al., 2018; Zhang et al., 2020). According to the previous literature, no matter from the perspective of economics (Rossi-Hansberg and Wright, 2007), planning and expansion (Elliott, 1997; Sun and Zhao, 2018), or urban environment and social issues (Yu et al., 2020), the spatial structure of the urban agglomeration has attracted lots of attention due to its association with the integrated development (Cao et al., 2018; Zhu et al., 2021). However, although there are numerous studies on urban expansion measurement, limited studies have measured the urban land spatial inequality within an urban agglomeration under a specific spatial structure. In studies about the urban agglomeration spatial structure, in addition to the measurement of the direction and intensity of economic connection between cities at multiple time points (Ye et al., 2019; Fang et al., 2020), different types of spatial morphological structures have been concluded as well (Li and Liu, 2018). For urban agglomerations with polycentric structure, the theory of core-periphery structure, which was proposed by Friedmann (1966) and enriched by Krugman (1996), summarized the relationship between the core and the periphery and has been adapted to analyze the structure evolution. There are two opposite spatial spillover effects between the core and periphery, namely the polarization effect and the diffusion effect. The dynamics of spatial inequality among cities in the urban agglomeration are determined by these two effects together. The core-periphery structure of urban agglomerations may generate negative effects, including the disconnection between the cities in the core and periphery, and the migration of population, capital, and other elements to the core caused by the siphoning effect (Fang and Yu, 2017). Therefore, to avoid these negative effects, it is necessary to narrow the difference between the core and periphery, in other words, to reduce the degree of spatial inequality.
For most developing countries, urban agglomerations generally imply rapid expansion of urban land used to accommodate the urban population and anthropogenic activities (Wei and Ewing, 2018; Wang et al., 2022). There is a consensus that urbanization is a geographically uneven process at multiple spatiotemporal scales (Long et al., 2018). Numerous studies have explored the driving factors of urban land use change in a single city through empirical statistical methods (Cui et al., 2019) and machine learning methods (Zhang et al., 2019; Wu et al., 2021). Terrain factors, traffic factors, infrastructure factors, and population are widely studied driving factors for specific cities (Zhang et al., 2019). Besides, the fact that urban land is shaped by political and institutional factors has been extensively mentioned in the literature as well (Colsaet et al., 2018). As the world’s largest developing country, China has been experiencing rapid urbanization since deepening its economic reforms in the 1990s (Xu and Min, 2013; Zhao et al., 2015). The essential factors that lead to uneven urbanization of land throughout China include uneven opportunities, unequal ecological carrying capacities, and uneven process of globalization (Wei and Ye, 2014; Wei et al., 2017). These factors have undoubtedly made important impacts on the rise of urban agglomerations. Nowadays, urban agglomerations have become important spatial units for polycentric governance in China (Su et al., 2017). In the past decade, policies on the integration of urban agglomerations have gradually increased, and most of them are centered on land resources (Li et al., 2022). From the institutional perspective, intervention and policies from the government with the top-down style are factors which profoundly affect spatial inequality. In addition to the magnitude of urban land expansion, the coordination degree of urban land with economy and population are also fundamental characteristics that can indicate the energy use, urban environment, and many other aspects of urban life (Salomons and Berghauser Pont, 2012; McFarlane, 2015).
Overall, pre-existing literature on urban land changes in urban agglomerations mainly focused on the measurement and driving factors of urban land expansion in individual cities, while in-depth investigations on urban land spatial inequality under a specific spatial structure have remained limited. In this study, the primary objective is to extend knowledge on the coordinated developments of urban agglomerations by proposing a method of measuring spatial inequality under a specific spatial structure in rapid urbanizing urban agglomerations. The Yangtze River Delta Urban Agglomeration (YRDUA), which is the largest inter-provincial urban agglomeration throughout China and has experienced the most rapid urban expansions during the past two decades, was selected as the study area. It has been found that local industries of the YRDUA show strong patterns of development momentum, strengthening relations between cities (Liu et al., 2020). However, although there are large spatial differences both in the economic development and urban land use changes of cities within the YRDUA, the spatial structure of urban land expansion in the YRDUA has received less attention compared to economic development. Therefore, we attempted to analyze the spatial inequality of urban land use changes based on the core-periphery structure at the prefecture-level city scale. Specifically, the paper aims to: 1) develop an approach that can measure the spatial inequality within an urban agglomeration under the core-periphery structure; 2) investigate the spatiotemporal dynamic of spatial inequality in the YRDUA from 2000 to 2020.

2 Materials and methods

2.1 Study area

The YRDUA is located on the east coast of China, close to the East China Sea and the Yellow Sea. Nowadays, the YRDUA is one of the most developed urban agglomerations and the most active economic development region in China. Over the past two decades, the spatial scope of the YRDUA has continued to expand outward. Although in the “Outline of the Yangtze River Delta Regional Integrated Development Plan” released in 2019, the scope of the YRDUA has been expanded to the whole of Shanghai, Zhejiang, Jiangsu, and Anhui, the core area of the YRDUA includes only 26 cities—in addition to Shanghai, there are nine prefecture-level cities of Jiangsu province, eight prefecture-level cities of Zhejiang province, and eight prefecture-level cities of Anhui province (Figure 1a).
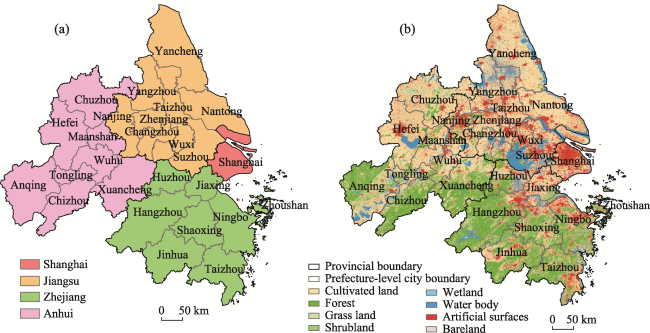
Figure 1 Location of the prefecture-level cities (a), and land use types (b) in the Yangtze River Delta Urban Agglomeration in 2020
According to the Statistical Yearbook, the YRDUA in this study covers an area that only accounts for 2.2% of the country’s total land area. However, the regional GDP was 19.77 trillion yuan and the total population was 155 million in 2018, accounting for approximately 21.5% and 11.1% of the country’s total GDP and population respectively. Besides, when looking back at the evolution history of the YRDUA, it can be found that Shanghai is undoubtedly the core city of the YRDUA, while cities in Anhui are not only the farthest from Shanghai, but also have a gap between their economic level and Shanghai, Zhejiang, and Jiangsu. In general, these 26 cities have a distinct core-periphery structure, while China’s central government has been committed to the integrated development of the YRDUA.
According to the urban hierarchical system of China, Shanghai, the core of the YRDUA, is one of the four municipalities directly under the central government. Therefore, there are a total of 4 provincial units in the YRDUA: Shanghai, Jiangsu, Zhejiang, and Anhui. However, considering that there are no prefecture-level cities in municipalities, in this paper, Shanghai was also regarded as a prefecture-level city as well. Under this circumstance, there are a total of 26 prefecture-level units in the YRDUA. The land use of the YRDUA in 2020 illustrates that the area and distribution of urban land in different cities quite vary (Figure 1b).

2.2 Data sources

Data for this paper consisted of land cover data and socioeconomic data. Land cover data were collected from the GlobeLand30 dataset (http://www.globallandcover.com/) provided by the National Geomatics Center of China. It is an open-access global land cover data product and the resolution of the land cover data is 30 meters (Chen et al., 2015). There are already data for 2000, 2010, and 2020, and the data consists of 10 first-level classes, including cropland, forest, shrubland, grassland, wetland, tundra, water bodies, bare land, permanent snow/ice, and artificial surfaces. According to the classification criteria, artificial surfaces in this dataset were regarded as urban land in this paper, it is because in this dataset artificial surfaces mainly refer to lands altered by human activities including housing, industrial, mining, and transportation (Chen et al., 2017). Data of each time point in the YRDUA is composed of 4 tiles. At each time point, these 4 tiles were mosaicked and then used to extract the YRDUA by the administrative boundary. Regarding the urban land area, statistical yearbooks and remote sensing images are two common sources. Compared with statistical yearbook data, remote sensing data will not be affected by the adjustment of administrative divisions.
To analyze the coordination degree of urban land with economy and population, socioeconomic data at the prefectural level had been collected from the Statistical Yearbook of each province or direct-controlled municipality to calculate the urban land economic density and urban land population density. The year of the data is consistent with the land cover data, i.e., 2000, 2010, and 2020. Socioeconomic data includes the output value of the secondary and tertiary industries and the permanent population. Besides, the administrative boundary data in the YRDUA in this study were obtained from the Chinese Academy of Sciences Resource and Environmental Science Data Center (http://www.resdc.cn/).

2.3 Multidimensional assessment of urban land

To assess the expansion of urban land and the coordination degree of urban land with economy and population, an indicator system has been constructed.
The annual growth rate of urban land (AER) was calculated as follows (Sun and Zhao, 2018):
$AER=100%\times \left( \sqrt[t]{UL{{A}_{e}}/UL{{A}_{s}}}-1 \right)$
where ULAe refers to the area of urban land at the end time, ULAs refers to the area of urban land at the initial time, and t is the time interval between the initial time and end time. This indicator can reflect the growth rate of urban land area in each city.
The landscape expansion index (LEI) was calculated using the following equation (Liu et al., 2010):
LEI = A1 / A2
where LEI refers to the landscape expansion index for each newly expanded patch, A1 refers to the area of the intersection between the buffer zone of the new patch and the old patch, A2 refers to the area of the buffer zone of the new patch (Figure 2). In this paper, the buffer distance is 30 meters, which is the spatial resolution of the land cover data. The new expansion patches can be divided into three categories according to the LEI: when LEI > 0.5, it is a patch of infilling; when 0 < LEI ≤0.5, it is a patch of edge-expansion, and when LEI = 0, it is a patch of leapfrogging. The area proportions of these three types can reflect the agglomeration and dispersion of new urban land patches in each city.
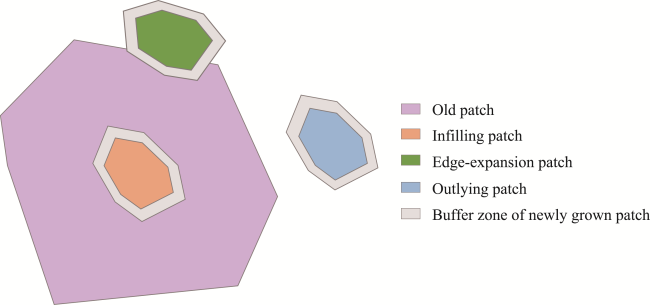
Figure 2 Three types of urban land expansion according to landscape expansion index
Urban land economic density (ULED) was calculated using the following equation (Wu et al., 2017):
$ULE{{D}_{i,t}}=~GD{{P}_{i,t}}/UL{{A}_{i,t}}$
where ULAi,t refers to the area of urban land of the city i in the year t; GDPi,t refers to the total output value of the secondary and tertiary industry of the city i in the year t. This indicator can reflect the degree of coordination between the urban land area and the economic level of each city.
Urban land population density (ULPD) was calculated using the following equation (Xu et al., 2019):
$ULP{{D}_{i,t}}=~PO{{P}_{i,t}}/UL{{A}_{i,t}}$
where ULAi,t refers to the area of urban land of the city i in the year t; POPi,t refers to the permanent population of the city i in the year t. This indicator can reflect the degree of coordination between the urban land area and the population of each city.

2.4 Convergence analysis

Before the model is specified, a brief introduction to convergence analysis is necessary. Convergence theory studies the dynamic trend of economic disparities between countries or regions. There are three types of convergence: σ-convergence, β-convergence, and club convergence. σ-convergence refers to the decrease in the dispersion of regional development over time, while β-convergence refers to regions with poorer economies growing faster than richer ones. Club convergence means the convergence of regions with similar economic structures and initial per capita economic levels to the same local stable state. What we adopted in this study is the β-convergence analysis, and the reason is that we wanted to explore the dynamic changes in spatial inequality within the entire urban agglomeration. When there is β-convergence, it means that there is a negative correlation between the growth rate of the variable and the initial level of the variable. Specifically, it means that the area with a low initial level grows faster than the area with a high initial level (Figure 3). β-convergence can be further divided into absolute/unconditional convergence and conditional convergence. The most commonly used model of unconditional β-convergence was as follows (Barro, 1991; Barro and Sala-i-Martin, 1992):
$\ln \left( {{y}_{i,t+T}}/{{y}_{i,t}} \right)=\alpha +\beta \ln \left( {{y}_{i,t}} \right)+{{\varepsilon }_{i,t}}$
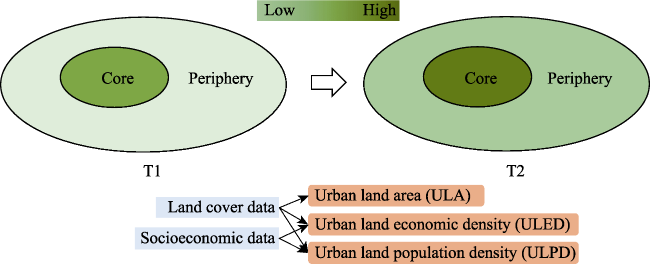
Figure 3 The analytical framework of this paper
where ln(yi,t+T /yi,t) refers to the per-capita income growth rate of a country or region i in the period from t to t+T; ln(yi,t) refers to the initial level of per capita income of a country or region i at the time of t; α and β are estimated parameters and εi,t is the random residual. But in this paper, y refers to the indicators of urban land, including ULA, ULED, and ULPD. When β is negative significantly, there is β-convergence of the indicator.
To achieve both vertical and horizontal comparisons within an analytical model, we assume that the two space units A and B have the same steady-state and convergence speed. The Equation is as follows:
$\left[ \ln \left( {{y}_{A,t+T}}/{{y}_{B,t+T}} \right)-\ln \left( {{y}_{A,t}}/{{y}_{B,t}} \right) \right]=\left( {{\alpha }_{A}}-{{\alpha }_{B}} \right)+\beta \left[ \ln \left( {{y}_{A,t}} \right)-\ln \left( {{y}_{B,t}} \right) \right]+\left( {{\varepsilon }_{A,t}}-{{\varepsilon }_{B,t}} \right)$
Then, when $\text{y}={{y}_{A}}/{{y}_{B}}$, Eq. (6) can be changed to Eq. (7):
$\ln \left( {{y}_{t+T}}/{{y}_{t}} \right)=\alpha +\beta \ln \left( {{y}_{t}} \right)+{{\varepsilon }_{t}}$
Besides, the β-convergence model generally includes a set of control variables. When there is convergence only when there are control variables, it is called conditional β-convergence. The notion of conditional β-convergence is limited as lots of structural and local variables that significantly influence regional inequality have been removed (Petrakos et al., 2005). However, it should be noted that the concept of β-convergence in this neoclassical growth model we used lacks consideration of spatial autocorrelation. In this paper, the control variable is the provincial border between two space units.
$\ln \left( {{y}_{i,t+T}}/{{y}_{i,t}} \right)=\alpha +\beta \ln \left( {{y}_{t}} \right)+\delta Border+{{\varepsilon }_{t}}$
where the Border is a dummy variable, which represents the type of border and can be divided into intra-provincial (INTRA) or inter-provincial (INTER) types. The inter-provincial pairs can be further subdivided into six types: Shanghai-Jiangsu (SJ), Shanghai-Zhejiang (SZ), Shanghai-Anhui (SA), Jiangsu-Zhejiang (JZ), Jiangsu-Anhui (JA), and Zhejiang- Anhui (ZA). The numbers of city pairs on each border are listed in Table 1. There are 92 pairs of two cities belonging to the INTRA, which are the baseline in Eq. (8). It should be noted that the coefficients of these inter-provincial borders are the results compared to that of intra-provincial samples. Through this control variable, we can verify the existence of the core-periphery structure in urban agglomerations by analyzing the coefficients of Border in the Results section.
Table 1 Basic characteristics of the borders
Border INTRA INTER
SJ SZ SA JZ JA ZA
Count 92 9 8 8 72 72 64
Proportion (%) 28.31 2.77 2.46 2.46 22.15 22.15 19.69

3 Results

3.1 Spatiotemporal dynamic patterns of urban land expansion

Figure 4 showed the spatial distribution of urban land in the YRDUA from 2000 to 2020. A Z-shaped urban land hot zone with Shanghai and Hangzhou as the two turning points emerges in the whole YRDUA. The area of urban land expansion of 26 cities is shown in Figure 5. The urban land area of Shanghai is much larger than other cities, followed by Suzhou and Ningbo. The spatiotemporal pattern of urban land expansion varied across provincial units over the past two decades. Although the administrative area accounts for 33.50%, the area of increased urban land in the cities of Anhui was 2136.42 km2, only accounting for 13.08% of the total increased regional urban land area. By contrast, the contribution rate of cities in Shanghai, Jiangsu, and Zhejiang are 8.54%, 43.46%, and 34.91% respectively, and their administrative area accounted for 3.71%, 30.81%, and 31.98%. It is apparent that the expansion of urban land in Anhui province did lag behind other regions in the YRDUA in terms of land area.
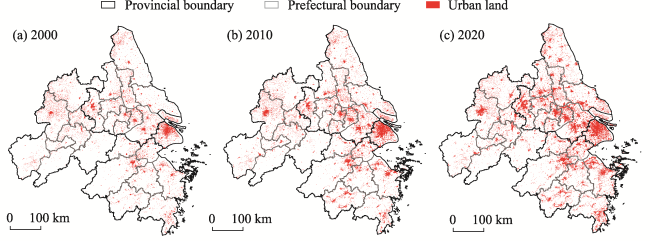
Figure 4 Distribution of urban land in the Yangtze River Delta Urban Agglomeration in 2000, 2010, and 2020
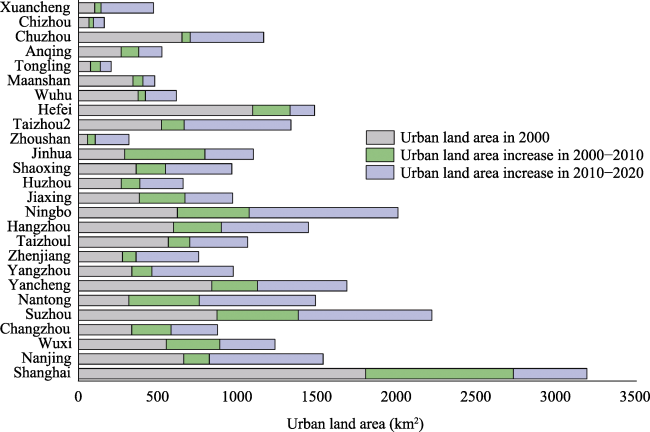
Figure 5 The urban area in 2000 and newly increased urban area from 2000 to 2020 for 26 cities in the Yangtze River Delta Urban Agglomeration
The annual urban land expansion rate (AER) is shown in Table 2. In general, the AER of each city varied greatly, and there was no obvious difference between the four provincial units. But some rules can be drawn, such as the AER of 2010-2020 is generally higher than that of 2000-2010. In the first 10 years, Jinhua had the highest AER at 10.60%, and the AER of Chuzhou was the lowest at 0.77%. In the next 10 years, the AER of Xuancheng was the highest at 12.79%, and Hefei had the lowest AER at 1.10%. Besides, when the time interval is expanded from 10 years to 20 years, it can be found that the difference between cities decreases. In general, the AER of each city varied greatly, and there was no obvious difference between the four provincial units, that is, from the perspective of AER, the YRDUA did not show a core-periphery structure.
Table 2 The annual growth rate of urban land of 26 cities in the Yangtze River Delta Urban Agglomeration
City 00-10 (%) 10-20 (%) 00-20 (%) City 00-10 (%) 10-20 (%) 00-20 (%)
Shanghai 4.24 1.58 2.90 Huzhou 3.69 5.46 4.57
Nanjing 2.20 6.46 4.31 Shaoxing 4.19 5.84 5.01
Wuxi 4.87 3.35 4.11 Jinhua 10.60 3.30 6.88
Changzhou 5.68 4.15 4.91 Zhoushan 6.32 11.63 8.94
Suzhou 4.72 4.86 4.79 Taizhou2 2.43 7.24 4.81
Nantong 9.15 6.97 8.05 Hefei 1.97 1.10 1.53
Yancheng 2.99 4.13 3.56 Wuhu 1.17 3.90 2.52
Yangzhou 3.23 7.74 5.46 Maanshan 1.69 1.71 1.70
Zhenjiang 2.73 7.64 5.16 Tongling 6.03 4.17 5.10
Taizhou1 2.17 4.28 3.22 Anqing 3.50 3.32 3.41
Hangzhou 4.16 4.87 4.52 Chuzhou 0.77 5.18 2.95
Ningbo 5.61 6.46 6.04 Chizhou 3.58 5.66 4.61
Jiaxing 5.74 3.76 4.75 Xuancheng 3.29 12.79 7.94
New urban land patches in YRDUA can be divided into three types according to Equation (2), namely infilling, edge-expansion, and leapfrogging. Figure 6 illustrated the spatial distribution of these three urban growth types during the two periods separately. The proportions of these three types were calculated according to the total area of patches rather than the patch number (Figure 7). When comparing the results of two decades, it can be found that the proportions of these three types have undergone great changes. During 2000-2010, most cities in the YRDUA were distributed on the upper right side of the triangle, that is, the urban land expansion during this period was dominated by edge-expansion. In the following ten years, the distribution of cities as a whole has shifted slightly to the lower left, indicating that there was an overall decline in the type of edge-expansion and an increase in the type of leapfrogging on the proportion. However, from the distribution of 26 points in the two ternary plots, whether it is the first ten years or the next ten years, the proportion of edge-expansion was highest overall.
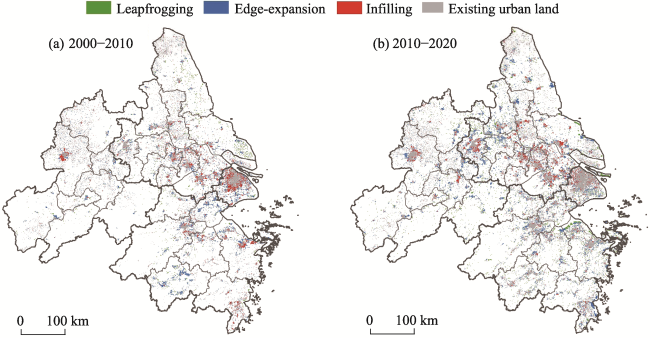
Figure 6 Spatial patterns of three types of new urban land patches for the Yangtze River Delta Urban Agglomeration from 2000 to 2020
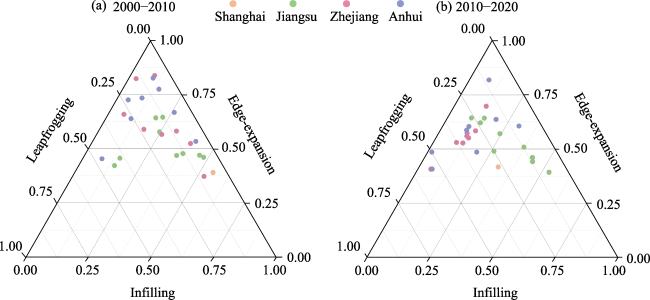
Figure 7 The proportion of three types of new urban land patches from the total area

3.2 Changes in economic and population density of urban land

Changes in the urban land economic density and urban land population density of the 26 cities in the YRDUA are shown in Table 3. Regarding the change in ULED, it can be found that the ULED value of almost all cities had increased, and the cities with the highest values were located in Shanghai, Zhejiang, and Jiangsu. In contrast, the ULPD values of almost all cities had decreased, and the inter-provincial difference was not as obvious as ULED. The change trends of these two indicators are also shown in Figure 8, that is, the value of ULED showed an upward trend from 2000 to 2020, while ULPD showed an almost opposite trend. In addition, it is obvious that ULED had a larger increase during 2000-2010 compared with the next decade, while ULPD decreased more rapidly during the first decade. That is to say, whether it is the economic density or population density, the changes in the first ten years were more obvious. Besides, according to the upper and lower quartiles of box plots, the spatial inequality of urban land population density among 26 cities in the YRDUA was lower than the urban land economic density.
Table 3 The changes in urban land economic density (ULED) and urban land population density (ULPD) during 2000-2020
City ULED
00-10
ULED
10-20
ULPD
00-10
ULPD
10-20
City ULED
00-10
ULED
10-20
ULPD
00-10
ULPD
10-20
Shanghai 3.76 5.83 -546 -472 Huzhou 1.88 1.56 -2928 -1594
Nanjing 4.6 3.37 1376 -3496 Shaoxing 2.9 1.16 -4060 -2549
Wuxi 4.31 3.5 -787 -1034 Jinhua 0.8 1.63 -10227 517
Changzhou 3.39 3.67 -2397 -1727 Zhoushan 4.09 -1.23 -7749 -5515
Suzhou 4.9 2.42 552 -1438 Taizhou2 2.29 0.3 -2374 -3782
Nantong 2.3 2.21 -15300 -4295 Hefei 1.67 4.6 -903 2107
Yancheng 1.28 1.39 -2926 -2572 Wuhu 2.05 3.3 -428 532
Yangzhou 3.25 1.42 -3661 -5008 Maanshan 1.6 2.42 -164 1202
Zhenjiang 3.74 0.12 -1088 -4287 Tongling 2.45 1.26 -3739 1083
Taizhou1 2.11 1.99 -2240 -2390 Anqing 1.48 2.04 -8311 -6062
Hangzhou 4.24 4.52 -2715 621 Chuzhou 0.5 1.59 -887 -2167
Ningbo 2.87 1.4 -3340 -650 Chizhou 2.1 2.07 -8295 -6664
Jiaxing 1.99 2.31 -3799 489 Xuancheng 1.89 -0.02 -8902 -12557

Notes: ULED00-10 represents the ULED value in 2010 minus the ULED value in 2000. The unit of the ULED is million yuan/km2, and the unit of the ULPD is people/km2.

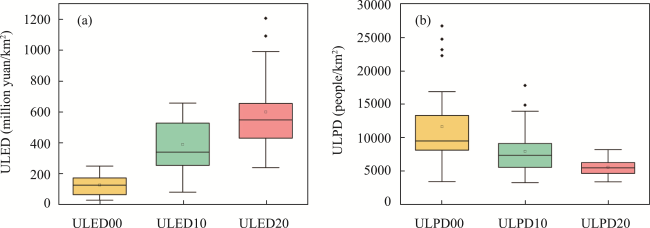
Figure 8 Urban land economic density (ULED) and urban land population density (ULPD) in 2000, 2010, and 2020

3.3 Dynamic changes in spatial inequality

The results of ULA, ULPD, and ULED for Eq. (8) are shown in Table 4. As we can see, β (the estimated coefficient of ln(yt)) for the three indicators are all negative and have passed the test with significance at the 1% level. In addition, the absolute values of the coefficients in 2010-2020 are greater than those in 2000-2010, indicating that the convergence speed in the latter ten years was greater than that in the previous ten years, regardless of whether it is the urban land area or urban land density of population and economy. When comparing the differences between the indicators, it can be found that the convergence speed of ULPD and ULED is significantly greater than that of ULA. Additionally, combined with Figure 8, it can be seen that the increase of ULED and the decrease of ULPD of the YRDUA all show a synchronous convergence.
Table 4 Estimated models of urban land area (ULA), urban land economic density (ULED) and urban land population density (ULPD)
Variables ULA ULED ULPD
00-10 10-20 00-20 00-10 10-20 00-20 00-10 10-20 00-20
ln(yt) -0.126*** -0.225*** -0.310*** -0.312*** -0.424*** -0.679*** -0.352*** -0.790*** -0.863***
BSJ 0.111 -0.016 0.059 -0.222* 0.162 0.080 0.132 0.252** 0.279***
BSZ 0.053 -0.003 0.023 -0.002 0.312*** 0.343** 0.333*** 0.162 0.232**
BSA 0.336*** 0.247** 0.488*** -0.112 0.174 0.222 0.169* 0.100 0.135
BJZ -0.119*** 0.080** -0.012 0.111** -0.097** -0.053 0.203*** -0.259*** -0.216***
BJA 0.164*** 0.328*** 0.453*** -0.001 -0.236*** -0.174** 0.040 -0.323*** -0.315***
BZA 0.222*** 0.313*** 0.487*** -0.221*** -0.386*** -0.437*** -0.160*** -0.232*** -0.266***
Constant 0.061** -0.065** -0.023 0.109*** 0.248*** 0.316*** -0.002 0.169*** 0.169***
R2 0.354 0.495 0.656 0.487 0.566 0.737 0.574 0.733 0.843
N 325 325 325 325 325 325 325 325 325

Notes: ***, **, and * indicate significance at the 1%, 5%, and 10% levels, respectively, and N is the sample size.

In addition to the estimated coefficient of ln(yt), the estimated coefficients of the dummy variables have also been shown. From the sign of the estimated coefficient, when the coefficient is positive, it means that these inter-provincial samples have made negative contributions to the convergence compared to the intra-provincial samples. The results on a time scale of 10 years are as follows: 1) Firstly, for ULA, whether it is the first ten years or the next ten years, only the coefficients of BSJ and BSZ are not significant. Combined with the signs, it can be seen that compared with intra-provincial samples, the samples between Anhui and the other three provincial units have hindered the overall convergence. Cities in Anhui, as the periphery of the YRDUA, did lag behind the core areas. 2) Secondly, for ULED, the coefficients of BZA are negative and have passed the test with significance at the 1% level, indicating that compared with intra-provincial samples, the samples between Anhui and Zhejiang have a positive effect on the overall convergence. Besides, the coefficients of BSJ and BJZ during 2000-2010 and coefficients of BSZ, BJZ and BJA during 2010-2020 are significant as well. 3) Thirdly, for ULPD, coefficients of BSZ, BJZ and BZA have all passed the test with significance at the 1% level during 2000-2010, while during 2010-2020, they are BJZ, BJA and BZA.
If the time scale extends from 10 years to 20 years, it can be known that the coefficients of BSA, BJA, and BZA of ULA have all passed the test with significance at the 1% level and the signs are positive. The coefficients of the other three borders are not significant. For ULED, only the coefficients of BSZ, BJA, and BZA are significant, while for ULPD, coefficients are all significant except for BSA. Overall, compared with ULA, the samples between Anhui and the other three provincial units have contributed to the overall convergence of ULED and ULPD.
In general, the results provided some evidence that although the spatial inequality of urban land area had decreased during 2000-2020, the entire YRDUA had shown an obvious core-periphery structure from the perspective of inter-provincial differences. compared with urban land area, the spatial inequality of urban land economic density and population density had decreased more rapidly, and the core-periphery structure was less obvious.

4 Discussion

4.1 Urban land expansion under China’s land-use control system

In terms of urban land area (ULA), our results empirically show that there has been an overall trend of convergence in the whole YRDUA, indicating a reduction in spatial inequality at the prefectural level. This finding is in line with the research by Wang et al. (2016), which focused on the boundary effects of city administrative levels by using the statistical data in another urban agglomeration in China and found a convergence trend in urban land area as well. However, although the spatial inequality declined, compared with the cities in Anhui, the remaining three provincial units are more consistent and more drastic in the expansion of urban land, indicating that an obvious core-periphery structure with cities in Anhui as the periphery still existed. As mentioned above, although the core-periphery structure of urban agglomerations may generate some negative effects, it is inevitable due to the geographic position, resource endowment, and economic development level varied across cities in the urban agglomeration.
To figure out the convergence trend of urban land areas in the urban agglomeration, it is vital to clarify the allocation of indicators for construction land in China. Since the end of the last century, China has implemented a strict land-use control system to protect farmland, which includes restrictions on incremental allocation of construction land due to agricultural land encroachment and food security threats (Song and Pijanowski, 2014). The general land use planning of China involves a top-down decomposition of indicators, and the incremental allocation of construction land indicators is usually based on the weighted average of several factors, such as the total economic volume, population, and resource endowments (Liu et al., 2018). Affected by fiscal decentralization and cadre evaluation mechanisms, every local government wants to obtain more indicators to promote economic development (Yuan et al., 2019). Therefore, the actual new urban land area over a while is usually not lower than the allocated indicators. However, it should be pointed out that although the convergence of urban land area among cities in the inter-provincial urban agglomeration, the indicators of prefecture-level cities are determined by provincial governments, which own the power of land administration. Therefore, the convergence in the urban land area is not a deliberate result of administrative regulation as there is currently no government at the scale of urban agglomerations. To some extent, inter-provincial urban agglomerations, whose scale is between the country and the province, are in an awkward position. In the past 20 years, to pursue “equilibrium” and curb the further widening of regional differences, China has formulated a land supply policy that favors underdeveloped areas, which has been considered to be the spatial mismatch of land resources by many scholars from the perspective of the economy. However, when the provincial government allocates land resources to prefecture-level cities, it is more based on economic interests. That is, there are differences between the goals of the central government and the local governments.

4.2 Coordination between urban land, economy, and population

The results also showed that compared to the urban land area, the convergence trends of urban land economic density and population density are much greater, and the provincial differences between the core and periphery are much smaller. These two indicators can reflect the coordination degree of land, economy, and population respectively, and the results are consistent with the government’s expectations for the YRDUA. As we all know, Gross Domestic Product (GDP) is usually used to reflect economic development and human well-being. Different from the GDP per capita, urban land economic density (ULED) in this paper represents the coordination between urban land and the economy. According to the former studies, urban land economic density has been found closely related to urbanization and industrialization (Meng et al., 2008; Wu et al., 2017; Yu et al., 2019). In contrast to economic density, urban land population density (ULPD) in this paper represents the permanent population per square kilometer of urban land in the YRDUA. Results have shown that the UPLD declined constantly during 2000-2020, which is in line with many studies (Seto, 2011; Luo et al., 2018; Xu et al., 2019). Friedmann (1966) divided the evolution of regional spatial structure into four stages: pre-industrial society, development of core and periphery, dispersion of economic activities in the periphery region, and the emergence of spatial integration. According to the characteristics of each stage, it seems like the YRDUA during 2000-2020 appears to belong to the third stage.
Compared with the ULA, the factors affecting the ULED are undoubtedly more complex. Focusing only on economic inequality rather than economic density inequality, it is known that economic inequality can be narrowed in a variety of ways, including neoclassical convergence, technological convergence, New Economic Geography convergence, and convergence induced by policy (Geppert and Stephan, 2008). However, we are unable to determine whether and to what extent the reduction in spatial inequality was achieved through these ways. Besides, economic density cannot be viewed as a simple ratio of economic development to land expansion. This is because these two activities are not independent as land is still a factor in the neoclassical production functions in developing countries, although it has dropped out in developed countries (Wei et al., 2017). Excessive land supply may have negative impacts on ULED, which is evident in China’s industrial land supply (Huang and Du, 2017). To attract investment and promote the local economy, the price of industrial land is usually very low, resulting in the low utilization efficiency of industrial land. However, the situation for commercial and residential land is the exact opposite of that for industrial land in China.
After discussing economic density, then followed by the ULPD. Population flow can reflect the attractiveness of a city and there have been some studies focusing on the rural-to-urban population flow (Zhu et al., 2020). Unlike land with a fixed location, the population in China is restricted by the household registration system (Chan, 2010), it can move across borders relatively. Similar to economic density, population density cannot be viewed as a simple ratio of population flow to land expansion as well. It is the influx of people that makes urban land continue to expand. According to demographic data, the YRDUA is not only one of China’s population inflow areas, but also has a clear direction of population flow within it. Shanghai, the core city, is the city with the largest inflow population as well, and cities such as in Anhui have a large outflow population.

4.3 Trade-off between equality and efficiency under the core-periphery structure

As mentioned above, the core-periphery structure of urban agglomerations may generate negative effects (Fang and Yu, 2017). The first negative effect is that the disconnection may be caused between the cities in the core and periphery, then the migration of population, capital, and other elements to the core may be caused by the siphoning effect. However, for a region, even if it is not an urban agglomeration, spatial inequality is undoubtedly inevitable. As we all know, the trade-off between equality and efficiency is always a fundamental proposition. Just as the Chinese central government is committed to directing resources to Shanghai to achieve economies of scale, on the other hand, it expects the integrated development of urban agglomerations at the same time. Egalitarianism measures often lead to inefficiencies because the “leakage” induced by fraud, human error, and complex bureaucracy is inevitable (Mitchell et al., 1993). There is still no consensus on the functional form of the trade-off between equality and efficiency. However, it has been widely agreed that equality and efficiency are typically in conflict with each other. Therefore, for an urban agglomeration with the core-periphery structure, the increased equality may lead to a reduction in overall efficiency. For example, Shanghai is a city with constantly improving global influence, compared with other cities in the YRDUA, Shanghai’s urbanization has always been in a leading position. For Shanghai, land has become less important than other factors of production. Moreover, insufficient construction land indicators in Shanghai have forced the industry to undergo structural transformation. But other cities, especially cities in the periphery area, are still on the left half of the inverted U curve, their need for land remains urgent. Therefore, studies about the trade-off between equality and efficiency in urban agglomerations are necessary and can be conducted in future research.

4.4 Limitations and further research outlook

By applying a modified conditional β-convergence model, we have measured the dynamic changes in spatial inequality in the urban agglomeration under the core-periphery structure. The model in this study can also be applied to studies of spatial inequality in other urban agglomerations. However, it should be noted that attention should be paid when setting control variables when using the model. In this case study of the YRDUA, the control variable aimed to examine the presence or absence of a core-periphery structure from inter-provincial differences. Other case studies should also set control variables according to the actual situation of each urban agglomeration. As for further research, the priorities corresponding to current limitations are as follows: First, the driving mechanism of the dynamic changes in urban land spatial inequality has not been integrated into the model, where this study can serve as foundational work. Second, the core-periphery structure in this study was based on inter-provincial differences, and cities refer to prefecture-level cities. If districts/counties can be also used as statistical units in future research, the understanding of spatial inequality within urban agglomerations can be further deepened. Third, the concept of β-convergence in the model lacks consideration of spatial autocorrelation. Therefore, spatial econometric analysis can be incorporated into the modified model in future research.

5 Conclusions

The coordinated development of urban agglomerations, which are affected by urban land expansion significantly in most developing countries, has already attracted considerable attention. However, despite the existence of numerous studies measuring urban land expansion, studies focusing on urban land spatial inequality under a specific spatial structure have remained limited. To improve our current understanding of urban agglomeration spatial structure and the integration of urban agglomerations, the Yangtze River Delta Urban Agglomeration (YRDUA) of China was selected as the study area. A modified conditional β-convergence model has been applied to measure the dynamic changes in spatial inequality, and the existence of the core-periphery structure was verified by the coefficients of the control variable. The main findings from the case study in YRDUA indicate that from 2000 to 2020, the spatial inequality of urban land area had decreased, but the entire YRDUA had shown an obvious core-periphery structure from the perspective of inter-provincial differences. Compared with urban land area, the spatial inequality of urban land economic density and population density had decreased more rapidly, and the core-periphery structure was less obvious. The model constructed in this study can also be applied to other urban agglomerations. It can be argued that investigating spatial inequality through a suitable spatial structure can help to better understand the coordinated development of urban agglomerations. Besides, this study can also serve as foundational work for future research on the driving mechanism of the dynamic changes in urban land spatial inequality.

Declaration of interest

The authors declare no conflict of interest.
[1]
Barro R J, 1991. Economic growth in a cross section of countries. The Quarterly Journal of Economics, 106(2): 407-443.

DOI

[2]
Barro R J, Sala-i-Martin X, 1992. Convergence. Journal of Political Economy, 100(2): 223-251.

DOI

[3]
Cao S, Hu D, Hu Z et al., 2018. Comparison of spatial structures of urban agglomerations between the Beijing-Tianjin-Hebei and Boswash based on the subpixel-level impervious surface coverage product. Journal of Geographical Sciences, 28(3): 306-322.

DOI

[4]
Chan K W, 2010. The household registration system and migrant labor in China: Notes on a debate. Population and Development Review, 36(2): 357-364.

DOI PMID

[5]
Chen J, Cao X, Peng S et al., 2017. Analysis and applications of GlobeLand30: A review. ISPRS International Journal of Geo-Information, 6(8): 230.

DOI

[6]
Chen J, Chen J, Liao A et al., 2015. Global land cover mapping at 30 m resolution: A POK-based operational approach. ISPRS Journal of Photogrammetry and Remote Sensing, 103: 7-27.

DOI

[7]
Colsaet A, Laurans Y, Levrel H, 2018. What drives land take and urban land expansion? A systematic review. Land Use Policy, 79: 339-349.

DOI

[8]
Cui X, Li S, Wang X et al., 2019. Driving factors of urban land growth in Guangzhou and its implications for sustainable development. Frontiers of Earth Science, 13(3): 464-477.

DOI

[9]
Elliott J R, 1997. Cycles within the system: metropolitanisation and internal migration in the US, 1965-90. Urban Studies, 34(1): 21-41.

[10]
Fang C, 2019. The basic law of the formation and expansion in urban agglomerations. Journal of Geographical Sciences, 29(10): 1699-1712.

DOI

[11]
Fang C, Yu D, 2017. Urban agglomeration: An evolving concept of an emerging phenomenon. Landscape and Urban Planning, 162: 126-136.

DOI

[12]
Fang C, Yu X, Zhang X et al., 2020. Big data analysis on the spatial networks of urban agglomeration. Cities, 102: 102735.

DOI

[13]
Friedmann J, 1966. Regional Development Policy. Boston: MIT Press.

[14]
Fu Y, Zhang X, 2020. Mega urban agglomeration in the transformation era: Evolving theories, research typologies and governance. Cities, 105: 102813.

DOI

[15]
Geppert K, Stephan A, 2008. Regional disparities in the European Union: Convergence and agglomeration. Papers in Regional Science, 87(2): 193-217.

DOI

[16]
Huang Z, X Du, 2017. Strategic interaction in local governments’ industrial land supply: Evidence from China. Urban Studies, 54(6): 1328-1346.

DOI

[17]
Krugman P, 1996. The Self-Organizing Economy. Oxford: Blackwell.

[18]
Li J, Huang X, Yang H et al, 2017. Convergence of carbon intensity in the Yangtze River Delta, China. Habitat International, 60: 58-68.

DOI PMID

[19]
Li L, Ma S, Zheng Y et al., 2022. Integrated regional development: Comparison of urban agglomeration policies in China. Land Use Policy, 114: 105939.

DOI

[20]
Li Y, Liu X, 2018. How did urban polycentricity and dispersion affect economic productivity? A case study of 306 Chinese cities. Landscape and Urban Planning, 173: 51-59.

DOI

[21]
Liu X, Li X, Chen Y et al., 2010. A new landscape index for quantifying urban expansion using multi-temporal remotely sensed data. Landscape Ecology, 25(5): 671-682.

DOI

[22]
Liu Y, Zhang X, Pan X et al., 2020. The spatial integration and coordinated industrial development of urban agglomerations in the Yangtze River Economic Belt, China. Cities, 104: 102801.

DOI

[23]
Liu Y, Zhang Z, Zhou Y, 2018. Efficiency of construction land allocation in China: An econometric analysis of panel data. Land Use Policy, 74: 261-272.

DOI

[24]
Long Y, Zhai W, Shen Y et al., 2018. Understanding uneven urban expansion with natural cities using open data. Landscape and Urban Planning, 177: 281-293.

DOI

[25]
Luo J, Xing X, Wu Y et al., 2018. Spatio-temporal analysis on built-up land expansion and population growth in the Yangtze River Delta Region, China: From a coordination perspective. Applied Geography, 96: 98-108.

DOI

[26]
McFarlane C, 2015. The geographies of urban density: Topology, politics and the city. Progress in Human Geography, 40(5): 629-648.

DOI

[27]
Meng Y, Zhang F, An P et al., 2008. Industrial land-use efficiency and planning in Shunyi, Beijing. Landscape and Urban Planning, 85(1): 40-48.

DOI

[28]
Mitchell G, Tetlock P E, Mellers B A et al., 1993. Judgments of social justice: Compromises between equality and efficiency. Journal of Personality and Social Psychology, 65(4): 629.

DOI

[29]
Mohammadi H, Ram R, 2012. Cross-country convergence in energy and electricity consumption, 1971-2007. Energy Economics, 34(6): 1882-1887.

DOI

[30]
Petrakos G, Rodriguez-Pose A, Rovolis A, 2005. Growth, integration, and regional disparities in the European Union. Environment and Planning A, 37(10): 1837-1855.

DOI

[31]
Ross C L, Woo M, 2011. Megaregions and mobility. Bridge, 41(1): 24-34.

[32]
Rossi-Hansberg E, Wright M L, 2007. Urban structure and growth. The Review of Economic Studies, 74(2): 597-624.

DOI

[33]
Salomons E M, Berghauser Pont M, 2012. Urban traffic noise and the relation to urban density, form, and traffic elasticity. Landscape and Urban Planning, 108(1): 2-16.

DOI

[34]
Seto K C, 2011. Exploring the dynamics of migration to mega-delta cities in Asia and Africa: Contemporary drivers and future scenarios. Global Environmental Change, 21: S94-S107.

DOI

[35]
Song W, Pijanowski B C, 2014. The effects of China’s cultivated land balance program on potential land productivity at a national scale. Applied Geography, 46: 158-170.

DOI

[36]
Su S, Liu Z, Xu Y et al., 2017. China’s megaregion policy: Performance evaluation framework, empirical findings and implications for spatial polycentric governance. Land Use Policy, 63: 1-19.

DOI

[37]
Sun Y, Zhao S, 2018. Spatiotemporal dynamics of urban expansion in 13 cities across the Jing-Jin-Ji urban agglomeration from 1978 to 2015. Ecological Indicators, 87: 302-313.

DOI

[38]
Wang C, Liu H, Zhang M, 2016. The influence of administrative boundary on the spatial expansion of urban land: A case study of Beijing-Tianjin-Hebei urban agglomeration. Geographical Research, 35(1): 173-183. (in Chinese)

[39]
Wang H, He Q, Liu X et al., 2012. Global urbanization research from 1991 to 2009: A systematic research review. Landscape and Urban Planning, 104(3/4): 299-309.

DOI

[40]
Wang H, Wu Y, Deng Y et al., 2022. Model construction of urban agglomeration expansion simulation considering urban flow and hierarchical characteristics. Journal of Geographical Sciences, 32(3): 499-516.

DOI

[41]
Wei Y D, Ewing R, 2018. Urban expansion, sprawl and inequality. Landscape and Urban Planning, 177: 259-265.

DOI

[42]
Wei Y D, Li H, Yue W, 2017. Urban land expansion and regional inequality in transitional China. Landscape and Urban Planning, 163: 17-31.

DOI

[43]
Wei Y D, Ye X, 2014. Urbanization, urban land expansion and environmental change in China. Stochastic Environmental Research and Risk Assessment, 28(4): 757-765.

DOI

[44]
Wu C, Wei Y D, Huang X et al., 2017. Economic transition, spatial development and urban land use efficiency in the Yangtze River Delta, China. Habitat International, 63: 67-78.

DOI

[45]
Wu H, Lin A, Xing X et al., 2021. Identifying core driving factors of urban land use change from global land cover products and POI data using the random forest method. International Journal of Applied Earth Observation and Geoinformation, 103: 102475.

DOI

[46]
Xu G, Jiao L, Yuan M et al., 2019. How does urban population density decline over time? An exponential model for Chinese cities with international comparisons. Landscape and Urban Planning, 183: 59-67.

DOI

[47]
Xu X, Min X, 2013. Quantifying spatiotemporal patterns of urban expansion in China using remote sensing data. Cities, 35: 104-113.

DOI

[48]
Ye C, Zhu J, Li S et al., 2019. Assessment and analysis of regional economic collaborative development within an urban agglomeration: Yangtze River Delta as a case study. Habitat International, 83: 20-29.

DOI

[49]
Yu J, Zhou K, Yang S, 2019. Land use efficiency and influencing factors of urban agglomerations in China. Land Use Policy, 88: 104143.

DOI

[50]
Yu X, Wu Z, Zheng H et al., 2020. How urban agglomeration improve the emission efficiency? A spatial econometric analysis of the Yangtze River Delta urban agglomeration in China. Journal of Environmental Management, 260: 110061.

DOI

[51]
Yuan F, Wei Y D, Xiao W, 2019. Land marketization, fiscal decentralization, and the dynamics of urban land prices in transitional China. Land Use Policy, 89: 104208.

DOI

[52]
Zhang D, Liu X, Wu X et al., 2019. Multiple intra-urban land use simulations and driving factors analysis: A case study in Huicheng, China. GIScience & Remote Sensing, 56(2): 282-308.

[53]
Zhang P, Zhao Y, Zhu X et al., 2020. Spatial structure of urban agglomeration under the impact of high-speed railway construction: Based on the social network analysis. Sustainable Cities and Society, 62: 102404.

DOI

[54]
Zhao S, Zhou D, Zhu C et al., 2015. Spatial and temporal dimensions of urban expansion in China. Environmental Science & Technology, 49(16): 9600-9609.

DOI

[55]
Zheng S, Du R, 2020. How does urban agglomeration integration promote entrepreneurship in China? Evidence from regional human capital spillovers and market integration. Cities, 97: 102529.

DOI

[56]
Zhu C, Zhang X, Wang K et al., 2020. Urban-rural construction land transition and its coupling relationship with population flow in China’s urban agglomeration region. Cities, 101: 102701.

DOI

[57]
Zhu X, Wang Q, Zhang P et al., 2021. Optimizing the spatial structure of urban agglomeration: Based on social network analysis. Quality & Quantity, 55(2): 683-705.

Outlines

/