
Journal of Geographical Sciences >
Utilization effect of water-land resources under the evolution of Chinese dietary patterns
|
Zhu Yuanyuan (1985-), PhD and Associate Professor, specialized in regional development and urban-rural planning. E-mail: zhuyy990@126.com |
Received date: 2022-04-09
Accepted date: 2022-12-23
Online published: 2023-05-11
Supported by
National Natural Science Foundation of China(42171230)
National Natural Science Foundation of China(42071170)
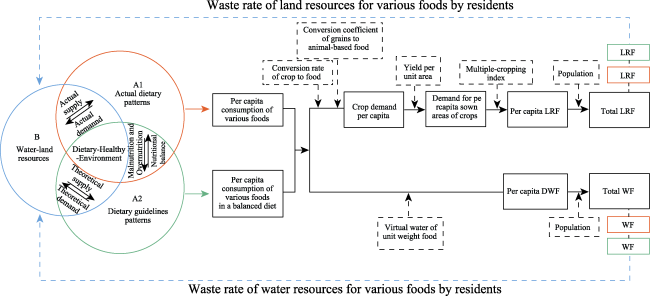
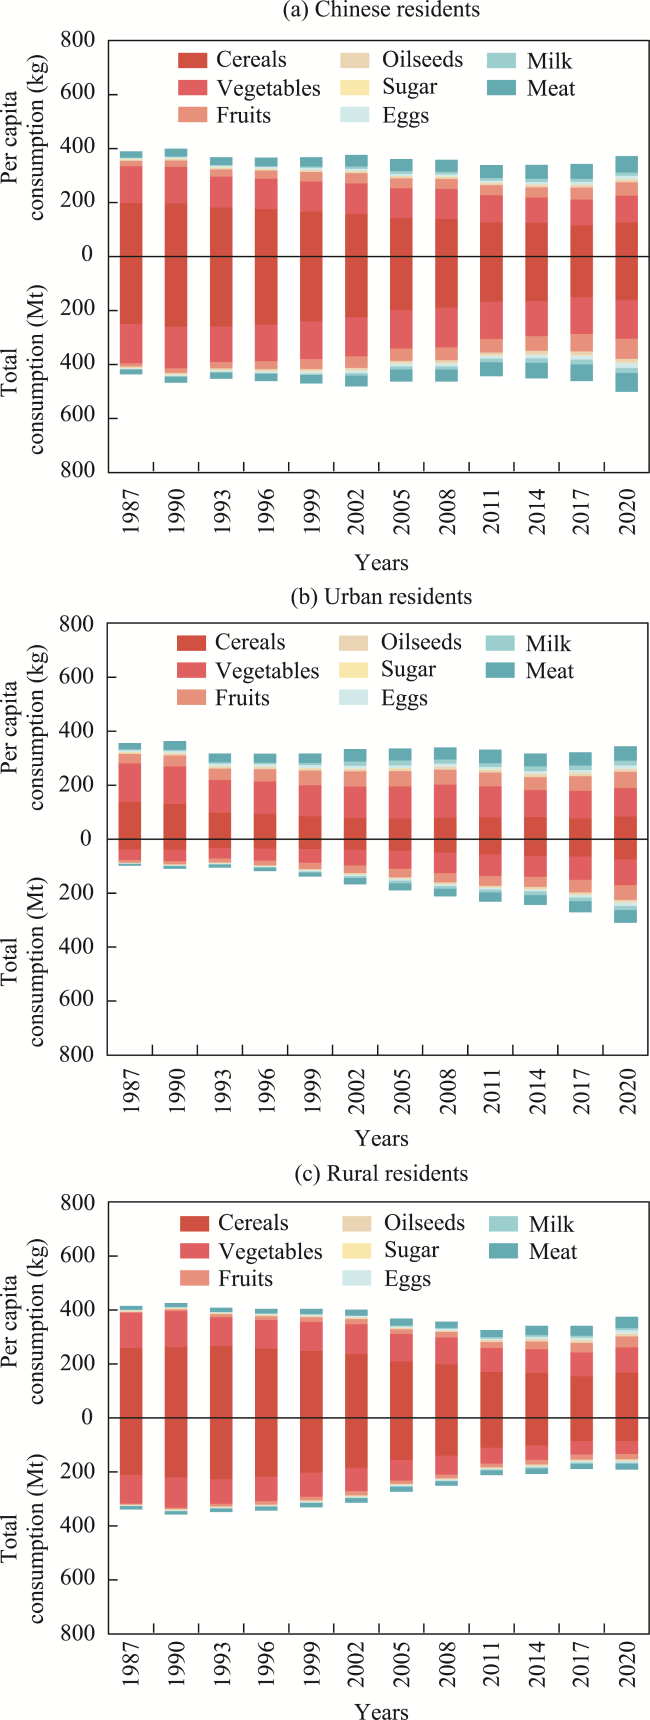
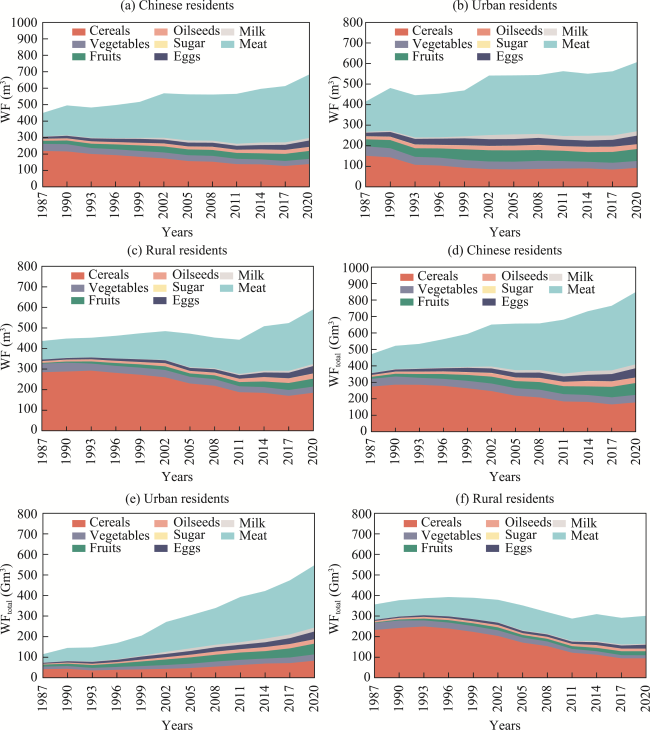
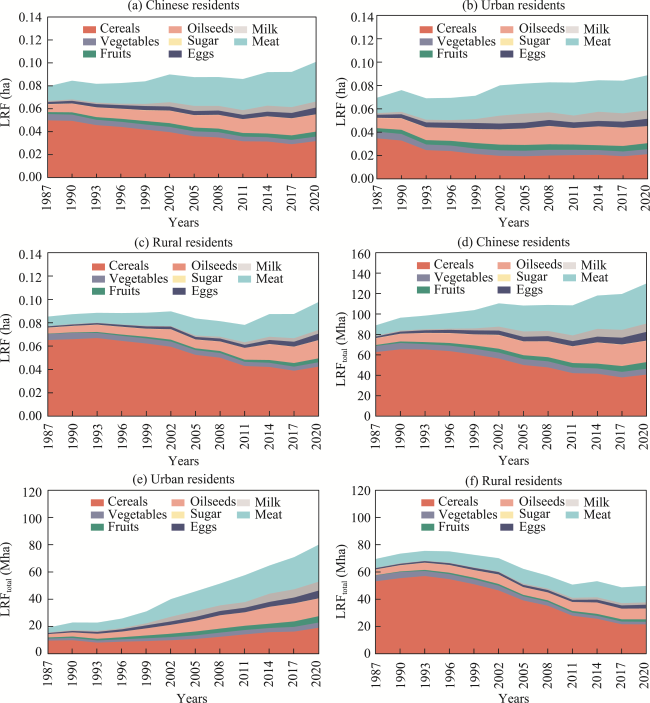
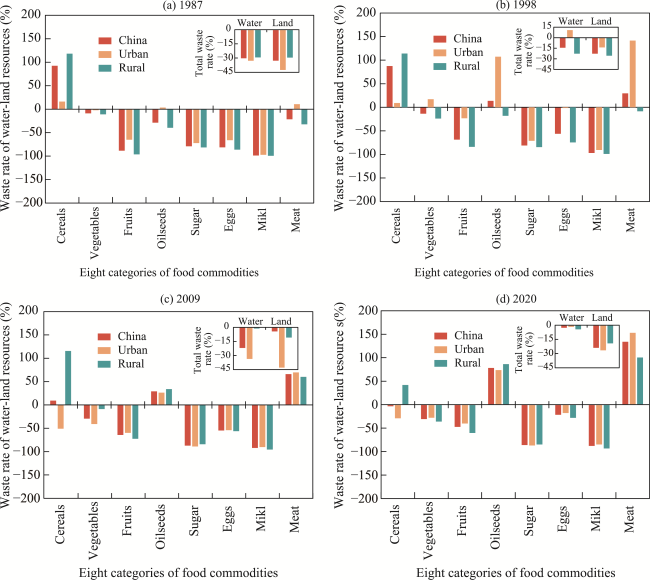
Exploring the utilization effect of water-land resources under the evolution of dietary patterns is of great significance in achieving sustainable global food consumption and the effective allocation of national resources. Our selected study area was China, a country with rapidly changing dietary consumption patterns, and the research period was between 1987 and 2020. Based on the material called Chinese Dietary Guidelines 2021, this study introduced the “virtual water” and the “virtual land” to quantify the utilization effect of water-land resources under the evolution of Chinese dietary patterns. Results showed that the dietary patterns gradually changed from “cereal-vegetable-based consumption” to “diversified consumption”. Food consumption’s total water footprint (WF) increased from 471.1 Gm3 in 1987 to 848.8 Gm3 in 2020, with a growth rate of 80.2%. Moreover, the total land requirement for food (LRF) increased from 88.8 Mha in 1987 to 129.9 Mha in 2020, with a growth rate of 46.3%. Furthermore, the meat consumption was the major contributor to the increase in total WF (104.0%) and LRF (102.1%). In contrast to the balanced diet pattern, there was no waste of water-land resources consumption for the food consumption of urban-rural residents in China between 1987 and 2020. However, the consumption of water resources would gradually approach the resource cost under the balanced diet patterns. It would eventually break through the critical value and reach the state of resource waste. In addition, the findings showed that urban residents’ waste rate of water-land resources for meat consumption increased by 142.3% compared with that in 1987. The research results can provide scientific guidance for resolving the food crisis under the supply of water-land resources in China and have an essential reference for national food security and sustainable development of resources and environment.
ZHU Yuanyuan , WANG Ziwei , ZHU Xiaohua . Utilization effect of water-land resources under the evolution of Chinese dietary patterns[J]. Journal of Geographical Sciences, 2023 , 33(4) : 741 -759 . DOI: 10.1007/s11442-023-2104-z
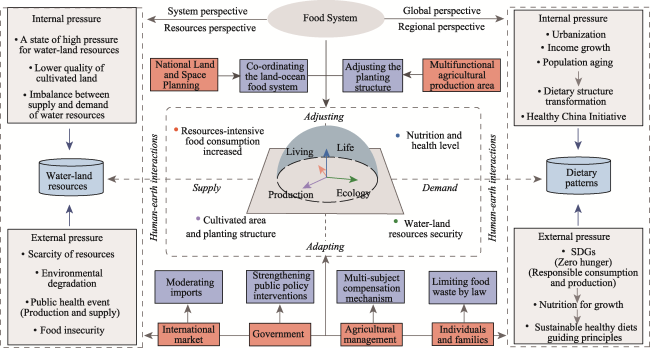
Figure 1 Research framework of water-land resource utilization effect under the evolution of dietary patterns |
Table 1 The conversion rate of various categories crop to corresponding food (%) |
| Years | Cereal crops | Vegetable crops | Fruits | Oilseed crops | Sugar crops |
|---|---|---|---|---|---|
| 2000 | 59.6 | Transportation loss 20% | Transportation loss 10 % | 21.0 | 12.5 |
| 2010 | 75.8 | 30.6 | 14.5 | ||
| 2020 | 89.7 | 38.4 | 18.0 | ||
| Average | 75.0 | 80.0 | 90.0 | 30.0 | 15.0 |
| Food | Cereals | Vegetables | Fruits | Oilseeds | Sugar |
Note: Given the large difference in the loss coefficient of each vegetable and fruit, and the difficulty of obtaining parameters, this study set the average loss coefficient of fruits in the entire food supply chain as 10% according to the characteristics of vegetable and fruit loss, taking into account that the loss of vegetables was greater than that of fruits, the average loss factor of vegetables in the entire food supply chain was set at 20%. |
Table 2 The conversion coefficient of grains to animal-based food |
| Categories of animal-based foods | Pork | Beef and mutton | Poultry | Eggs | Milk |
|---|---|---|---|---|---|
| Grain consumption conversion coefficient | 3.3 | 2.6 | 2.1 | 2.5 | 2.3 |
Table 3 Virtual water content per unit weight food (m3/kg) |
| Categories | Virtual water content per unit weight food | Categories | Virtual water content per unit weight food |
|---|---|---|---|
| Cereals | 1.10 | Pork | 6.1 |
| Vegetables | 0.32 | Beef and mutton | 10.9 |
| Fruits | 0.97 | Poultry | 3.97 |
| Oilseeds | 2.36 | Eggs | 3.09 |
| Sugar | 0.69 | Meat | 1.28 |
Table 4 Chinese Dietary Guidelines (2021) |
| Categories | Min (g/day) | Max (g/day) | Average (g/day) | Categories | Min (g/day) | Max (g/day) | Average (g/day) |
|---|---|---|---|---|---|---|---|
| Cereals | 250 | 400 | 325 | Sugar | 0 | 50 | 25 |
| Vegetables | 300 | 500 | 400 | Eggs | 40 | 50 | 45 |
| Fruits | 200 | 350 | 275 | Milk | 300 | 300 | 300 |
| Oilseeds | 0 | 30 | 15 | Meat | 40 | 75 | 57.5 |
Note: The Chinese Dietary Guidelines stipulates that Oilseeds and Sugar were not higher than 30 g/day and 50 g/day, respectively, so the min was set to 0. For the convenience of calculation, the average value was selected in this study when calculating the intake of various foods under the balanced diet. |
Figure 2 Evolutionary characteristics of Chinese dietary patterns |
Figure 3 Changes in water demand under the evolution of residents’ dietary patterns |
Figure 4 Changes in land demand under the evolution of residents’ dietary patterns |
Table 5 The consumption of water-land resources by the actual consumption of various foods and the balanced diet patterns of residents from 1987 to 2020 |
| Regions | China | Urban | Rural | ||||||||||
|---|---|---|---|---|---|---|---|---|---|---|---|---|---|
| Resources | Conditions | Actual consumption | In a balanced diet | Actual consumption | In a balanced diet | Actual consumption | In a balanced diet | Actual consumption | In a balanced diet | Actual consumption | In a balanced diet | Actual consumption | In a balanced diet |
| Categories | 1987 | 1987 | 2020 | 2020 | 1987 | 1987 | 2020 | 2020 | 1987 | 1987 | 2020 | 2020 | |
| Water (Gm3) | Cereals | 274.5 | 142.6 | 178.0 | 184.3 | 42.0 | 36.1 | 83.5 | 117.7 | 232.6 | 106.5 | 94.5 | 66.5 |
| Vegetables | 46.6 | 51.1 | 45.7 | 66.0 | 12.6 | 12.9 | 30.4 | 42.2 | 34.0 | 38.1 | 15.3 | 23.8 | |
| Fruits | 12.3 | 106.4 | 72.3 | 137.5 | 9.4 | 26.9 | 52.6 | 87.8 | 2.9 | 79.5 | 19.7 | 49.6 | |
| Oilseeds | 10.1 | 14.1 | 32.5 | 18.2 | 3.7 | 3.6 | 20.2 | 11.7 | 6.4 | 10.5 | 12.3 | 6.6 | |
| Sugar | 1.4 | 6.9 | 1.2 | 8.9 | 0.5 | 1.7 | 0.7 | 5.7 | 1.0 | 5.1 | 0.5 | 3.2 | |
| Eggs | 10.4 | 55.5 | 56.2 | 71.7 | 4.8 | 14.0 | 37.6 | 45.8 | 5.7 | 41.4 | 18.6 | 25.9 | |
| Milk | 1.9 | 153.2 | 24.1 | 197.9 | 1.1 | 38.8 | 19.3 | 126.5 | 0.7 | 114.4 | 4.8 | 71.5 | |
| Meat | 114.0 | 145.1 | 438.7 | 187.4 | 40.7 | 36.7 | 303.0 | 119.7 | 73.4 | 108.3 | 135.8 | 67.7 | |
| Total | 471.2 | 674.9 | 848.8 | 871.9 | 114.7 | 170.9 | 547.4 | 557.0 | 356.4 | 504.0 | 301.4 | 314.8 | |
| Land (Mha) | Cereals | 62.8 | 32.6 | 40.7 | 42.1 | 9.6 | 8.3 | 19.1 | 26.9 | 53.2 | 24.3 | 21.6 | 15.2 |
| Vegetables | 5.8 | 6.4 | 5.7 | 8.3 | 1.6 | 1.6 | 3.8 | 5.3 | 4.3 | 4.8 | 1.9 | 3.0 | |
| Fruits | 1.1 | 9.6 | 6.5 | 12.3 | 0.8 | 2.4 | 4.7 | 7.9 | 0.3 | 7.1 | 1.8 | 4.5 | |
| Oilseeds | 6.4 | 9.0 | 20.8 | 11.7 | 2.4 | 2.3 | 12.9 | 7.5 | 4.1 | 6.7 | 7.9 | 4.2 | |
| Sugar | 0.2 | 1.2 | 0.2 | 1.5 | 0.1 | 0.3 | 0.1 | 1.0 | 0.2 | 0.9 | 0.1 | 0.6 | |
| Eggs | 1.6 | 8.5 | 8.6 | 10.9 | 0.7 | 2.1 | 5.7 | 7.0 | 0.9 | 6.3 | 2.8 | 3.9 | |
| Milk | 0.6 | 51.9 | 8.2 | 67.1 | 0.4 | 13.1 | 6.5 | 42.8 | 0.2 | 38.8 | 1.6 | 24.2 | |
| Meat | 10.2 | 13.0 | 39.2 | 16.8 | 3.6 | 3.3 | 27.1 | 10.7 | 6.6 | 9.7 | 12.1 | 6.1 | |
| Total | 88.8 | 132.1 | 129.9 | 170.7 | 19.2 | 33.5 | 80.1 | 109.1 | 69.6 | 98.7 | 49.8 | 61.6 | |
Figure 5 Waste rate of water-land resources for various foods by residents from 1987 to 2020Note: The waste rate/saving rate of water resources and land resources consumed in all categories of food were completely consistent. Thus, this study combined the two when discussing the resource consumption of all categories of food. |
Figure 6 Optimization path of dietary patterns and water-land resources use based on the “Production- Living-Ecological-Life” space |
| [1] |
AASSA, 2018. Opportunities and challenges for research on food and nutrition security and agriculture in Asia. https://www.interacademies.org/project/food-and-nutrition-security-and-agriculture.
|
| [2] |
|
| [3] |
|
| [4] |
|
| [5] |
Chinese Nutrition Society(CNS), 2021. Scientific research report on Chinese Dietary Guidelines (2021). http://dg.cnsoc.org/article/04/t8jgjBCmQnW8uscC_OLLfA.html.
|
| [6] |
|
| [7] |
|
| [8] |
FAO, 2012. World agriculture towards 2030/2050: The 2012 revision. http://www.fao.org/economic/esa/esag/en/.
|
| [9] |
FAO, IFAD, UNICEF et al., 2021. The state of food security and nutrition in the world 2021. https://www.fao.org/publications/sofi/2021/en/.
|
| [10] |
FAO, WHO, 2014. Second international conference on nutrition better nutrition better lives (ICN2). https://www.fao.org/about/meetings/icn2/background/en/.
|
| [11] |
|
| [12] |
|
| [13] |
|
| [14] |
|
| [15] |
|
| [16] |
HLPE, 2020. Food security and nutrition: Building a global narrative towards 2030. https://www.fao.org/cfs/cfs-hlpe/zh/.
|
| [17] |
|
| [18] |
|
| [19] |
|
| [20] |
|
| [21] |
|
| [22] |
|
| [23] |
|
| [24] |
|
| [25] |
|
| [26] |
Penning de Vries F W T,
|
| [27] |
|
| [28] |
Prices for the National Development and Reform Commission (PNDRC), 2020. Compilation of National Agricultural Products Cost-benefit Information. Beijing: China Statistics Press. (in Chinese)
|
| [29] |
|
| [30] |
|
| [31] |
|
| [32] |
|
| [33] |
|
| [34] |
|
| [35] |
|
| [36] |
UNESCO, 2018. The United Nations World Water Development Report 2018. https://www.unwater.org/publications/world-water-development-report-2018/.
|
| [37] |
UNESCO, 2021. The United Nations World Water Development Report 2021. https://unesdoc.unesco.org/ark:/48223/pf0000375750_chi/PDF/375750chi.pdf.multi.
|
| [38] |
|
| [39] |
|
| [40] |
WHO, 2017. Work Programme of the United Nations Decade of Action on Nutrition (2016-2025). https://apps.who.int/nutrition/decade-of-action/workprogramme-2016to2025/en/index.html.
|
| [41] |
|
| [42] |
|
| [43] |
|
| [44] |
|
| [45] |
|
| [46] |
|
| [47] |
|
/
| 〈 |
|
〉 |