
Journal of Geographical Sciences >
Spatial pattern of global submarine cable network and identification of strategic pivot and strategic channel
|
Xie Yongshun (1994-), PhD, specialized in transportation geography and regional development. E-mail: ysxiee@163.com |
Received date: 2022-12-23
Accepted date: 2023-01-30
Online published: 2023-05-11
Supported by
National Natural Science Foundation of China(42071151)
Strategic Priority Research Program of the Chinese Academy of Sciences(XDA20010101)
As a kind of large-scale connectivity infrastructure, submarine cables play a vital role in international telecommunication, socio-economic development and national defense security. However, the current understanding about the spatial pattern of global submarine cable network is relatively limited. In this article, we analyze the spatial distribution and connectivity pattern of global submarine cables, and identify their strategic pivots and strategic channels. The main conclusions are as follows: (1) The spatial distribution of global submarine cables is significantly unbalanced, which is characterized by the facts that the distribution of submarine cable lines is similar to that of sea lanes, and the agglomerations of landing stations are distributed unevenly along the coastline. (2) The connectivity pattern of global submarine cable network has a significant scale effect. At the micro, meso and macro scales, the connectivity structure presents chain model, cluster model and hub-and-spoke model, respectively. (3) The distribution of strategic pivots and strategic channels shows a pyramidal hierarchical feature. Singapore ranks highest among all the strategic pivots, while the Gulf of Aden and the Strait of Malacca rank highest among the strategic channels. Based on the identification of strategic pivots and channels, six strategic regions have been divided, which face various network security risks and need special attention and vigilance.
XIE Yongshun , WANG Chengjin . Spatial pattern of global submarine cable network and identification of strategic pivot and strategic channel[J]. Journal of Geographical Sciences, 2023 , 33(4) : 719 -740 . DOI: 10.1007/s11442-023-2103-0
Figure 1 Construction framework of global submarine cable network |
 indicate the landing station of the submarine cable system), particularly since the connection between submarine cable systems is realized through the same landing node. The third step involves integrating all single submarine cable systems and building all submarine cable connection matrix (A). Finally, the global submarine cable network is constructed based on the needs of different scales. Here, E represents the edge in the network, V represents the node in the network. In the micro, meso and macro scales, the nodes are information ports (P), countries or regions (C) and regions (R), respectively.
Figure 2 Division of global marine areas |
Figure 3 Density distribution of landing stations in 2020 |
Figure 4 Density distribution of global submarine cables in 2020 |
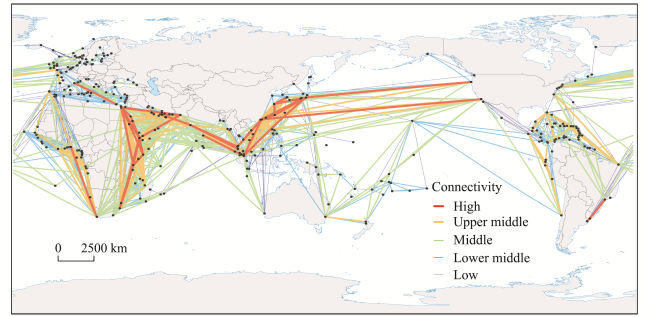
Figure 5 The connectivity of global submarine cable network between information ports |
Figure 6 The connectivity index of information ports |
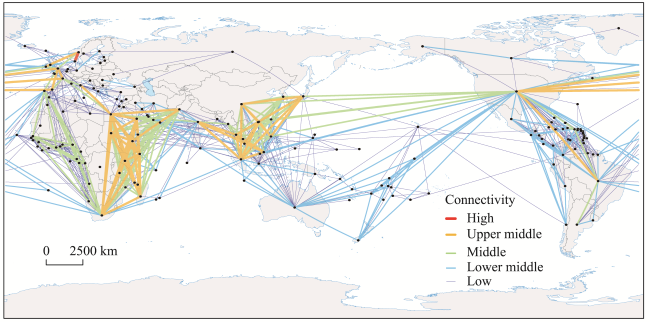
Figure 7 The connectivity of global submarine cable network between countries or regions |
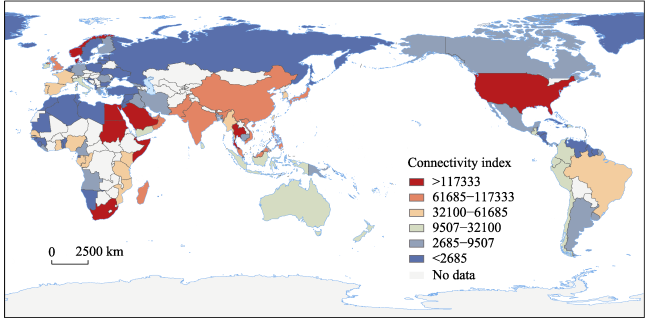
Figure 8 The connectivity index of countries or regions |
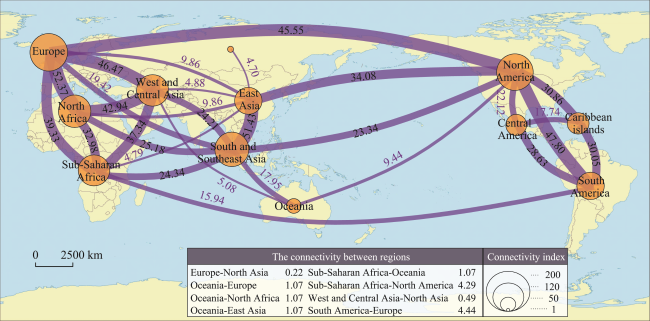
Figure 9 The connectivity of global submarine cable network between regions and the connectivity index of regions |
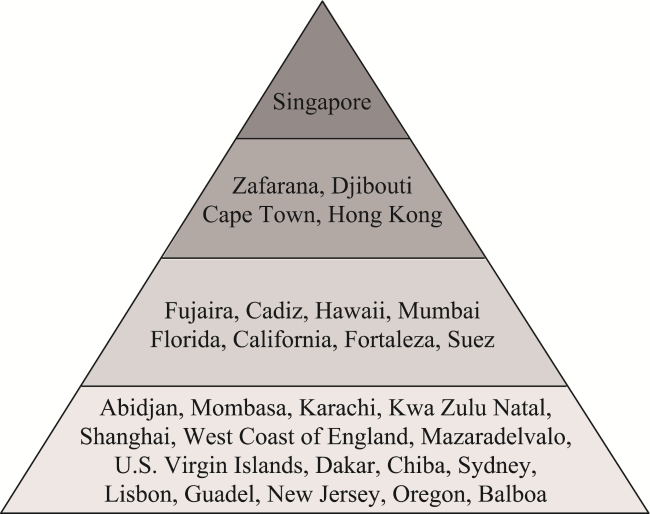
Figure 10 Hierarchical structure of strategic pivots of global submarine cable network |
Table 1 Hierarchical structure of strategic channels of global submarine cable network |
| Strategic channel level | No. | Sea area | L | E | D | ΔN | Average rate of change | |||
|---|---|---|---|---|---|---|---|---|---|---|
| Value | Rate | Value | Rate | Value | Rate | |||||
| Level 1 | 1 | Gulf of Aden | 4.680 | 0.063 | 0.018 | 0.143 | 6.183 | 0.137 | 0.034 | 0.377 |
| 2 | Strait of Malacca | 4.887 | 0.110 | 0.019 | 0.095 | 6.391 | 0.108 | 0.051 | 0.365 | |
| Level 2 | 3 | South China Sea | 4.612 | 0.048 | 0.019 | 0.095 | 6.295 | 0.121 | 0.040 | 0.304 |
| 4 | Red Sea | 4.589 | 0.043 | 0.019 | 0.095 | 6.308 | 0.119 | 0.037 | 0.295 | |
| 5 | Caribbean Sea | 4.597 | 0.045 | 0.019 | 0.095 | 6.419 | 0.104 | 0.040 | 0.284 | |
| Level 3 | 6 | Singapore Strait | 4.830 | 0.097 | 0.019 | 0.095 | 6.608 | 0.078 | 0.040 | 0.263 |
| 7 | Arabian Sea | 4.500 | 0.022 | 0.019 | 0.095 | 6.395 | 0.107 | 0.031 | 0.256 | |
| 8 | Gulf of Oman | 4.483 | 0.019 | 0.019 | 0.095 | 6.454 | 0.099 | 0.040 | 0.253 | |
| 9 | Mediterranean Sea- Eastern Basin | 4.583 | 0.041 | 0.020 | 0.048 | 6.452 | 0.099 | 0.057 | 0.245 | |
| 10 | Strait of Gibraltar | 4.824 | 0.096 | 0.020 | 0.048 | 6.901 | 0.037 | 0.026 | 0.206 | |
| Level 4 | 11 | South Pacific Ocean | 4.472 | 0.016 | 0.020 | 0.048 | 6.649 | 0.072 | 0.051 | 0.187 |
| 12 | Indian Ocean | 4.743 | 0.078 | 0.020 | 0.048 | 6.926 | 0.033 | 0.026 | 0.184 | |
| 13 | Celtic Sea | 4.642 | 0.055 | 0.020 | 0.048 | 6.810 | 0.049 | 0.031 | 0.183 | |
| 14 | North Atlantic Ocean | 4.606 | 0.047 | 0.020 | 0.048 | 6.805 | 0.050 | 0.031 | 0.176 | |
| 15 | Gulf of Suez | 4.557 | 0.035 | 0.020 | 0.048 | 6.706 | 0.064 | 0.029 | 0.175 | |
| 16 | North Pacific Ocean | 4.589 | 0.043 | 0.020 | 0.048 | 6.845 | 0.044 | 0.026 | 0.160 | |
| 17 | South Atlantic Ocean | 4.577 | 0.040 | 0.020 | 0.048 | 6.869 | 0.041 | 0.029 | 0.157 | |
| 18 | Philippine Sea | 4.495 | 0.021 | 0.021 | 0.000 | 6.904 | 0.036 | 0.026 | 0.083 | |
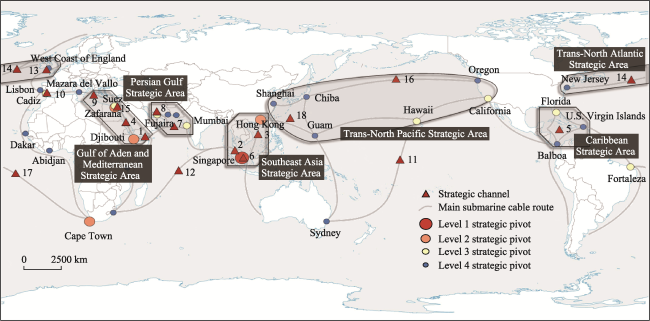
Figure 11 Strategic areas of global submarine cable network |
| [1] |
|
| [2] |
|
| [3] |
|
| [4] |
|
| [5] |
|
| [6] |
|
| [7] |
|
| [8] |
|
| [9] |
|
| [10] |
|
| [11] |
|
| [12] |
|
| [13] |
|
| [14] |
|
| [15] |
|
| [16] |
|
| [17] |
|
| [18] |
|
| [19] |
|
| [20] |
|
| [21] |
|
| [22] |
|
| [23] |
|
| [24] |
|
| [25] |
|
| [26] |
|
| [27] |
|
| [28] |
|
| [29] |
|
| [30] |
|
| [31] |
|
| [32] |
|
| [33] |
|
| [34] |
|
| [35] |
|
| [36] |
|
/
| 〈 |
|
〉 |


