Research Articles

Evaluating the hydrological effects of the Three Gorges Reservoir based on a large-scale coupled hydrological-hydrodynamic-dam operation model

  • ZENG Sidong , 1, 2 ,
  • LIU Xin 1, 2 ,
  • XIA Jun 1, 2, 3 ,
  • DU Hong , 4, * ,
  • CHEN Minghao 1, 2 ,
  • HUANG Renyong 5
Expand
  • 1. Chongqing Institute of Green and Intelligent Technology, CAS, Chongqing 400714, China
  • 2. Chongqing School, University of Chinese Academy of Sciences, Chongqing 400714, China
  • 3. State Key Laboratory of Water Resources and Hydropower Engineering Science, Wuhan University, Wuhan 430072, China
  • 4. College of Resources and Environmental Science, South-Central Minzu University, Wuhan 430074, China
  • 5. Yangtze River Scientific Research Institute, Wuhan 430010, China
*Du Hong (1988-), Lecturer, E-mail:

Zeng Sidong (1987-), Associate Professor, E-mail:

Received date: 2022-04-06

  Accepted date: 2022-12-01

  Online published: 2023-05-11

Supported by

Strategic Priority Research Program of the Chinese Academy of Sciences(XDA23040500)

Youth Innovation Promotion Association, CAS(2021385)

Central Guidance on Local Science and Technology Development Fund of Chongqing City(2021000069)

Abstract

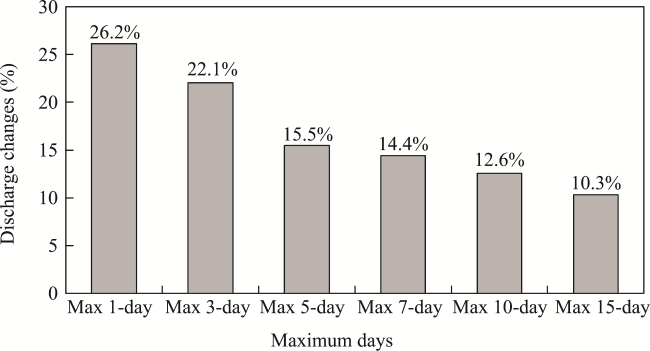
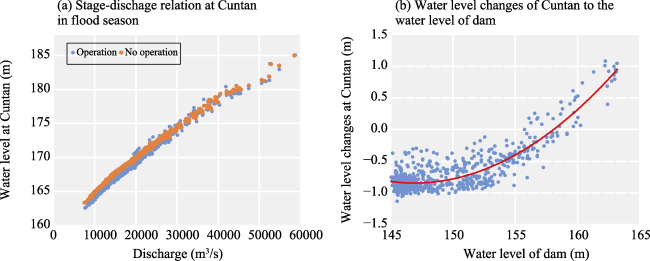
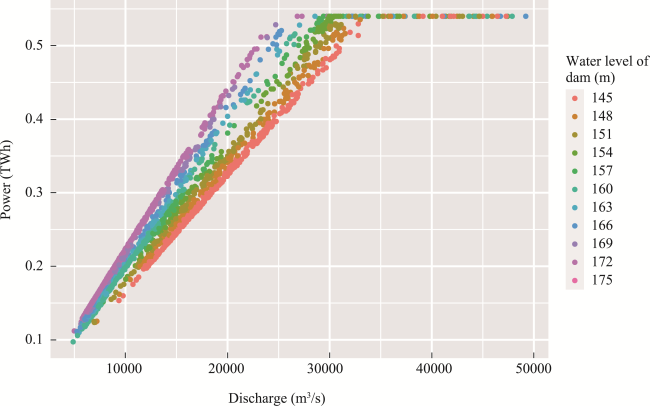
Understanding the hydrological effects of the Three Gorges Dam operation in the entire reservoir area is significant to achieving optimal dam regulation. In this paper, a large-scale coupled hydrological-hydrodynamic-dam operation model is developed to comprehensively evaluate the hydrological effects of the river-type Three Gorges Reservoir. The results show that the coupled model is effective for hydrological, hydrodynamic regime and hydropower simulations in the reservoir area. Dam operation could have a notable positive effect on flood control and could reduce the maximum daily flood peak by up to 26.2%. It also contributes a large amount of hydropower, approximately 94.27 TWh/year, and a water supply increase for the downstream area of up to 22% during the dry season. In the flood season, the water level at Cuntan would increase under the condition that the water level of the dam is higher than approximately 158 m due to dam operation. In the dry season, attention should be paid to the low flow velocity near the dam in the reservoir area.

Cite this article

ZENG Sidong , LIU Xin , XIA Jun , DU Hong , CHEN Minghao , HUANG Renyong . Evaluating the hydrological effects of the Three Gorges Reservoir based on a large-scale coupled hydrological-hydrodynamic-dam operation model[J]. Journal of Geographical Sciences, 2023 , 33(5) : 999 -1022 . DOI: 10.1007/s11442-023-2117-7

1 Introduction

The hydrological regimes of rivers have changed significantly in the past few decades due to disturbances caused by both natural and human factors globally, and these changes have been a research focus for a long time (Gedney et al., 2006; Zhang et al., 2011; Zhang et al., 2012; Yin et al., 2018; Wang et al., 2020). Dam operation is recognized as one of the most important factors altering basin-scale hydrological regimes (Guo et al., 2020; Huang et al., 2021). Currently, there are more than 60,000 large dams around the world, which directly affect many large river systems (Nilsson et al., 2005; Schmitt et al., 2019), and the global dam construction boom continues to influence river systems (Zarfl et al., 2015). The building and operation of hundreds of thousands of dams have significantly altered fluvial processes (Poff and Matthews, 2013), producing fluctuations in streamflow and affecting the spatiotemporal distribution of the discharge in the upper and lower reaches of the rivers within and between years (Botter et al., 2010). The effects of dam operation on the hydrological regime have received a great deal of attention from both scientists and governments.
Many previous studies have been conducted on the influences of dam operation on the downstream hydrological regime and water-related issues (Lai et al., 2014; Yang et al., 2014; Yang et al., 2017, 2018; Jiang et al., 2019; Chai et al., 2020; Dai et al., 2021; Mulatu et al., 2021). Dam operation can alter hydrological regime such as the timing of high and low flow periods, the peak discharge, and the downstream river water level (Mei et al., 2018). Although research on the effects of dams on rivers has increased, in addition to the effects on the downstream area, the effects on the upstream area should also be investigated (Liro, 2019; Volke et al., 2019). Dam operation raises the water level, affecting the flow velocity and discharge in the reservoir area and the river branches (Huang et al., 2019; Liro et al., 2020). In particular, most large river-type reservoirs have a long-distance backwater area, in which the hydrodynamic processes, dynamic capacity, and related sediment processes are significantly influenced by the dam operation, with significant regional differences (Han et al., 2020; Jing et al., 2020). The changing hydrological regime, such as the flow velocity in the reservoir area and the tributaries, is a controlling factor of the ecological water environment and sediment deposition (Li et al., 2020; Xiang et al., 2021). Thus, it is necessary to further investigate the effects of dam operation on the upstream hydrological regime in the reservoir area in addition to the downstream influences to provide a more holistic view of the effects of dams on rivers.
Physical-based models are a useful tool for investigating the effects of different influence factors on hydrological changes (Bittner et al., 2018; Gao and Ruan, 2018; Pandey et al., 2019). Hydrological models are commonly used to study the effects of climate change and human activities on catchment-scale hydrological changes (Zeng et al., 2014, 2022; Lyu et al., 2019; Chen et al., 2020). However, a hydrological model that ignores the dynamic processes generally cannot sufficiently capture the backwater and dynamic capacity in the reservoir area. Hydrodynamic models can describe the water flow in detail by numerically solving the dynamical equations in one or two dimensions, but this requires time-consuming simulation of the entire basin (Baracchini et al., 2020). Therefore, an ideal model for studying the hydrological effects of dam operation in the reservoir area would couple three modules, i.e., a hydrological model for simulating the inflow from the catchment into the reservoir area, a hydrodynamic model for simulating the hydrodynamic processes in the reservoir area, and a dam operation model for simulating the dam regulation scheme.
The Three Gorges Dam (TGD), known as the largest building and hydroelectric plant for water conservancy projects in the world, produces water impoundment of 145-175 m, which improves the efficiency of the water resource utilization and has a generating capacity of 22,500 megawatts. However, it also changes the natural streamflow (Su et al., 2020; Guo et al., 2021). That is, the mean reservoir outflow generally decreases in the impoundment stage and increases in the water supply stage, resulting in hydrological regime changes in the middle and lower reaches of the river. In addition, the influences always vary along the river during different seasons (Yuan et al., 2012; Zhang et al., 2012; Tian et al., 2019; Zhang et al., 2020). Subsequently, it has effects on the water quality, reservoir sedimentation, and downstream riverbed erosion and soil erosion (Xu et al., 2013; Wang et al., 2018; Huang et al., 2019; Li et al., 2020). Moreover, dam operation also affects the hydrological regime in the reservoir area. Several studies have reported the influences of the dam operation on the hydrological and water environment in the near-dam reservoir area, including variations in the hydrodynamic and water quality parameters, algal blooms, and dissolved organic matter (Yang et al., 2010; Wang et al., 2021). In general, the effects of the dam operation on the hydrological regime change throughout the entire Three Gorges Reservoir (TGR) area, and the effects of the operation of the TGD require clarification.
In this study, a new coupled model that integrates a distributed hydrological model, a hydrodynamic model, and a dam operation model was developed. Then, the model was applied to study the comprehensive effects of the operation of the TGD on the water level, flow velocity, discharge, and hydropower generation in the entire reservoir area, which is different from previous studies that only focused on the local area. The main aims of this study were (1) to establish a large-scale coupled model and to verify the model’s applicability to the TGR; (2) to investigate the effects of dam operation on the hydrological regime in the reservoir area during different operation stages; and (3) to evaluate the integrated effects on flood control, water supply, and hydropower generation.

2 Study area and data

2.1 Study area

The TGD is located at the outlet of the Upper Yangtze River Basin. The basin is situated in southwestern China, lying between 24°-36°N and 90°-112°E (Figure 1). It has a drainage area of 1.0 million km2, accounts for approximately 10% of China’s land area, and includes parts of nine provinces. The basin has a diverse topography, including the Qinghai-Tibet Plateau and the Sichuan Basin, and the elevation varies from 200 m to 6500 m (Qin et al., 2022). The average annual precipitation in the basin ranges between 723 mm and 1134 mm, and the average annual temperature ranges between 8.6°C and 16.8°C. The annual runoff is approximately 451 billion m3 and is concentrated during the flood season, from June to September (Liu et al., 2015).
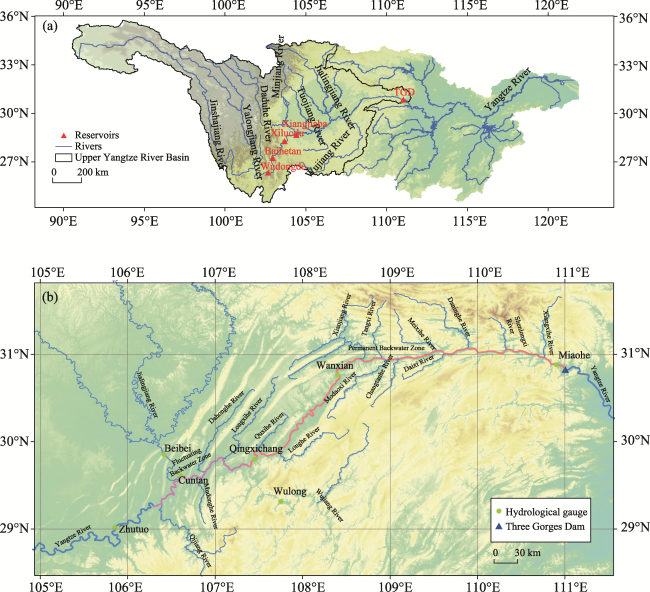
Figure 1 Location of the Upper Yangtze River Basin (a) and the Three Gorges Reservoir area (b)
The TGD was designed to seasonally draw down the water level from 175 m to 145 m before the flood peak period for flood control and then to raise the water level back to 175 m during the water impoundment period. When the water level reaches the designed normal water level of 175 m, the TGR covers a 760 km long channel from the upstream Zhutuo section to the dam, with a surface area of 1080 km2 and a storage capacity of 39.3 km3 (Tang et al., 2016). The TGR region is within the subtropical humid monsoon climate zone. The regional mean annual temperature and precipitation are 18.2°C and 1172 mm, respectively. The precipitation mainly occurs during the rainy season, from May to September. The TGR area receives water from the main reach of the upper Yangtze River in the upstream section (Zhutuo), as well as from tributaries, including the Jialingjiang, Wujiang, Qijiang, Mudonghe, Dahonghe, Longxihe, Quxihe, Longhe, Xiaojiang, Meixihe, Daninghe, Shenlongxi, Modaoxi, Changtanhe, Daixi, and Xiangxihe rivers.

2.2 Data

The data used in this study included topographic and underlying surface data, observed historical climate forcing data, and hydrological data. The topographic and underlying surface data included the 90 m Shuttle Radar Topography Mission (SRTM) digital elevation database (https://cgiarcsi.community/), homogenized soil data with a 1000 m resolution from the Food and Agriculture Organization of the United Nations (FAO) (http://webarchive.iiasa.ac.at/), and land use coverage data with a 1000 m resolution from the Resource and Environment Science and Data Center (https://www.resdc.cn/). These datasets were used to build a hydrological model of the Upper Yangtze River Basin. In addition, the underwater terrain data for the TGR area were used to establish a hydrodynamic model.
The observed climate forcing data, including the daily atmospheric pressure, precipitation, maximum and minimum temperature, wind speed, relative humidity, and sunshine duration from 180 meteorological stations from 1960 to 2018, were obtained from the China Meteorological Data Sharing Service System (http://data.cma.cn/) and were used to drive the hydrological model. The daily streamflow data from the Beibei, Zhutuo, and Wulong gauges from 1960 to 2018 were obtained from the Hydrological Bureau of the Ministry of Water Resources and the Changjiang Water Resources Commission, China, and were employed to calibrate the hydrological model. The discharge data and water level data from the Cuntan, Qingxichang, Wanxian, and Miaohe gauges along the TGR area were applied to calibrate the hydrodynamic model.

3 Methodology

3.1 Model framework

The coupled model contains three main modules: a hydrological module, a hydrodynamic module, and a dam operation module. The architecture of the coupled model is shown in Figure 2. The Distributed Time-Variant Gain model (DTVGM) was used to simulate the hydrological processes in the catchment. The one-dimensional Saint-Venant equations were numerically solved to simulate the hydrodynamic processes in the reservoir area. The dam operation model was employed to simulate the operation of and water release from the reservoir and the hydropower generation. The coupled model was solved using several steps (Figure 3). First, the hydrological model (DTVGM) was run in the catchment to simulate the hydrological processes, and then, the inflow from the river section to the reservoir area was obtained. Second, the simulated discharge at the outlets of the tributaries, the interval runoff into the reservoir area, and the initial water level (Z) in front of the dam were used to drive the dam operation and hydrodynamic model in order to simulate the hydrodynamic processes in the reservoir area. Then, the water level and streamflow in the reservoir area were calculated. The initial Z value at the new time step was determined by the values for the previous time step, while the initial Z value at time step 0 was input.
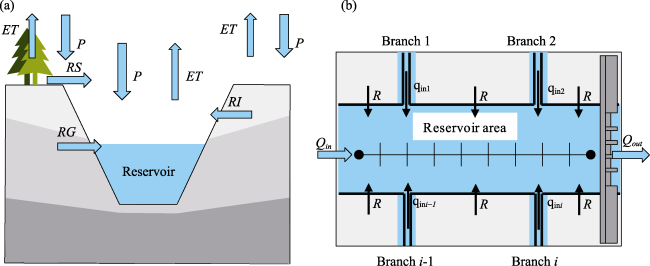
Figure 2 Architecture of the coupled model (a) the profile of the water flow and (b) the water flow along the reservoir area, P is precipitation, ET is evapotranspiration, R, RS, RI and RG are the total runoff, surface runoff, interflow runoff and baseflow runoff, respectively, Qin and Qout are the reservoir inflow in the upper stream and the outflow by dam operation, respectively, qin is the streamflow of the branches in the reservoir area.
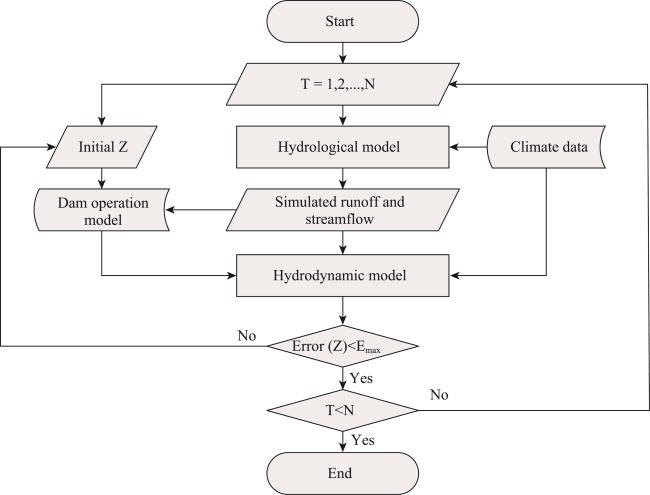
Figure 3 The simulation framework of the coupled model

3.2 DTVGM hydrological model

The DTVGM is an extension of the nonlinear approach for simulating a distributed hydrological basin using a geographic information system/remote sensing (GIS/RS) platform and hydrological process information at the local scale (Xia et al., 2005). Based on system theory, the DTVGM combines the advantages of both nonlinear and distributed hydrological models, can simulate various hydrological processes under different environmental conditions, reduces the complexity of the overall distributed hydrological model based on a physical mechanism, and improves the simulation efficiency and accuracy. In the version used in this study, the model was established through the following steps. (1) First, the natural water cycle in the study basin is represented using a water system network composed of nodes and directed routes. The nodes indicate areas such as the sub-basin, river node, and reservoir, and they are linked by routes such as the river, overland discharge, and recharge (Zeng et al., 2020). The sub-basin is delineated using the digital elevation model (DEM) raster dataset and is then divided into several hydrological response units (HRUs) using the land use and soil raster datasets. (2) The meteorological data, including the precipitation, temperature, wind speed, humidity, and sunshine duration, are used to drive the model to simulate the hydrological processes. Processes such as evapotranspiration, runoff generation, and soil moisture are calculated in each of the sub-basins, and then, the river routing is simulated in the river to obtain the spatiotemporal distribution characteristics of the water cycle elements in the basin and the discharge from the outlet section in each unit of the watershed (Xia et al., 2005; Zeng et al., 2020). (3) Performance indicators comparing the observed streamflow and the simulated streamflow are used as the objective function to calibrate the hydrological model. In this paper, the Nash-Sutcliffe efficiency (NSE) coefficients, correlation coefficient (R2), and relative error (RE) are applied to compare the measured streamflow with the simulated streamflow to assess the model’s performance. The main equations of the DTVGM are described in the following text.
There are three layers in the sub-basin: a vegetation layer, a surface soil layer, and a deep soil layer. The runoff (R) consists of three components: the surface runoff (RS) on the land surface, the interflow runoff (RI) from the surface soil layer, and the base flow (RG) from the deep soil layer. The surface runoff is calculated using a nonlinear method as follows:
$R{{S}_{i}}={{g}_{1}}{{\left( \frac{A{{W}_{u,i}}}{WM} \right)}^{{{g}_{2}}}}{{P}_{i}}$
where g1 and g2 are the time-variant gain coefficients, g1 is the runoff coefficient when the soil moisture is equal to the saturated soil moisture, g2 is the impact coefficient of the soil moisture, P is the effective rainfall arriving at the ground surface (mm), AWu is the average soil water content of the surface soil layer (mm), WM is the saturated soil water content (mm), and the subscript i denotes the time step.
The interflow runoff is calculated via a linear storage-outflow relationship, and the base flow is calculated using a groundwater runoff coefficient as follows:
$R{{I}_{i}}=\frac{A{{W}_{u,i}}+A{{W}_{u,i+1}}}{2}{{K}_{r}}$
$R{{G}_{i}}=A{{W}_{d,i}}{{K}_{rg}}$
where Kr and Krg are the flow coefficients of the surface soil and deep soil layers, and AWd is the average soil water content of the deep soil layer (mm).
The DTVGM is a water balance model. The evapotranspiration (ET), soil moisture (AW), and runoff are computed iteratively. The water balance equation is
${{P}_{i}}+A{{W}_{i}}=A{{W}_{i+1}}+R{{S}_{i}}+E{{T}_{i}}+R{{I}_{i}}+R{{G}_{i}}$
The river routing is calculated using the kinematic wave method under the assumption that the friction slope is equal to the slope and the river flow is unsteady, open channel, gradual change flow. The equations are as follows:
$\frac{\partial A}{\partial t}+\frac{\partial Q}{\partial x}=q$
$Q=A\cdot \frac{1}{n}{{h}^{\frac{2}{3}}}{{S}_{0}}^{\frac{1}{2}}$
where A is the cross-sectional area (m2), t is time, Q is the water flow (m3/s), x is the flow path (m), q is the lateral flow (m2/s), n is the Manning roughness, h is the average depth of the section (m), and S0 is the slope.

3.3 Hydrodynamic model

The one-dimensional hydrodynamic model in the reservoir area uses the finite difference method to solve the Saint-Venant equations. The Saint-Venant equations are the basic equations that describe the movement of unsteady flow in a one-dimensional open channel, including continuity equations and motion equations. In this paper, considering the side inflow and outflow, the following forms of the Saint-Venant equations are adopted:
$\left\{ \begin{align} & \frac{\partial A}{\partial t}+\frac{\partial Q}{\partial x}=q \\ & \frac{\partial Q}{\partial t}+a\frac{Q}{A}\frac{\partial Q}{\partial x}+\left[ gA-B{{\left( \frac{Q}{A} \right)}^{2}} \right]\frac{\partial z}{\partial x}={{\left( \frac{Q}{A} \right)}^{2}}\frac{\partial A}{\partial x}-g\frac{{{Q}^{2}}{{n}^{2}}}{A{{R}^{4/3}}} \\\end{align} \right.,$
where A is the area of the cross section (m2), t is time (s), Q is the discharge (m3/s), and x is the distance (m). q is the lateral flow per unit distance (m2/s), and a positive value indicates inflow. g is the acceleration due to gravity, B is the width of the water surface (m), z is the water level (m), n is the roughness coefficient, and R is the wetted perimeter (m). The control equations are discretized using the Preissmann implicit differential scheme, while the coefficient matrix is solved based on the chasing method.
The upper boundary of the numerical simulation is the discharge of the main reach, and the streamflow of the tributaries is imported as the lateral flow along the main reach in the reservoir area. The upper boundary and the lateral flow are calculated using the hydrological model. The lower boundary is the water level at the dam calculated using the dam operation model or the given input values.

3.4 Dam operation and hydropower generation model

In this paper, the dam operation model is run in two working modes, namely operation based on the dam regulation scheme and no dam operation. For the TGD, the dam operation follows the recent regulation scheme (Figure 4). The normal water level, the limiting level during the flood season, and the low water level during the dry season are 175 m, 145 m, and 155 m, respectively. The reservoir is operated at the limiting level of 145 m from June to September (the flood season). The water storage begins after September 10th, and the water level gradually rises to 175 m at the end of October. Then, the water level gradually drops to 155 m from November to April. Under the strict multi-purpose regulation scheme in the river basin, the operation of the TGD can be divided into four stages during a year: the water supply period (Period I, November 1 to April 30), drawdown period (Period II, May 1 to June 10), flood season (Period III, June 11 to September 10), and impoundment period (Period IV, September 11 to October 31). The no-dam operation mode assumes that there is no TGD, and the TGR area is a natural river.
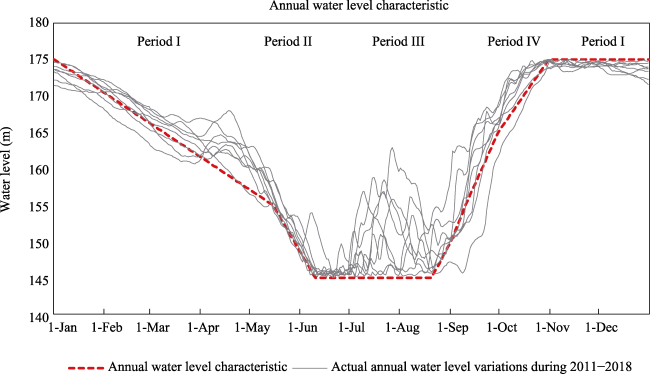
Figure 4 The annual water level characteristic of the Three Gorges Dam
After the simulation of the dam operation and the hydrodynamics in the reservoir area, the daily hydropower electricity output can be calculated using the following equation:
$P=\rho \cdot g\cdot H\cdot Q\cdot \eta \cdot t$
where P is the daily hydropower output (kWh), ρ is the density of water (1000 kg/m3), g is the acceleration due to gravity (9.8 m/s2), and H is the effective head, which can be derived from the difference in the water levels in the upstream and downstream areas of the dam (m). Q is the power discharge through the turbines (m/s), η is the combined efficiency of the turbines and generators, and t is the continuous running time (hour).

4 Results

4.1 Hydrological simulation

The DTVGM hydrological model is established for the Upper Yangtze River Basin. Based on the 90 m DEM and the land use and soil data, the basin is divided into 161 subbasins and 1900 HRUs. The hydrological calculations are performed in each sub-basin and the river. The calibration period is 1960-2002, and the validation period is 2003-2018. The simulated and observed daily streamflow at the three gauges dam are compared in Table 1. The results show that the DTVGM model generally performs well in terms of the daily streamflow simulation during the long historical period. At the Beibei gauge, the NSE, RE, and R2 values for the calibration period are 0.77, 0.05, and 0.92, respectively, and those for the validation period are 0.82, 0.01, and 0.92. At the Zhutuo gauge, the values of the three performance indicators are 0.70, 0.06, and 0.84 for the calibration period and 0.72, 0.09, and 0.86 for the validation period. At the Wulong gauge, the values of the indicators are 0.70, 0.05, and 0.88 for the calibration period and 0.67, 0.11, and 0.83 for the validation period.
Table 1 Performances of the hydrologic model in simulating daily streamflow
Stations Calibration period (1960-2002) Validation period (2003-2018)
NSE RE R2 NSE RE R2
Beibei 0.77 0.05 0.92 0.82 0.01 0.92
Zhutuo 0.70 0.06 0.84 0.72 0.09 0.86
Wulong 0.70 0.05 0.88 0.67 0.11 0.83

4.2 Hydrodynamic simulation

After the calibration and validation of the DTVGM hydrological model, the streamflow simulated at the Zhutuo gauge using the hydrological model is adopted as the upper boundary condition, and the measured water level at the head of the TGR is adopted as the downstream boundary condition. The simulated streamflows of the 14 tributaries and the interval runoff from the hydrological model are input as the lateral discharge of the hydrodynamic model, including the discharges at the Beibei and Wulong gauges and the discharges of the other tributaries in the TGR area. Then, the hydrodynamic model is used to simulate the hydrodynamic processes in the TGR area from 2012 to 2018.
Comparisons of the simulated and observed daily water level and streamflow at the four gauges in the TGR area are shown in Figures 5 and 6. Based on the statistical performance results (Table 2), the hydrodynamic model performs quite well in terms of the water level simulation, with high NSE and R2 values and a low RE value. However, the streamflow simulation performance is not as good as the water level simulation performance due to the residual errors transferred from the hydrological model, leading to NSE values of approximately 0.80 for the calibration period and 0.70 for the validation period. The results also show that the simulated water level in the section closer to the dam is better because the observed water level is used as the lower boundary. Generally, the performance of the hydrodynamic model in terms of water level and streamflow simulation is acceptable, and the model can be used to capture the hydraulic regime in the TGR area.
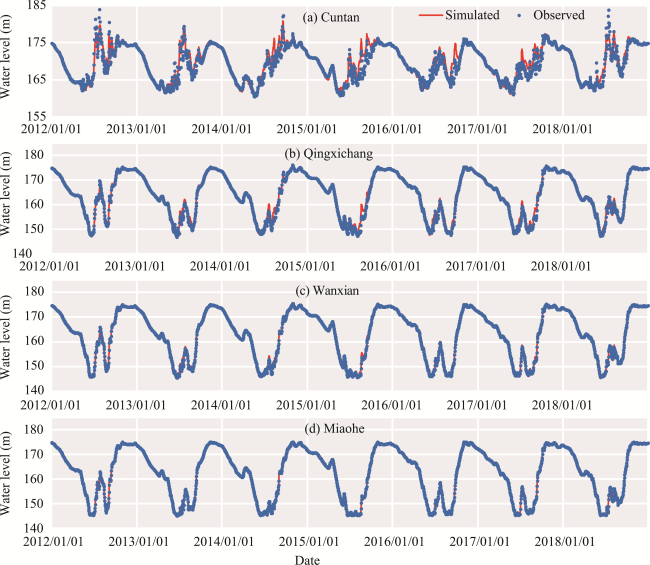
Figure 5 The simulated (red line) and observed (blue dot) water level in the Three Gorges Reservoir area
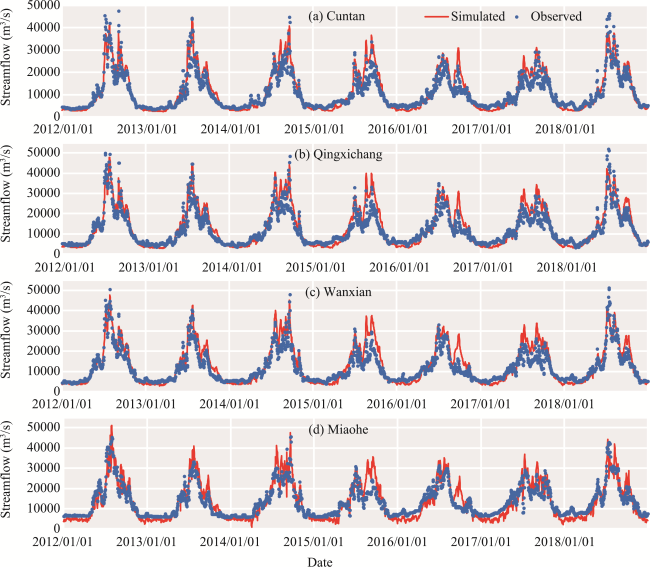
Figure 6 The simulated (red line) and observed (blue dot) streamflow in the Three Gorges Reservoir area
Table 2 Performances of the hydrodynamic model in simulating streamflow and water level
Stations Calibration period (2012-2015) Validation period (2016-2018)
NSE RE (%) R2 NSE RE (%) R2
Cuntan Streamflow 0.82 7.59 0.94 0.76 4.49 0.92
Water level 0.90 0.28 0.95 0.87 0.27 0.94
Qingxichang Streamflow 0.79 9.80 0.94 0.72 8.62 0.92
Water level 0.99 0.22 0.99 0.99 0.19 0.99
Wanxian Streamflow 0.77 11.19 0.94 0.64 10.99 0.90
Water level 0.99 0.08 0.99 0.99 0.07 0.99
Miaohe Streamflow 0.79 3.27 0.93 0.71 3.21 0.91
Water level 0.99 0.01 0.99 0.99 0.01 0.99

4.3 Hydropower generation simulation

The simulated and observed hydropower generated from 2012 to 2018 are compared in Figure 7a. The results show that the model can capture the hydropower generation quite well, with an average relative error of 1.6%. Generally, the simulated average hydropower generation is slightly underestimated (by approximately 92.70 TWh) compared to the actual value (94.27 TWh). Figure 7b shows the average seasonal variations in the hydropower generation from 2012 to 2018. The variation in the hydropower generation has a changing trend similar to that of the outflow. The annual mean daily generation is approximately 0.25 TWh. During Period I, the daily generated power is 0.14-0.29 TWh, with an average value of 0.17 TWh; and it steadily changes from 0.21 TWh to 0.29 TWh, with a mean value of 0.27 TWh during Period II. During the flood season (Period III), the power generation varies widely from 0.26 TWh to 0.49 TWh, with an average value of 0.38 TWh. During Period IV, the average power generation is approximately 0.33 TWh, and it fluctuates between 0.26 TWh and 0.38 TWh.
Figure 7 Comparison of the simulated and observed hydropower electricity (a) and the seasonal variations of hydropower electricity (b)

4.4 Effects on the hydrological regime in the TGR area

(1) Variations in the water level and flow velocity
Figure 8a shows the variations in the mean water level and flow velocity at the four gauges in the TGR area from 2012 to 2018. During Period I, the water level drops from 175 m to no more than 165 m at Cuntan and to 160 m at the other three gauges. Then, the water level further declines to no higher than 150 m at Qingxichang and nearly 145 m at Miaohe and Wanxian, while the water level at Cuntan only decreases slightly during Period II. During Period III (the flood season), the water level rises and then falls at the four gauges due to the flood control operation scheme, and the water level at Miaohe near the dam is less than 155 m. During Period IV, the water level gradually rises to 175 m at the end of October for water impoundment. Figure 8b shows the mean flow velocities during the four stages from 2012 to 2018. The flow velocities at the four gauges rise from starting at the beginning of the year and reach the maximum values during the flood season. Then, they decrease until the end of the year. In addition, the flow velocity is higher at Cuntan than that at Miaohe due to the backwater effect. The average flow velocities at Cuntan, Qingxichang, Wanxian, and Miaohe are approximately 0.67 m/s, 0.31 m/s, 0.12 m/s, and 0.03 m/s during Period I; 1.95 m/s, 0.81 m/s, 0.29 m/s, and 0.09 m/s during Period II; 2.36 m/s, 1.60 m/s, 0.56 m/s, and 0.15 m/s during Period III; and 1.53 m/s, 0.86 m/s, 0.30 m/s, and 0.07 m/s during Period IV, respectively (Table 3).
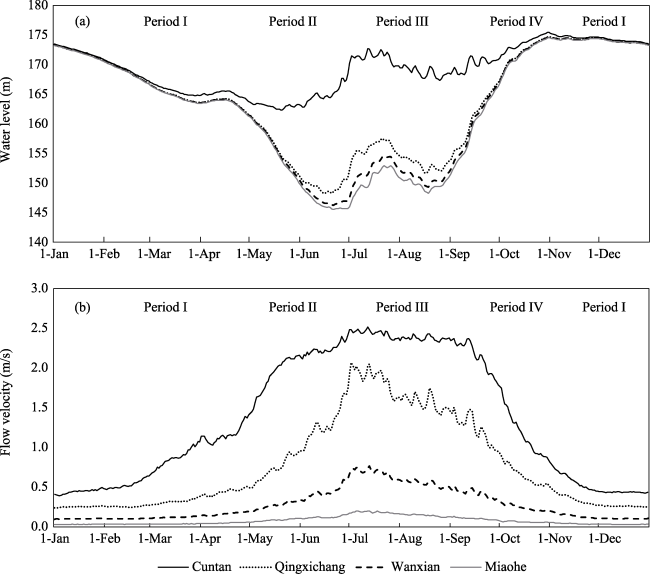
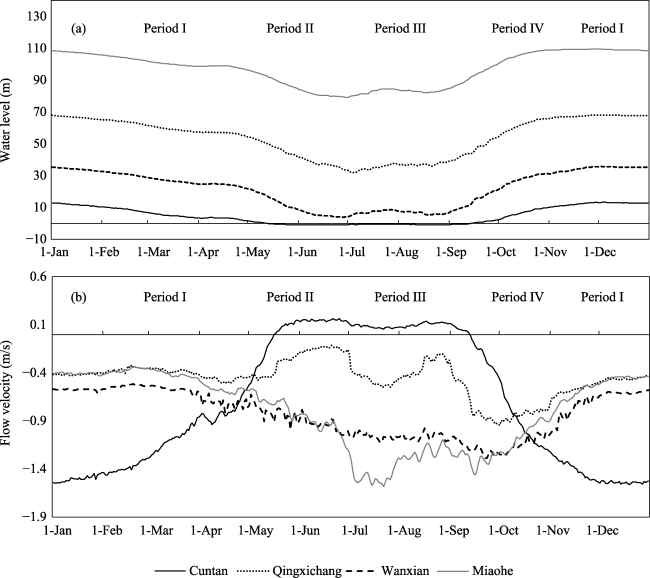
Figure 8 Variations of water level (a) and flow velocity (b) at the gauges
Table 3 The average water level and flow velocity at the gauges in the Three Gorges Reservoir area
Period Cuntan Qingxichang Wanxian Miaohe
Z (m) v (m/s) Z (m) v (m/s) Z (m) v (m/s) Z (m) v (m/s)
I Operation 170.19 0.67 169.65 0.31 169.62 0.12 169.55 0.03
No operation 161.23 1.95 138.75 0.75 105.98 0.75 64.75 0.51
Changes 8.96 -1.29 30.90 -0.44 63.64 -0.63 104.80 -0.48
II Operation 163.24 1.95 155.06 0.81 154.53 0.29 154.14 0.09
No operation 163.39 2.00 141.67 1.12 108.03 1.12 65.21 0.83
Changes -0.15 -0.04 13.38 -0.31 46.50 -0.83 88.93 -0.75
III Operation 168.90 2.36 153.49 1.60 150.89 0.56 149.66 0.15
No operation 169.56 2.26 146.92 1.95 114.31 1.61 66.93 1.41
Changes -0.66 0.10 6.57 -0.35 36.58 -1.04 82.73 -1.26
IV Operation 172.49 1.53 168.72 0.86 168.40 0.30 168.06 0.07
No operation 167.94 2.19 145.32 1.69 111.67 1.47 66.23 1.22
Changes 4.55 -0.66 23.40 -0.83 56.73 -1.17 101.83 -1.15
The variations in the average water level and flow velocity from 2012 to 2018 in the entire TGR area from the tail section to the dam are shown in Figure 9. The fluctuating backwater zone is approximately 663 km from the dam with a water level of approximately 175 m during the impoundment period, while the permanent backwater zone is approximately 524 km from the dam with a water level of approximately 145 m during the flood season. In the permanent backwater zone, the maximum flow velocity is approximately 2.0 m/s, with an average value of approximately 0.35 m/s. The water levels are strictly influenced by the dam operation and follow the water level change characteristics of the dam. In the fluctuating backwater area, the maximum flow velocity is approximately 2.5-3.0 m/s, with an average value of approximately 1.0 m/s. In the non-backwater area, the maximum flow velocity is greater than 3.0 m/s, with an average value of approximately 1.5 m/s.
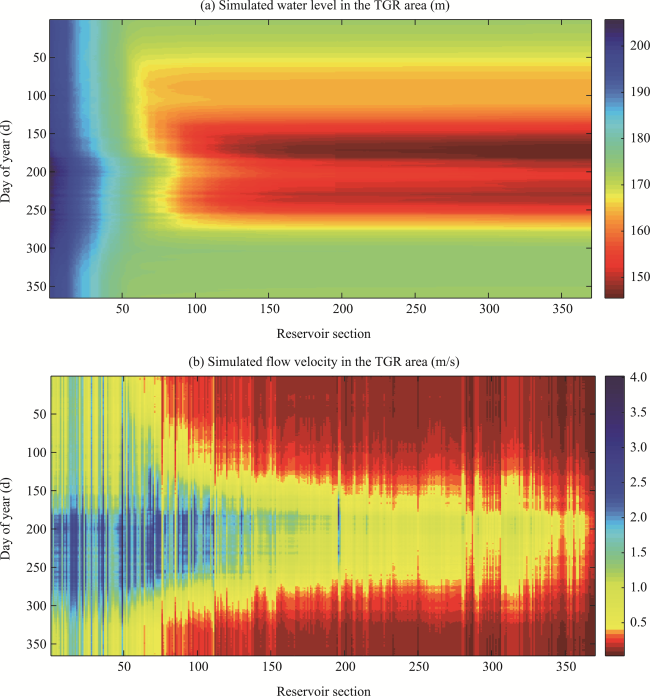
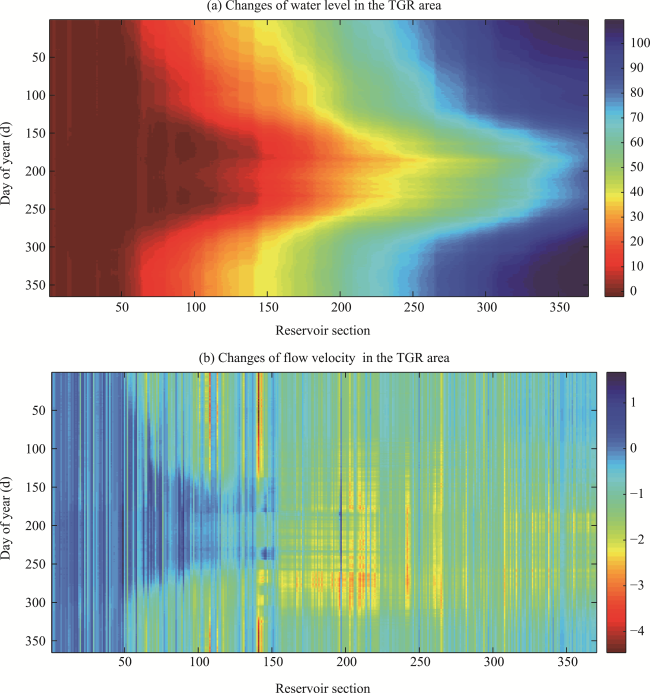
Figure 9 Variations of water level (a) and flow velocity (b) in the Three Gorge Reservoir area
(2) Effects on the water level and flow velocity
To investigate the effects of the operation of the TGD on the hydrological regime in the TGR area, the coupled model is run in the hypothetical no-dam operation mode, and the water level and flow velocity under the dam-operation and no-operation modes are compared based on the simulation results. The differences in the water level and flow velocity at the four gauges under these two scenarios are shown in Figure 10. The results show that in the TGR area, the water level increases significantly at the Qingxichang, Wanxian, and Miaohe gauges due to water impoundment, while the water level does not increase as much at the other gauge, and the water level decreases slightly during Periods II and III at the Cuntan gauge. Figure 10b shows the differences in the flow velocity variations at the four gauges. The decline in the flow velocity increases during the flood season at the Wanxian and Miaoge gauges, while it exhibits a different trend at the other gauges, especially at the Cuntan gauge. The reduction in the flow velocity decreases during Period I and exhibits positive changes during Period II and Period III under the dam operation. The flow velocities at the four gauges decrease by 1.29 m/s, 0.44 m/s, 0.63 m/s, and 0.48 m/s during Period I; 0.04 m/s, 0.31 m/s, 0.83 m/s, and 0.75 m/s during Period II; −0.1 m/s, 0.35 m/s, 1.04 m/s, and 1.26 m/s during Period III; and 0.66 m/s, 0.83 m/s, 1.17 m/s, and 1.15 m/s during Period IV.
Figure 10 Differences of water level (a) and flow velocity (b) at the gauges between dam operation and no operation based on the simulation
Figure 11 shows the differences in the water level and flow velocity in the entire TGR area from the tail section to the dam within a year under the dam-operation and no-operation scenarios. In the permanent backwater zone, the water level rises and the flow velocity decreases under the dam-operation scenario; while in the fluctuating backwater area, the water level mainly rises and the flow velocity decreases in the water impoundment and supply periods. In the non-backwater area, the water level and flow velocity are rarely influenced by the dam operation, and the flow velocity exhibits a certain amount of increase in some sections.
Figure 11 Differences of water level (a) and flow velocity (b) in the Three Gorges Reservoir area between dam operation and no operation based on the simulation

4.5 Effects on the discharge in the downstream area

The simulated differences of the mean reservoir outflow under the dam-operation and no-operation scenarios are shown in Figure 12a and Table 4. During Period I, the discharge without dam operation is approximately 7164 m3/s, and it increases to 7803 m3/s, with a relative change of 8.93%. The maximum increase (up to 35%) occurs in late February. During Period II, the discharge increases from 12,146 m3/s to 14,785 m3/s (by 21.73%) to draw down the water storage for flood control in the following wet season. In the flood season (Period III), the discharge changes are characterized by alternating positive and negative variations due to the transposition and attenuation of the streamflow under the flood control operation scheme. The mean discharge decreases slightly from 23,787 m3/s to 23,335 m3/s (by 1.90%). In the water impoundment period (Period IV), the streamflow decreases from 19491 m3/s to 16017 m3/s (by 17.82%). To further investigate the effects of the operation of the TGD on flood control, 2012, in which a large flood occurred, is selected as a typical year to analyze the flood peak control effect. Figure 12b compares the reservoir outflow under the dam-operation and no-operation scenarios during the flood season in 2012. The dam pre-release strategy is applied to limit the storage capacity before the flood peak, and then, the flood peak flow is restricted in the reservoir to reduce the outflow. The relative change can reach up to 23%, from 62,012 m3/s to 47,873 m3/s, in July. After the peak flood flow, the restricted floodwater is discharged more gently, and the water level is drawn down for the next new flood peak control event. Furthermore, the effects of the operation of the TGD on the maximum discharge on days 1, 3, 5, 7, 10, and 15 are shown in Figure 13. The results show that the operation of the TGD has a notable effect on decreasing the daily maximum flow by approximately 26.2% during the flood season. The cutting effects are approximately 22.1%, 15.5%, 14.4%, 12.6%, and 10.3% for the maximum 3-day, 5-day, 7-day, 10-day, and 15-day streamflow volumes, respectively.
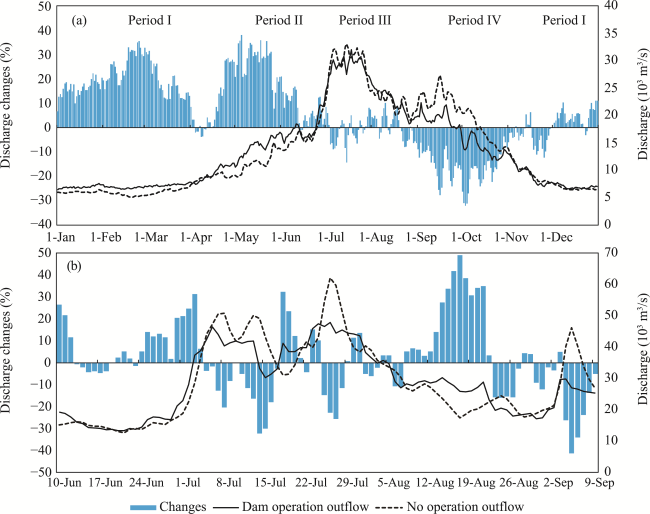
Figure 12 Differences of the average outflow (a) and the discharge in the flood season of 2012 (b) between dam operation and no operation
Table 4 The average outflow changes between dam operation and no operation
Stage Period I Period II Period III Period IV
Dam operation 7803 14,785 23,335 16,017
No operation 7164 12,146 23,787 19,491
Changes (%) 8.93 21.73 -1.90 -17.82
Figure 13 The maximum n-days flood changes between dam operation and no operation

5 Discussion

5.1 Performance of the coupled model

In this paper, a coupled hydrological-hydrodynamic-dam operation model is proposed to simulate the hydrological regime in the TGR region. First, the DTVGM hydrological model is well calibrated and validated in the Upper Yangtze River Basin and generally performs well in simulating the daily inflow to the TGR area. Because the output of the DTVGM is the input boundary of the other models, the model error is transferred to the other models in a cascading manner. Thus, further research should be conducted on the model calibration in years with different frequencies to better simulate the inflow to the TGR area. Compared with the previous studies that used other models such as the soil and water assessment tool (SWAT) model and the variable infiltration capacity (VIC) model to conduct hydrological simulations in the Upper Yangtze River Basin, the simulation period in our study is longer and the results are still acceptable. The hydrodynamic model performs better in water level simulation than in discharge simulation. From the reservoir tail to the dam, the performance of the simulated discharge decreases, while that of the simulated water level increases. This could be due to both the dam operation model error and the hydrological input inflow errors. Compared with previous studies involving hydrodynamic simulations in the TGR area using the environmental fluid dynamics (EFDC) model and the MIKE 11, the coupled model proposed in this paper can capture the coupling relationships between the hydrological, hydrodynamic, and dam operation better. Nevertheless, our model results still indicate that the proposed coupled model can generally capture the streamflow and hydraulic changes well, and the model can be used to conduct further analysis under different scenarios.

5.2 Analysis of flood control effect

The most important function of the TGD is flood control. Within the TGD regulation during the flood season, the dam operation redistributes the reservoir outflow via transposition and attenuation (Figure 12), which can cut the maximum daily flood peak by 26.2% and thus can have a positive effect on reducing the risk of flooding in the downstream area. Lai and Wang (2017) concluded that the TGD can effectively reduce the flood level in Dongting Lake. Furthermore, Mei et al. (2018) showed that the impoundment by the TGD reduced the peak water level at the Datong hydrometric station on the lower reach of the Yangtze River by 1.47 m on July 25, 2016. Nevertheless, it also raises the water level by different amounts along the TGR area (Figure 11a). When the floodwater is restricted to the reservoir, there is an inevitable rise in the water level in the permanent backwater region in the TGR area. In addition, the impacts of the operation of the TGD on the hydrological regime in the reservoir area are also important for streamflow analysis in the fluctuating backwater zone. The Cuntan gauge is located in the fluctuating backwater area and is usually used to indicate the streamflow changes in the upper Yangtze River. To further analyze the effects of the flood control operation scheme on the reservoir area, the stage-discharge relationship at the Cuntan gauge and the relationship between the water level changes at the Cuntan gauge and the water level at the dam is shown in Figure 14. Figure 14a shows that the stage-discharge relationship changes slightly during the flood season, and the flood-carrying capacity decreases slightly when the discharge is greater than 30,000 m3/s. In contrast, the flood-carrying capacity increases slightly when the discharge is less than 30,000 m3/s.
Figure 14 The stage-discharge relationships based on dam-operation (blue dot) and no operation (red dot) (a), the relationship between the water level change of Cuntan and water level of the Three Gorges Reservoir (b)
Figure 14b shows that the water level at the Cuntan gauge increases when the water level at the dam is higher than approximately 158 m due to the dam operation scheme, while the changes are less than zero when the dam water level is lower than 158 m. This finding provides a reference water level for developing a flood control scheme that ensures safety in the upstream and downstream areas.

5.3 Analysis of water impoundment and supply effects

According to the operation scheme, the water impoundment starts on September 10th and lasts until the end of October, during which the water level rises from 145 m to 175 m. Then, the impounded water is used during the dry season to increase the downstream flow for multiple purposes such as ecological requirements, river transportation, and water supply flow from November to April. During the impoundment period, the reservoir outflow is mostly less than 20,000 m3/s, which is approximately 18% lower than the natural flow. This results in a decrease in the near-dam downstream flow in the main channel and induces changes in the flow regimes of both the Yangtze-Dongting and Yangtze-Poyang river-lake systems in the middle reaches (Lai et al., 2014), the morphological parameters (Yuan et al., 2012), and the habitat suitability (Wu et al., 2020). In addition, the water impoundment also raises the water level and reduces the flow velocity, which may cause more threats to the water quality (Li et al., 2019) and riparian vegetation (New and Xie, 2008). During the dry season, the reservoir outflow discharge increases by 9% and 22% during Period I and Period II, which could increase the downstream flow and the hydropower generation. However, due to the high-water level in the TGR area, the flow velocity is slower than under natural conditions, particularly in the near dam area of the permanent backwater region where the flow velocity is approximately 0.03 m/s.

5.4 Analysis of hydropower generation

The hydropower generation simulation revealed that the hydropower electricity generation is slightly underestimated, which may be due to the underestimation of the discharge during the dry period, consequently resulting in a lower power generation estimation. In addition, the combined generation efficiency of the turbines and generators is set to a constant value in the model. However, the generation efficiency varies with the water level and discharge conditions, which will also lead to calculation errors (Qin et al., 2020). Nevertheless, the model is still acceptable in terms of simulating the power generation. The results show that the operation of the TGD produces significant power generation benefits, reaching approximately 94.27 TWh/year, and supports socio-economic development. Furthermore, the results obtained in this study show that the mean daily hydropower generation variations exhibit a trend similar to that of the outflow. The maximum hydropower generation occurs during the flood season because of the high discharge although the water level is not as high as that during the dry season. Figure 15 shows the relationships between the power generation and the water level and discharge conditions of the TGD. As can be seen, the power generation increases as the discharge increases, at a rate of 16-22 GWh/(1000 m3/s), with an average value of 18 GWh/(1000 m3/s). The generated power reaches a maximum value of 0.54 TWh under the high and low water levels of the dam, approximately 25,000 m3/s and 33,000 m3/s, respectively. In addition, the power generation is also related to the water level. The higher the water level of the TGD is, the more hydropower is generated. The difference between the lowest water level and the highest water level can be greater than 120 GWh when the outflow is approximately 25,000 m3/s, and the rate of increase is approximately 4.9 GWh/m. These results suggest the importance of the water level and streamflow regulation to hydropower generation.
Figure 15 The relationship between power generation and water level, discharge conditions

6 Conclusions

In this study, a coupled hydrological-hydrodynamic-dam operation model was developed to simulate the hydrological regime in the TGR. The coupled model can capture the hydrological and hydraulic processes and the hydropower generation quite well with a high performance level. The effects of the dam operation on the hydrological regime in the reservoir area and the discharge to the downstream area were investigated under dam-operation and no-dam-operation scenarios. The water level rises and the flow velocity decreases in the permanent backwater region under dam operation; while in the fluctuating backwater area, the water level mainly rises and the flow velocity decreases during the water impoundment and supply periods. In addition, the discharge to the downstream area decreased during the water impoundment period and increases significantly during the drawdown period. The comprehensive hydrological effects, including flood control, water impound and supply, and hydropower generation effects, were also investigated. Dam operation can cut the flood peak to reduce the risk of flooding in the downstream area. Moreover, the water level at the Cuntan gauge may increase when the water level of the dam is higher than approximately 158 m. The operation of the TGD also produces significant power generation benefits and supports socio-economic development. During the dry season, the increase in the reservoir outflow can provide significant water supply benefits of approximately 9%-22% in the downstream area. In addition, attention should be paid to the low flow velocity near the dam in the TGR area. These findings contribute to the development of an optimal operation scheme for the TGD to maximize the comprehensive benefits.
[1]
Baracchini T, Hummel S, Verlaan M et al., 2020. An automated calibration framework and open source tools for 3D lake hydrodynamic models. Environmental Modelling & Software, 134: 104787.

[2]
Bittner D, Narany T S, Kohl B et al., 2018. Modeling the hydrological impact of land use change in a dolomite-dominated karst system. Journal of Hydrology, 567: 267-279.

DOI

[3]
Botter G, Basso S, Porporato A et al., 2010. Natural streamflow regime alterations: Damming of the Piave river basin (Italy). Water Resources Research, 46(6): W06522.

[4]
Chai Y, Yang Y, Deng J et al., 2020. Evolution characteristics and drivers of the water level at an identical discharge in the Jingjiang reaches of the Yangtze River. Journal of Geographical Sciences, 30(10): 1633-1648.

DOI

[5]
Chen Q, Chen H, Zhang J et al., 2020. Impacts of climate change and LULC change on runoff in the Jinsha River Basin. Journal of Geographical Sciences, 30(1): 85-102.

DOI

[6]
Dai X, Yu Z, Yang G et al., 2021. Investigation of inner-basin variation: Impact of large reservoirs on water regimes of downstream water bodies. Hydrological Processes, 35(5): e14241.

[7]
Gao C, Ruan T, 2018. The influence of climate change and human activities on runoff in the middle reaches of the Huaihe River Basin, China. Journal of Geographical Sciences, 28(1): 79-92.

DOI

[8]
Gedney N, Cox P M, Betts R A et al., 2006. Detection of a direct carbon dioxide effect in continental river runoff records. Nature, 439: 835-838.

DOI

[9]
Guo C, Jin Z, Guo L et al., 2020. On the cumulative dam impact in the upper Changjiang River: Streamflow and sediment load changes. Catena, 184: 104250.

DOI

[10]
Guo S, Xiong L, Zha X et al., 2021. Impacts of the Three Gorges Dam on the streamflow fluctuations in the downstream region. Journal of Hydrology, 598: 126480.

DOI

[11]
Han C, Qin Y, Zheng B et al., 2020. Geochemistry of phosphorus release along transect of sediments from a tributary backwater zone in the Three Gorges Reservoir. Science of The Total Environment, 722: 136964.

DOI

[12]
Huang S, Xia J, Zeng S et al., 2021. Effect of Three Gorges Dam on Poyang Lake water level at daily scale based on machine learning. Journal of Geographical Sciences, 31(11): 1598-1614.

DOI

[13]
Huang Y, Wang J, Yang M, 2019. Unexpected sedimentation patterns upstream and downstream of the Three Gorges Reservoir: Future risks. International Journal of Sediment Research, 34: 108-117.

DOI

[14]
Jiang C, Zhang Q, Luo M, 2019. Assessing the effects of the Three Gorges Dam and upstream inflow change on the downstream flow regime during different operation periods of the dam. Hydrological Processes, 33: 2885-2897.

DOI

[15]
Jing Z, An W, Zhang S et al., 2020. Flood control ability of river-type reservoirs using stochastic flood simulation and dynamic capacity flood regulation. Journal of Cleaner Production, 257: 120809.

DOI

[16]
Lai X, Jiang J, Yang G et al., 2014. Should the Three Gorges Dam be blamed for the extremely low water levels in the middle-lower Yangtze River. Hydrological Processes, 28: 150-160.

DOI

[17]
Lai X, Wang Z, 2017. Flood management of Dongting Lake after operation of Three Gorges Dam. Water Science and Engineering, 10: 303-310.

DOI

[18]
Li L, Xia J, Zhou M et al., 2020. Riverbed armoring and sediment exchange process in a sand-gravel bed reach after the Three Gorges Project operation. Acta Geophysica, 68: 243-252.

DOI

[19]
Li X, Liu B, Wang Y et al., 2020. Hydrodynamic and environmental characteristics of a tributary bay influenced by backwater jacking and intrusions from a main reservoir. Hydrology and Earth System Sciences, 24(11): 5057-5076.

DOI

[20]
Li Z, Ma J, Guo J et al., 2019. Water quality trends in the Three Gorges Reservoir region before and after impoundment (1992-2016). Ecohydrology & Hydrobiology, 19: 317-327.

[21]
Liro M, 2019. Dam reservoir backwater as a field-scale laboratory of human-induced changes in river biogeomorphology: A review focused on gravel-bed rivers. Science of The Total Environment, 651: 2899-2912.

DOI

[22]
Liro M, Ruiz-Villanueva V, Mikuś P et al., 2020. Changes in the hydrodynamics of a mountain river induced by dam reservoir backwater. Science of The Total Environment, 744: 140555.

DOI

[23]
Liu P, Li L, Guo S et al., 2015. Optimal design of seasonal flood limited water levels and its application for the Three Gorges Reservoir. Journal of Hydrology, 527: 1045-1053.

DOI

[24]
Lyu J, Mo S, Luo P et al., 2019. A quantitative assessment of hydrological responses to climate change and human activities at spatiotemporal within a typical catchment on the Loess Plateau, China. Quaternary International, 527: 1-11.

DOI

[25]
Mei X, Dai Z, Darby S E et al., 2018. Modulation of extreme flood levels by impoundment significantly offset by floodplain loss downstream of the Three Gorges Dam. Geophysical Research Letters, 45: 3147-3155.

DOI

[26]
Mulatu C A, Crosato A, Langendoen E J et al., 2021. Long-term effects of dam operations for water supply to irrigation on downstream river reaches. The case of the Ribb River, Ethiopia. International Journal of River Basin Management, 19: 429-443.

DOI

[27]
Nilsson C, Reidy C A, Dynesius M et al., 2005. Fragmentation and flow regulation of the world’s large river systems. Science, 308: 405-408.

DOI

[28]
Pandey B K, Khare D, Kawasaki A et al., 2019. Climate change impact assessment on blue and green water by coupling of representative CMIP5 climate models with physical based hydrological model. Water Resources Management, 33: 141-158.

DOI

[29]
Poff N L, Matthews J H, 2013. Environmental flows in the Anthropocence: Past progress and future prospects. Current Opinion in Environmental Sustainability, 5(6): 667-675.

DOI

[30]
Qin P, Xu H, Liu M et al., 2020. Climate change impacts on Three Gorges Reservoir impoundment and hydropower generation. Journal of Hydrology, 580: 123922.

DOI

[31]
Qin P, Xu H, Liu M et al., 2022. Projected impacts of climate change on major dams in the Upper Yangtze River Basin. Climatic Change, 170(8).

[32]
Schmitt R J P, Kittner N, Kondolf G M et al., 2019. Deploy diverse renewables to save tropical rivers. Nature, 569: 330-332.

DOI

[33]
Su Z, Ho M, Hao Z et al., 2020. The impact of the Three Gorges Dam on summer streamflow in the Yangtze River Basin. Hydrological Processes, 34: 705-717.

DOI

[34]
Tang Q, Bao Y, He X et al., 2016. Flow regulation manipulates contemporary seasonal sedimentary dynamics in the reservoir fluctuation zone of the Three Gorges Reservoir, China. Science of The Total Environment, 548/549: 410-420.

DOI

[35]
Tian J, Chang J, Zhang Z et al., 2019. Influence of Three Gorges Dam on downstream low flow. Water, 11(1): 65.

DOI

[36]
Volke M A, Johnson W C, Dixon M D et al., 2019. Emerging reservoir delta-backwaters: Biophysical dynamics and riparian biodiversity. The Bulletin of the Ecological Society of America, 100(3): e01537.

[37]
Wang H, Sun F, Liu W, 2020. Characteristics of streamflow in the main stream of Changjiang River and the impact of the Three Gorges Dam. Catena, 189: 104498.

DOI

[38]
Wang J, Dai Z, Mei X et al., 2018. Immediately downstream effects of Three Gorges Dam on channel sandbars morphodynamics between Yichang-Chenglingji Reach of the Changjiang River, China. Journal of Geographical Sciences, 28(5): 629-646.

DOI

[39]
Wang K, Pang Y, He C et al., 2021. Three Gorges Reservoir construction induced dissolved organic matter chemistry variation between the reservoir and non-reservoir areas along the Xiangxi tributary. Science of The Total Environment, 784: 147095.

DOI

[40]
Wu H P, Chen J, Zeng G M et al., 2020. Effects of early dry season on habitat suitability for migratory birds in China’s two largest freshwater lake wetlands after the impoundment of Three Gorges Dam. Journal of Environmental Informatics, 36(2): 82-92.

[41]
Xia J, Wang G, Tan G et al., 2005. Development of distributed time-variant gain model for nonlinear hydrological systems. Science in China Series D: Earth Sciences, 48: 713-723.

[42]
Xiang R, Wang L, Li H et al., 2021. Water quality variation in tributaries of the Three Gorges Reservoir from 2000 to 2015. Water Research, 195: 116993.

DOI

[43]
Xu X, Tan Y, Yang G, 2013. Environmental impact assessments of the Three Gorges Project in China: Issues and interventions. Earth-Science Reviews, 124: 115-125.

DOI

[44]
Yang S L, Milliman J D, Xu K H et al., 2014. Downstream sedimentary and geomorphic impacts of the Three Gorges Dam on the Yangtze River. Earth-Science Reviews, 138: 469-486.

DOI

[45]
Yang Z, Liu D, Ji D et al., 2010. Influence of the impounding process of the Three Gorges Reservoir up to water level 172.5 m on water eutrophication in the Xiangxi Bay. Science China Technological Sciences, 53: 1114-1125.

DOI

[46]
Yang Y, Zhang M, Sun Z et al., 2018. The relationship between water level change and river channel geometry adjustment in the downstream of the Three Gorges Dam. Journal of Geographical Sciences, 28(12): 1975-1993.

DOI

[47]
Yang Y, Zhang M, Zhu L et al., 2017. Influence of large reservoir operation on water-levels and flows in reaches below dam: Case study of the Three Gorges Reservoir. Scientific Reports, 7(1): 15640.

DOI PMID

[48]
Yin J, Gentine P, Zhou S et al., 2018. Large increase in global storm runoff extremes driven by climate and anthropogenic changes. Nature Communications, 9: 4389.

DOI PMID

[49]
Yuan W, Yin D, Finlayson B et al., 2012. Assessing the potential for change in the middle Yangtze River channel following impoundment of the Three Gorges Dam. Geomorphology 147/148: 27-34.

[50]
Zarfl C, Lumsdon A E, Berlekamp J et al., 2015. A global boom in hydropower dam construction. Aquatic Sciences, 77: 161-170.

DOI

[51]
Zeng S, Du H, Xia J, 2020. Development of an interface-oriented add-in modeling framework for integrated water system simulation and its application. Environmental Modelling & Software, 134: 104840.

[52]
Zeng S, Du H, Xia J et al., 2022. Attributions of evapotranspiration and gross primary production changes in semi-arid region: A case study in the water source area of the Xiong’an New Area in North China. Remote Sensing, 14: 1187.

DOI

[53]
Zeng S, Xia J, Du H, 2014. Separating the effects of climate change and human activities on runoff over different time scales in the Zhang River basin. Stochastic Environmental Research and Risk Assessment, 28: 401-413.

DOI

[54]
Zhang J, Huang T, Chen L et al., 2020. Impact of the Three Gorges Reservoir on the hydrologic regime of the river-lake system in the middle Yangtze River. Journal of Cleaner Production, 258: 121004.

DOI

[55]
Zhang Q, Li L, Wang Y G et al., 2012. Has the Three-Gorges Dam made the Poyang Lake wetlands wetter and drier. Geophysical Research Letters, 39(20): L00402.

[56]
Zhang Q, Zhou Y, Singh V P et al., 2012. The influence of dam and lakes on the Yangtze River streamflow: Long-range correlation and complexity analyses. Hydrological Processes, 26: 436-444.

DOI

[57]
Zhang S, Hua D, Meng X et al., 2011. Climate change and its driving effect on the runoff in the “Three-River Headwaters” region. Journal of Geographical Sciences, 21(6): 963-978.

DOI

Outlines

/