Research Articles

Changes over flood season in turbidity maximum zone in a mountainous macrotidal estuary from 1986 to 2020

  • LIU Ruiqing ,
  • CHENG Heqin , * ,
  • TENG Lizhi ,
  • FAN Heshan
Expand
  • State Key Laboratory of Estuarine and Coastal Research, East China Normal University, Shanghai 200241, China
*Cheng Heqin (1962-), PhD and Professor, E-mail:

Liu Ruiqing (1995-), PhD Candidate, specialized in coastal zone management. E-mail:

Received date: 2022-04-19

  Accepted date: 2022-12-01

  Online published: 2023-05-11

Supported by

National Natural Science Foundation of China – The Netherlands Organization for Scientific Research-Engineering and Physical Sciences Research Council(NSFC-NWO-EPSRC)(51761135023)

Abstract

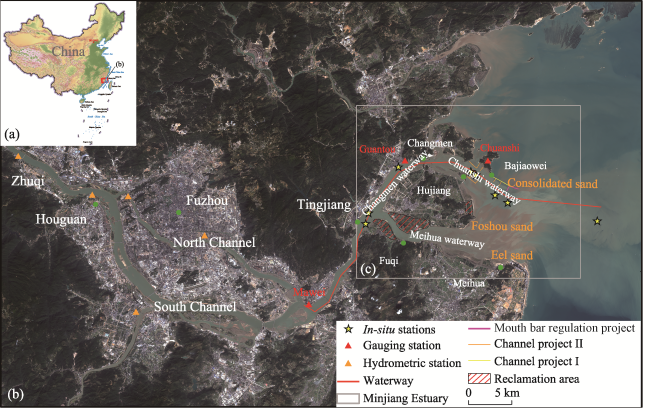
The construction of channel regulation projects, reservoirs, and other human activities have led to significant changes in channel geometry and hydrodynamic conditions in mountainous macrotidal estuaries. However, their impact on the long-term evolution of the turbidity maximum zone (TMZ) in these estuaries is still unclear. Therefore, the Minjiang Estuary (ME) was selected as the study area and using the Gabor filter and surface suspended sediment concentration (SSSC) data retrieved from GF PMS/WFV and Landsat-TM/ETM+/ OLI images in the flood season from 1986 to 2020, the flow direction of Chuanshi Waterway, the spatiotemporal evolution characteristics of TMZ in the ME, and the influence of human activities on these were analyzed. The results indicate that during flood tides in the past 35 years, the TMZ was mainly distributed in sections from the Changmen to the Chuanshi and Meihua waterways. The construction of the Shuikou Reservoir caused the SSSC to decrease by 65 mg/L at the Chuanshi Tidal Gauge Station in the ME. The TMZ in the ME waterway channel notably migrated toward the sea due to the waterway regulation project, with the landward and seaward boundaries moving by 2.5 km and 3 km seaward, respectively. The main distribution area moved from Jinpaimen to the section from Chuanshi Waterway to the mouth of the ME. These variation characteristics were basically consistent with the annual average TMZ in the flood season. Through the interactions between nature and human interventions, the flow regime of the ME tended to converge in the flood season. Therefore, human activities have significantly impacted the long-term evolution of the TMZ in the ME.

Cite this article

LIU Ruiqing , CHENG Heqin , TENG Lizhi , FAN Heshan . Changes over flood season in turbidity maximum zone in a mountainous macrotidal estuary from 1986 to 2020[J]. Journal of Geographical Sciences, 2023 , 33(5) : 980 -998 . DOI: 10.1007/s11442-023-2116-8

1 Introduction

The turbidity maximum zone (TMZ) is a dynamic sedimentary phenomenon widely occurring in estuaries, where the sediment concentration is significantly higher than in adjacent waters (Schubel, 1968; Shi et al., 1993; Li and Zhang, 1998; Wang et al., 2021). The TMZ plays an important role in the formation and sedimentary evolution of estuarine landforms, as well as the transport of biochemical components (Jiang, 2007; Li et al., 2009; Wen and Xu, 2009; Wu et al., 2012; Yang et al., 2014; Shen et al., 2020), thus affecting regional planning, ecological security, waterway maintenance, and fishery breeding (Chen, 2008; Lei, 2018). Due to the importance of the estuarine turbidity zone, field observation and studies on many types of estuaries have been carried out worldwide (Glangeaud, 1938; Uncles et al., 2006; Jiang et al., 2013; Liu et al., 2018; Le et al., 2019; Zhang et al., 2019), and some progress has been made in understanding the underlying dynamic mechanisms. Understanding the long-term evolution of TMZs might help deeply understand the formation, development, and evolution of the estuary morphology, channel, shoal, entrance bar, etc., which can guide offshore regional planning, engineering layout, and environmental protection policies.
China is a multi-basin country with numerous estuaries. In fact, there are a large number of small and medium rivers, and their contribution to sediment transport to the sea is much greater than that of large rivers (Milliman and Syvitski, 1992), implying their important roles in sediment source-sink dynamics and biogeochemical cycles (Kao et al., 2014; Bao et al., 2015). The Minjiang Estuary (ME) is a typical estuary among small-sized estuaries in the East China Sea, with a favorable geographical location. Its development is restricted by mountains and bedrocks, uneven distribution of runoff within a year, complex hydrodynamic conditions, and sediment sources in the mountain and creek rivers, so its sedimentary environment is complex and dynamic (Pan et al., 1991; Liu et al., 2001; Li et al., 2008; Liu et al., 2020). Located in Fuzhou State-Level New Area, the contrast between people and land has become increasingly prominent due to large-scale industrial development, urban construction, and increasing land demand. Due to the interactions between natural evolution and human activities, the hydrodynamics and sediment transport law in the ME have changed significantly (Zheng, 2005; Chen et al., 2010; Wang et al., 2021).
At present, the characteristics and dynamic mechanism of suspended sediment transport in the lower reaches of the Minjiang River and its estuary have been initially investigated (Li, 2009; Wen and Xu, 2009; Zhao et al., 2012; Gong et al., 2017). Wen et al. (2009) analyzed the spatiotemporal changes in suspended sediment in the Fuzhou reach of the Minjiang River for a recent 20-year period, indicating the applicability of quantitative models of suspended solids; Li et al. (2009) analyzed the process and causes of suspended sediment transport in the ME in the flood season according to in-situ measured data of spring tides. Based on the suspended sediment data in flood and dry seasons, Zhao et al. (2012) discussed the distribution features of suspended sediment in the lower reaches of the Minjiang River and estuary, determining the location of the TMZ. Gong et al. (2017) investigated the seasonal variation characteristics and interfering factors of suspended solids in the ME. However, existing studies mainly focus on the mechanism underlying the short-term transport of suspended sediments (Abascal-Zorrilla et al., 2020; Azhikodan and Yokoyama et al., 2021; Dunn et al., 2021; Wang, 2021); the long-term spatiotemporal evolution of the TMZ remains relatively unexplored (Jalón Rojas et al., 2021), making it difficult to understand the influence of natural and human disturbance on the long-term evolution of the TMZ in the estuary (Yang et al., 2015). In particular, there are few relevant studies on small-sized mountainous macrotidal estuaries.
The surface suspended sediment concentration (SSSC) retrieved via remote sensing data provides a broader spatiotemporal scale for the study of TMZs (Boyd, 2009; Jiang et al., 2013; Qiao et al., 2014; Wackerman et al., 2017; Teng et al., 2018; Luo et al., 2021). Given the foregoing, this study described the spatiotemporal variation features of hydrodynamic conditions and suspended sediment characteristics in the ME during the flood season through selected multi-phase GF-1 and Landsat satellite remote sensing images. Then, we expounded on the evolution pattern of TMZ. The results of this study will provide a reference for further studies on the evolution mechanism of TMZs in small- and medium-sized mountainous macrotidal estuaries, guiding estuarine management.

2 Materials and methods

2.1 Study area

The Minjiang River, which discharges into the Taiwan Strait in the East China Sea, is the largest river on the southeast coast of China (116°23°-119°35°E, 25°23°-28°16°N), with a total length of 577 km. It belongs to a water system with abundant water and minimal sediment, with a mountainous macrotidal estuary. The tidal type is a regular semidiurnal tide, with a mean tidal range > 4 m (Li et al., 2009). It has been discovered that the tidal limit has been extended by 10 km from Houguan up to the Zhuqi Hydrological Station, the basic control station of the mainstream of the Minjiang River (Jiang and Zheng, 1997). According to the observation data of Zhuqi Station, the average runoff from 2009 to 2019 was 4.89 × 10¹⁰ m3, and the runoff from April to September, the flood season, accounted for about 75% of the total water volume of the whole year. The downstream tidal reach is separated by Langqi Island, divided into the South and North branches. The South Branch is called the Meihua Waterway. The North Branch bypasses the north side of Langqi Island, passing through Guantou and Changmen, and is named the Changmen Waterway. The downstream of Changmen is further divided into the Wuzhu, Yundou, Chuanshi, and Hujiang waterways, which flow into the East China Sea, forming a complex river network with five outlets into the sea. Among these, the Chuanshi Waterway is currently the main waterway (Figure 1). Since 1952, several channel regulation projects have been undertaken in the lower reaches of the Minjiang River, which have changed the hydrodynamic conditions in the area, reducing the amounts of sediments from beaches and riverbeds (Zheng, 2005). Since the implementation of the Shuikou Dam and other reservoirs, the amount of incoming sediment has dropped sharply. Table 1 shows the main project information of the Minjiang River Basin.
Figure 1 Map showing the study area, with (a) the location of the Minjiang Estuary, China; (b) the lower reaches of Minjiang River; (c) the Minjiang Estuary
Table 1 Main project information of the Minjiang River Basin
Project name Position Time
Flood embankment construction Zhuqi to Mawei in the lower reaches of the Minjiang River Construction started in 1954 and expanded after 1986
Yunlong reclamation (aquaculture) East of the Langqi Island 1972 (Rebuilt in 1997)
River spur dike regulation works Houguan to Huai’an The 1980s
Minjiang Waterway Regulation Phase I Project NW dam 1981-1987
Bat Island Reclamation (non-agricultural) Houyu Township, Changle District 1988
Shuikou Reservoir Construction Middle section of the mainstream of the river 1987-1996 (Water storage began in 1993)
River sand mining The North Channel 1990s (Banned in 1998)
Minjiang Waterway Regulation Phase II Project YSC submerged dam, NL, N4-N6, SW, S3, S4 dam 1991-1998
River sand mining The South Channel After 1998
Entrance bar regulation project N7, NW2 dam 2005-2008
Minjiang South Channel Regulation Project The South Channel 2010
Minjiang Waterway Regulation Phase III Project From the Qixing reef to Mawei Construction started in 2017

2.2 Datasets and data processing

2.2.1 Selection of remote sensing images and surface suspended sediment concentration estimation

GF-1 PMS/WFV and Landsat 5 TM images were selected to retrieve the SSSC distributions in the ME during the flood tide in the flood season from 1986-2020. GF-6 WFV and Landsat 8 OLI images in 2021 were used to validate the SSSC estimation and flow regime interpretation model. The selected image information is shown in Table 2. Landsat datasets were downloaded from the United States Geological Survey (USGS) Earth Explorer website (http://earthexplorer.usgs.gov/), and GF-1 datasets were downloaded from China Centre for Resources Satellite Data and Application (http://www.cresda.com/). Because the Minjiang River Basin is greatly affected by runoff and tidal currents, the spatial distribution of the SSSC differs during flood and ebb tides, spring and neap tides, and flood and dry seasons. To comparatively analyze the interannual variation in the spatial distribution of the TMZ, three images with similar tidal conditions and capture times were selected. Four images were used to get flow direction information of the Chuanshi Waterway during flood and ebb tide. The tidal data of the Chuanshi tidal gauge station was used as a reference for image acquisition time. Furthermore, the instantaneous remote sensing image-derived SSSC of three periods is not sufficiently robust to reveal the long-term evolution of the TMZ. Therefore, we obtained all Landsat series images of the flood season (from April to September) of the target year through the Google Earth Engine (GEE) platform (https://earthengine.google.com). The calculated annual average SSSC images helped reveal the long-term evolution of the TMZ in the ME. Specifically, we used the Landsat-TM/ETM+/OLI radiometrically and geometrically calibrated top-of-atmosphere reflectance data as primary images, with a constraint cloud score of < 10. The image selection dates were extended over the period one year before and after the target year; see Table 3 for details. After the Landsat image selection procedure, the annual average values of SSSC were estimated.
Table 2 Instantaneous images of the ME from 1986 to 2021 and tidal conditions during mapping time
Serial
number
Imaging
date
Mapping
time (GMT)
Sensor Path/Row Spatial
resolution
Flood/Ebb Tidal range
(m)
1 1986-07-25 1:54:58 Landsat 5 TM 119/42 30 m Flood tide 4.5
2 2003-08-02 2:03:07 Landsat 5 TM 118/42 30 m Flood tide 4.3
3 2020-08-24 2:49:45 GF1 PMS2 595/113 8 m Flood tide 4.8
4 1989-06-15 2:00:26 Landsat 5 TM 119/42 30 m Ebb tide 3.7
5 2020-06-16 3:00:26 GF1 WFV4 653/113 16 m Ebb tide 3.5
6 2021-12-07 3:19:14 GF-6 WFV 598/84 16 m Flood tide 4.9
7 2021-12-16 2:33:07 Landsat 8 OLI 119/42 30 m Ebb tide 4.0
Table 3 Landsat series image datasets available on the online GEE platform from 1985 to 2021 in the ME. Note that year(s) represents the temporal magnitude of the datasets used.
Year(s) Data Month(s) Spatial
resolution
Temporal
resolution
Data sources
1985-1987 Landsat 5 April to September 30 m 16 days http://earthexplorer.usgs.gov/.
Data available online (https://earthengine.google.com)
2002-2004 Landsat 5/7
2019-2021 Landsat 7/8
All remote sensing images were radiometrically and geometrically calibrated. The specific formulas of radiometric calibration are as follows:
$L=\text{gain}\times DN+\text{bias}$
$\rho \text{=}\pi Ld_{s}^{2}/\left( {{E}_{0}}\cos \theta \right)$
where L is the radiance of the images, and DN is the original digital number. The gain and bias were from the header file. In addition, ρ is the reflectivity of objects on the earth, ds is the astronomical distance between the sun and the earth, E0 is the solar irradiance, and θ is the zenith of the sun.
The FLAASH module in ENVI software was used for atmospheric correction to obtain the reflectivity of the water body. The 550 nm and 670 nm bands are sensitive to suspended sediment content. The 550 nm band is saturated when the concentration reaches a certain threshold, while the 670 nm band is a good indicator of higher suspended sediment concentration and is a high chlorophyll absorption band. Therefore, the contribution of suspended sediment reflection can be highlighted using the ratio of these two bands. Finally, the 550 nm and 670 nm bands were selected to calculate the suspended sediment concentration (SSC) index X. The specific formula is as follows:
$X\text{=}\left[ {{R}_{W}}\left( {{\lambda }_{550}} \right)+{{R}_{W}}\left( {{\lambda }_{67\text{0}}} \right) \right]*\left[ {{R}_{W}}\left( {{\lambda }_{6\text{70}}} \right)/{{R}_{W}}\left( {{\lambda }_{550}} \right) \right]$
where RW(λi) is the atmospherically corrected remote sensing reflectance at the wavelength of i nm. The relationship between the index and SSC (Han et al., 2006) is as follows:
${{\log }_{10}}S=0.892+6.2244X$

2.2.2 Delineation of the turbidity maximum zone

In this study, the area where the median SSSC value significantly exceeds that of the adjacent waters in the remote sensing image inversion result is called the TMZ. Due to the sediment retaining effect of large-scale projects in the Minjiang River Basin, particularly that of the Shuikou Dam, the sediment inflow into the basin continues to decrease. To avoid the influence of the interannual variation of the SSSC on the relative delineation of the TMZ, the SSSC values obtained from images were converted to relative SSSC (RSSSC) values (Teng et al., 2021). The area where the RSSSC >1 is defined as the TMZ.
${S}'=S/\bar{S}$
where $\bar{S}$is the area-averaged SSSC of the region, S is the SSSC derived from the remote sensing image, and S′ is the RSSSC.
In order to explore the evolution law of the TMZ under high human interference, such as that in the large-scale channel regulation project, we selected the area from the entrance of the Changmen Waterway to the Minjiang Waterway channel as the core area, obtained the RSSSC in this area, drew the longitudinal profile distribution map of the RSSSC along the Minjiang Waterway channel, and finally used a semi-quantitative method to analyze the long-term evolution characteristics and mechanism of the TMZ in the Minjiang Waterway channel during the flood season.

2.2.3 In-situ observations of flow regime and surface suspended sediment concentration

The flow regime and SSSC were observed during December 2021. Eight observation stations were set up in the mouth of the ME to outside the mouth to collect water samples (Figure 1). The vertical water depth and turbidity data were observed using an OTS (Optical Test Station) 200 and RBR-TU. The in-situ velocity and flow direction data were measured using an ADCP (acoustic doppler current profiler). Among them, the vertical profiles of the SSSC and flow regime over 13 h were observed continuously at two stations on-site. Water samples were filtered, dried, and then re-weighed to estimate the amount of suspended sediments and obtain the SSSC. The turbidity measured by OTS and RBR-TU and the SSSC of the water sample measured simultaneously were calibrated by constructing a linear correlation curve (Figure 2), and the obtained SSSC data were used to validate SSSC (Novoa et al., 2017).
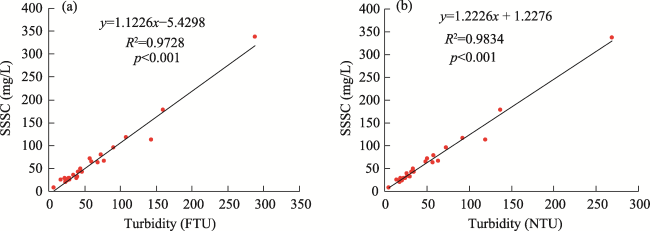
Figure 2 Correlation curves of OTS and RBR-TU turbidity and SSSC: (a) OTS turbidity calibration; (b) RBR-TU turbidity calibration

2.2.4 Enhancement and interpretation of flow direction

The Gabor filter is a commonly used texture extraction method (Qiao et al., 2014). It implements the multi-scale and multi-directional features of the Gabor wavelet to analyze images and extract texture features (Teng et al., 2018). The image enhancement processing based on the Gabor filter was implemented in MATLAB 2019a, and the filtered images with significant characteristics in different directions were obtained by changing the direction and angle of the filter. Then, the comprehensive filtered image was obtained by superimposing the filtered images of all directions, and the streamline information in the image was extracted by a visual interpretation method to extract flow direction data of the Chuanshi Waterway. Finally, the in-situ flow direction data was used to verify the interpretation data.

2.2.5 Data analysis and accuracy assessment

The mean absolute percentage error (MAPE), root mean square error (RMSE), and correlation coefficient (r) were used to evaluate the performances of the SSSC estimation and flow regime interpretation models. The MAPE and RMSE are described as:
$\text{MAPE}=\frac{1}{n}\sum\limits_{i=1}^{n}{\left| \frac{{{x}_{i}}-{{y}_{i}}}{{{y}_{i}}} \right|}\times 100%$
$\text{RMSE}=\sqrt{\frac{1}{n}\sum\limits_{i=1}^{n}{{{\left( {{x}_{i}}-{{y}_{i}} \right)}^{2}}}}$
where xi and yi are the satellite-retrieved SSSC and in situ-measured SSSC for the i-th sample, respectively, and n is the number of samples.

2.2.6 Validation of surface suspended sediment concentration and flow regime for satellite images

The in-situ SSSC and flow regime data at the ME during the ebb and flood tides of the dry season in 2021 were selected for comparison with the SSSC estimation and flow regime interpretation data retrieved from the Landsat 8 OLI and GF-6 WFV images. The results show that the satellite-derived SSSC agreed well with the in-situ measurements (Figure 3a). The in situ-measured and satellite-retrieved SSSC were distributed close to the 1:1 line and had an R2 of 0.9887, MAPE of 18.18%, and the RMSE was 7.99 mg/L, which proved the reliability of the SSSC estimation model used in the ME. In addition, the flow regime data interpreted by the image was in good agreement with the in-situ flow regime data (Figure 3b). The in-situ measured and interpreted flow direction data were distributed along the 1:1 line, with an R2 of 0.9846, MAPE of 5.76%, and RMSE of 11.88°, indicating that the constructed flow regime interpretation model had strong applicability. The interpreted flow direction data could satisfy the study of flow regime evolution in the ME.
Figure 3 Comparison between satellite retrieved and in-situ SSSC in the ME in 2021: (a) the scatter plot of the SSSC inversion model; (b) the scatter plot of the flow regime interpretation model

3 Results

3.1 Distribution and variation characteristics of surface suspended sediment concentration during flood tide in the flood season

The inversion results of SSSC in every single phase (Figure 4) showed that the spatial distribution characteristics of the SSSC in the ME during the flood tide in the flood season in different years were relatively similar. From Tingjiang to the open sea through the estuary, there was an area of high SSSC values. In the sections from the Changmen to the Chuanshi and Meihua waterways, it was significantly higher than in the upstream and downstream sections, indicating that the TMZ in the ME was mainly distributed in the sections from the Changmen to the Chuanshi and the Meihua waterways. Besides, the runoff and offshore sediment transport were superimposed in this area. Among them, the SSSC in the Meihua waterway was significantly high, contributing to the formation and development of sand bars such as bergamot, eel, and outer sand shoals. The upstream reach of the TMZ was dominated by runoff. During the flood season, the sediment carrying capacity of the water body increased, and the SSSC increased gradually. The downstream reach was affected by the tidal current, and the suspended solids in the adjacent sea areas were transported. Therefore, the SSSC from the TMZ to the adjacent sea areas showed a gradually decreasing trend.
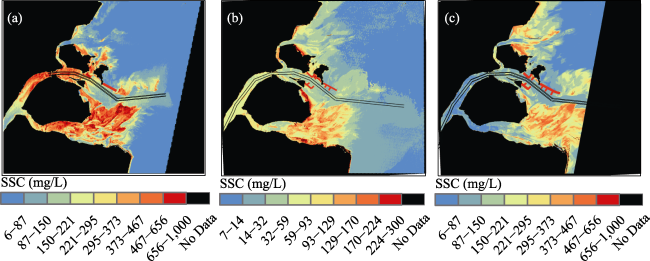
Figure 4 The spatial distribution of the SSSC in the ME on 1986-07-25 (a); 2003-08-02 (b); 2020-08-24 (c)
When comparing the inversion results of the SSSC in the ME, significant differences were discovered in the spatial distribution of suspended sediment in the ME from 1986 to 2020. The decrease of the SSSC at Chuanshi Station (Bajiaowei) was 65 mg/L. In 1986, the SSSC in the ME was the highest overall. The high-value areas of the SSSC were distributed in the upstream and downstream reaches of Jinpaimen (the junction of the Changmen and Chuanshi Waterway) and downstream of Fuqi (where the Minjiang River enters the Meihua Waterway). In addition, the SSSC at the estuary of the Chuanshi Waterway was high. In 2003, the SSSC mostly decreased, and the SSSC in Bajiaowei reached 32 mg/L. Apart from the high-value SSSC area in the Meihua Waterway, the high-value area of SSSC was mainly located in the section from Tingjiang to Jinpaimen, which was closer to the riverside than in 1986. There was still a similar area with a slightly higher SSSC at the estuary of the Chuanshi Waterway. In 2020, the average SSSC of the ME increased, and in the Bajiaowei, it increased to 135 mg/L. The high-value area of the SSSC was distributed in the Meihua Waterway, and the distribution range moved notably toward the sea. There was no area with a significantly high SSSC in the Changmen Waterway; the SSSC was only slightly distributed in the Chuanshi Waterway. Generally, the diffusion range of suspended sediments was wider and showed the characteristics of being diffused into the sea.
The possible reasons for the decrease in the SSSC of the ME include the following aspects: First, the change of sediment load under the comprehensive influence of natural evolution and human activities (Figure 5). In this study, linear fitting correlation analysis was carried out on SSSC, annual runoff, and annual sediment load. The results showed that the change trends of the fitting curve between SSSC and annual sediment load were relatively consistent, further verifying the correlation between SSSC and river sediment load. The sediment load in 1986 was as high as 4.45 × 10⁹ kg, much higher than 6.44 × 10⁸ kg in 2003. This reduction occurred after water storage in the Shuikou Reservoir in 1993 and due to downstream sand mining activities. The difference in sediment transport was more significant during the flood season; it was the main reason for the significant reduction of the high-value SSSC areas in the ME after 1993. In 2020, the monthly runoff in the flood season was more abundant than in previous years, the runoff effect was enhanced, and the sediment loads from upstream areas were greatly increased, resulting in an overall increase in the SSSC and a notable downward movement of the high-value area in 2020 (i.e., moving seaward)11 The annual sediment transport and monthly runoff data are from China river sediment bulletin.). The second is the impact of the estuary project. The waterway deepening, waterway regulation, and reclamation projects have changed the hydrodynamic conditions of the estuary (Figure 1c). Third, affected by the instantaneous tidal level during image acquisition, the tidal ranges of the three images were similar, all about 4.5 m. However, the instantaneous tidal levels were slightly different. The tidal level in the image from 1986 was lower than those in images from 2003 and 2020. At low tide, the tidal effect of the estuary was weakened, the runoff effect was strong, and the hydrodynamic conditions were complex due to the influence of topography. As a result, the area with a high SSSC was closer to the seaward side than that in 2003. In addition, the area where the SSSC increased slightly at the estuary of the Chuanshi Waterway was the area where the entrance bar of the ME was easily formed and developed. It was found that the SSSC at the entrance of the Chuanshi Waterway did not increase significantly in 2020. It was speculated that the reason was the joint effect of the enhancement of daily runoff and the implementation of the entrance bar channel deepening and channel regulation projects.
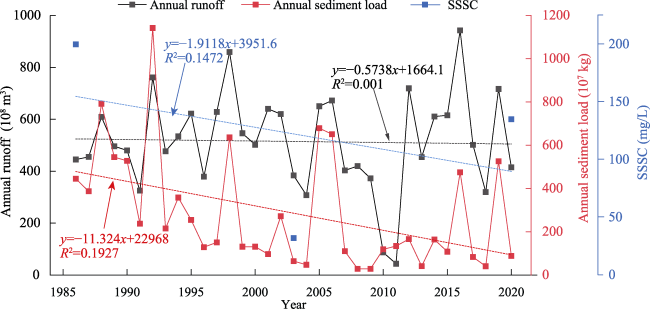
Figure 5 Changes in annual runoff and annual sediment load at Zhuqi Hydrological Station and SSSC at Chuanshi Station (Bajiaowei) of the Minjiang River from 1986 to 2020. Note that SSSC refers to the SSSC in the ME on 1986-07-25, 2003-08-02, and 2020-08-24.

3.2 Seaward movement of the turbidity maximum zone during flood tide in the flood season

Combined with the RSSSC distribution (Figures 6a-6c) and the longitudinal profile distribution (Figures 6d-6f), the TMZ in the main channel of the ME exhibited obvious migration during the flood tide in the flood season over the last 35 years. It generally showed a trend of moving to the sea for a distance of approximately 3 km. Specifically, the TMZ of the ME in 1986 was in the upstream and downstream reaches of Jinpaimen. If the tidal regime difference of the three-phase images is considered, the TMZ during the maximum flood velocity occurring in 1986 should be moved up by an appropriate distance. Affected by the impoundment of the Shuikou Reservoir and the reduction of water and sediment from upstream areas, the TMZ in the ME moved slightly upward (toward the riverside) in 2003 compared with that in 1986. It was mainly located in the section from Tingjiang to Jinpaimen, and the lower boundary moved upward by about 5.5 km. There was an area with a high ASSSC at the estuary of the Chuanshi Waterway, which was thought to be a zone where bars developed easily in the ME. In 2020, the high RSSSC area of the TMZ in the ME was not obvious, and its distribution range expectedly moved downward, about 2.5 km lower than the upper boundary in 1986 and about 3 km lower than the lower boundary. The TMZ was mainly distributed in the section from the Chuanshi Waterway to the outer estuary. Generally, the diffusion range of the TMZ was wider. In addition, there was a small area with a high RSSSC near the spur dike of the Chuanshi Waterway, corresponding to the development of internal sand shoals. Therefore, the migration of the TMZ may have a certain influence on the layout of the sea channel regulation project.
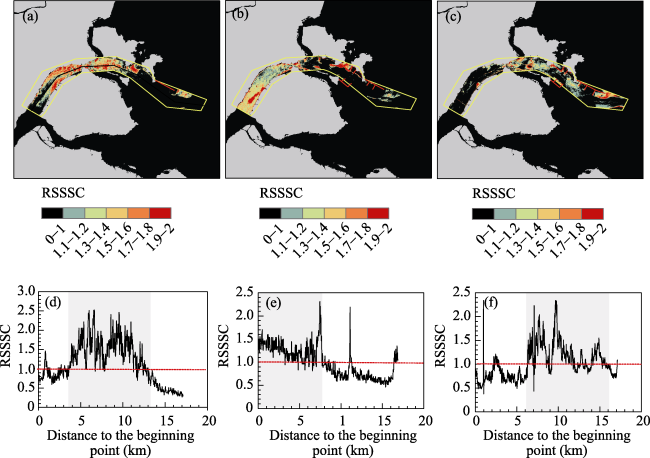
Figure 6 The spatial distribution (a-c) and longitudinal profile distribution (d-f) of the RSSSC in the ME waterway channel during the flood tide in the flood season on 1986-07-25 (a, d); 2003-08-02 (b, e) and 2020-08-24 (c, f)

3.3 Interannual variation of annual surface suspended sediment concentration and turbidity maximum zone in the flood season

The SSSC derived from the instantaneous remote sensing images of the three periods is subject to great uncertainty due to various uncertain factors such as runoff, tidal level, and sediment supply. Therefore, based on the images of the flood season from 1984 to 2021, the interannual variation of the annual average SSSC and the TMZ in the flood season of the ME were analyzed.
The inversion results of the annual average SSSC in the ME in the flood season (Figures 7a-7c) showed that the annual average SSSC in the ME in the flood season showed a downward trend from 1986 to 2020, which was consistent with the changing trend of the SSSC during flood tide in the flood season. The annual average SSSC at Chuanshi Station (Bajiaowei) decreased by 68 mg/L over the last 35 years. In 1986, the annual average SSSC was the highest, reaching 167 mg/L. The high-value areas of the annual average SSSC were distributed in the Changmen Waterway (upstream reaches of Jinpaimen) and the Meihua Waterway. Since then, the annual average SSSC has gradually decreased, reaching 160 mg/L in 2003 and dropping to 99 mg/L in 2020. The high-value SSSC area was mainly distributed in the Meihua Waterway and partially distributed in the Chuanshi Waterway (downstream reaches of Jinpaimen).
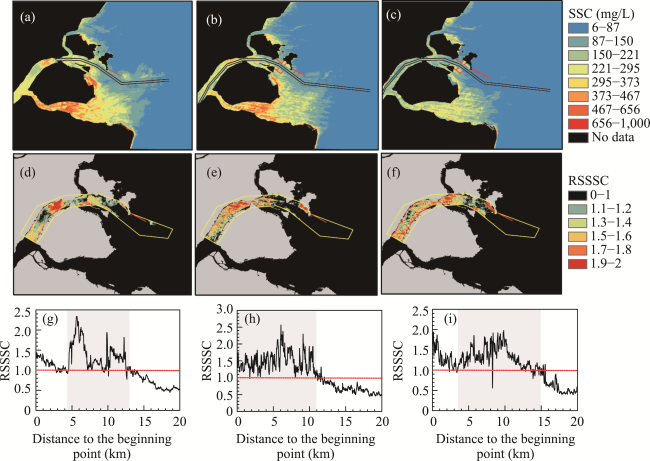
Figure 7 The spatial distribution of the annual average SSSC (a-c), RSSSC (d-f) and its longitudinal profile distribution (g-i) in the flood season of 1986 (a, d, g); 2003 (b, e, h) and 2020 (c, f, i) in the ME
The RSSSC distribution (Figures 7d-7f) and the longitudinal profile distribution (Figures 7g-7i) showed that, in the last 35 years, during the flood season, the TMZ in the main channel of the ME exhibited obvious migration, generally moving seaward, with the lower boundary moving down by about 2 km. Of note, the diffusion range of the TMZ was wider. The variation characteristics were consistent with the TMZ during flood tide in the flood season. In 1986, the TMZ was located near the upper reaches of Jinpaimen. In 2003, the TMZ moved slightly toward the riverside due to the reduction of water and sediment from upstream areas, and the lower boundary moved up by about 2 km. In 2020, the TMZ moved downward overall, about 2 km lower than the lower boundary in 1986, mainly distributed in the Chuanshi Waterway near the downstream of Jinpaimen.

3.4 Convergence of flow regime in the ME in the flood season

During the flood tide in the flood season (Figures 8a-8d) in 2020, the stream boundary in the Chuanshi Waterway was more convergent, the flow direction more concentrated, the flow velocity increased, and the flow direction of the flood current in the waterway tended to be centralized, enhancing the tidal effect. The Minjiang Waterway regulation phase II project and the entrance bar regulation project extended the north dikes NW, N4-N6, and the south dikes SW, S3, and S4, set up fixed boundaries outside the mouth, and appropriately narrowed the water channel width. Compared with the first phase regulation project, adverse factors such as the diffusion of water flow outside the mouth and the divergence of the current flood path in the channel were alleviated, and the hydrodynamic conditions in the main channel were improved; these conditions were conducive to the maintenance of channel water depth. During the ebb tide in the flood season (Figures 8e-8h), the streamline in the Chuanshi Waterway in 2020 was denser than that in 1989; the ebb tide current direction was more concentrated, straighter, and closer to the navigation direction of the waterway. The evolution process of ebb current direction showed that after the implementation of the Minjiang Waterway regulation phase II and the entrance bar regulation project, the regulation effect was good, the diffusion degree of flow outside the mouth was reduced, and the problem of divergence of the ebb flow path in the channel was significantly improved. In addition, the evolution of the TMZ was bound to form a corresponding response mechanism to the straightening and narrowing of the river channel after the regulation of the artificial channel, showing that the upward and downward migration ranges of the TMZ tend to become larger, ultimately influencing the channel regulation and dredging project.
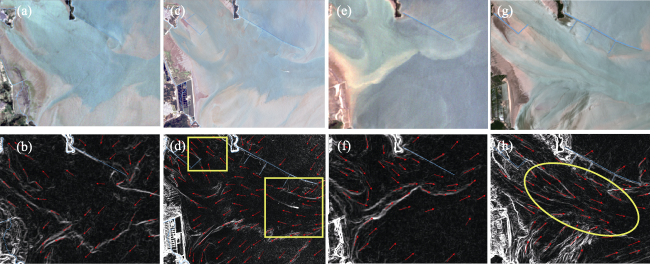
Figure 8 Images and flow direction of Chuanshi Waterway during flood tide (a-d) and ebb tide (e-h) in the flood season on 1986-07-25 (a, b); 2020-08-24 (c, d); 1989-06-15 (e, f) and 2020-06-16 (g, h)

4 Discussion

4.1 Evolution characteristics of the turbidity maximum zone in mountainous macrotidal estuaries

The ME is a typical macrotidal estuary with mountain stream characteristics. It differs from large estuaries such as the Yangtze River Estuary and the Pearl River Estuary (Zhu, 1986; Shen et al., 2001). Its development is restricted by the mountains and bedrock, with large differences in river channel shape, small riverbed volume, steep bottom slope, and short tidal current limit. Although the river water volume is high, the interannual variability is large, and the annual distribution is extremely uneven (Figure 5). Thus, the interannual or seasonal differences in runoff and tidal currents are more significant than those in large estuaries. The above are the main natural factors that render the evolution characteristics of the TMZ in small and medium-sized mountainous macrotidal estuaries different from those in large estuaries. The difference in the interaction strength between runoff and tidal currents causes the terrigenous sediment (mainly bed sediment) from runoff to mix and interact with sea-source sediment (mainly suspended sediment) from offshore regions under the action of tidal currents, significantly affecting the scale and location of the TMZ (Shen et al., 2001; Zhao et al., 2012). This area maintains a balance of dynamic conditions, and the sediment resuspension effect is strong here. Therefore, the SSSC in TMZs is significantly higher than in upstream or downstream areas. In this study, we found that under the condition of stable tidal sediment transport, the changing trend of the SSSC and runoff sediment load in mountainous macrotidal estuaries in flood season was basically the same, showing a downward trend (Figure 9a). According to the correlation analysis between the SSSC and annual sediment load in different regions, from the inside to outside of the ME, the SSSC gradually shifted from runoff-dominated to tidal-dominated (Figure 9b). The change of the SSSC in the Tingjiang was the most synchronized with the annual sediment load. The correlation is the highest, followed by Changmen. In Hujiang and Bajiaowei, the influence of the tidal sediment load was increased, and the influence of the runoff was weakened.
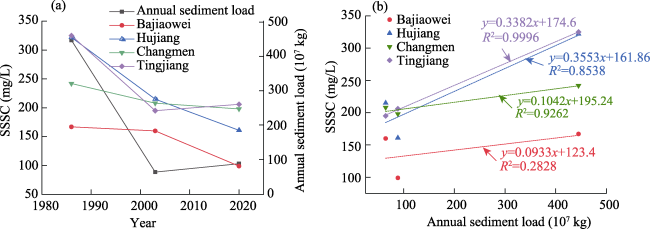
Figure 9 Changes (a) and correlations (b) between the annual average SSSC and annual sediment load in the flood seasons of 1986, 2003, and 2020 in the ME. Note: The selected locations are from inside to outside the estuary: Tingjiang, Changmen, Hujiang, and Bajiaowei.
Specifically, the shape of the ME is a trumpet shape, limited by two geological fault zones, with the riverbed shape being extensively branched (Zhu, 1991). The Changmen Waterway and the upstream waterway flow in the same direction, so the runoff effect is strong, and the interaction between runoff and tidal current has a profound impact. Therefore, due to the influence of interannual runoff and water distribution in the flood and dry seasons, the upward and downward migration of the TMZ in the Changmen Waterway and its downstream waterway are more significant than the migration in the Meihua Waterway. In the case of a catastrophic flood, the SSSC in the TMZ would be significantly reduced and may be expelled from the entrance. However, the Meihua Waterway is at a large angle with the upstream waterway, so the runoff effect is weak. Accordingly, the tidal current is stronger, and the flood current is the dominant tidal current. This affects the development and evolution of the sedimentary geomorphology in the Meihua Waterway (Liu et al., 2001; Li et al., 2009). The flood current carries a large amount of suspended sediment upwards. Therefore, the distribution range of the TMZ in the Meihua Waterway is mostly stable during the flood tide in the flood season; its SSSC is always high, with only small upward and downward migration characteristics.

4.2 Response of the turbidity maximum zone evolution to large-scale engineering construction

The study indicates that with the interaction of the natural environment and human interference, the flow regime in the flood season of the ME has tended to converge in the last 35 years. The tidal current direction in the channel was more convergent and concentrated, and the tidal current effect was enhanced, indicating that the regulation effect of the multi-phase Minjiang Waterway regulation project and the entrance bar regulation project was remarkable. The river channel showed a scouring trend, and the problem of flow path divergence in the channel has been improved (Figures 10a-10b). Compared with 1985, the water depth of the ME waterway channel increased significantly in 2018, and the average scour range reached 3.28 m (Figure 11). However, the dynamic conditions have changed significantly after the implementation of large-scale projects such as the ME Waterway Deepening Project. The construction of artificial river channels, dredging of water channels, and narrowing and straightening of channels have enhanced the runoff and tidal currents of the Minjiang River, intensifying the complexity of the hydrodynamic environment of the estuary. This inevitably has an irreversible impact on the long-term evolution of the TMZ in the estuary; that is, the change scale of the TMZ increased, leading to significant changes in riverbed scouring and silting in the ME over the years (Figure 10c). Generally, the ME was mainly scoured. However, in the case of a substantial reduction in the amount of sea sediment loads, local siltation occurred in areas outside the waterway channel, such as internal sand and consolidated sand, which was evidently affected by the silt intercepted by man-made dikes.
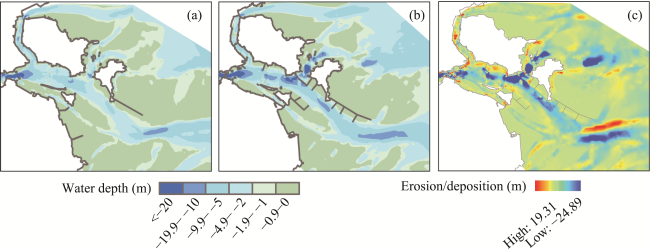
Figure 10 Geomorphology and erosion and deposition map of the ME from 1985 to 2018 (positive silting and negative scouring): (a) Subaqueous topography in 1985; (b) subaqueous topography in 2018; (c) erosion/deposition map
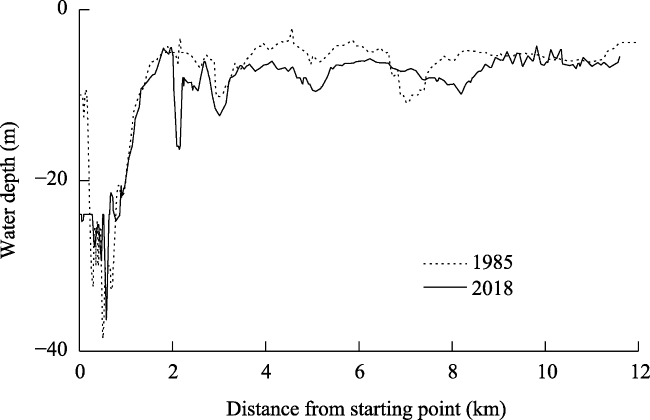
Figure 11 Longitudinal changes of thalweg in the ME waterway channel from 1985 to 2018
In recent years, the construction of upstream reservoirs of different sizes, such as the Shuikou Reservoir, has resulted in decreased runoff and peak discharges and a decrease in the amount of sediment from upstream areas. Coupled with strong tidal support, the TMZ in the ME tends to migrate further upstream due to this influence. Taking the aforementioned human activities into account, the evolution of the TMZ might establish corresponding mechanisms in response to changes in dynamic conditions after the implementation of large-scale engineering construction projects; for example, the sediment blocking effect after the construction of Shuikou Reservoir and the straightness and narrowing of the river channel after artificial channel regulation.
Based on the analysis, the specific conclusion of this study is that the evolutionary response of the TMZ to human interference, such as large-scale engineering construction, is characterized by upward and downward migration ranges of the TMZ that tends to become larger as its position tends to move seaward during the flood season. However, the influence degree and mechanisms of natural factors and man-made transformation forces on the evolution of estuarine TMZ and their specific response relationship, along with the influence of the TMZ on the above factors, still require further investigation.

5 Conclusions

Based on the SSSC data retrieved from GF-1 PMS/WFV and Landsat-TM multi-source remote sensing images, the long-term spatiotemporal evolution characteristics of the TMZ in the ME during the flood tide in the flood season from 1986 to 2020 were analyzed. The flow direction of the Chuanshi Waterway was interpreted using a Gabor filter, and the influence of human disturbances such as the Shuikou Reservoir and the waterway regulation project on the spatiotemporal evolution of the TMZ in this region was discussed. The main conclusions are listed below:
(1) Since 1986, the TMZ in the ME was distributed in sections from the Changmen to the Chuanshi and Meihua waterways. The construction of the Shuikou Reservoir has led to an overall drop of 65 mg/L in the SSSC at the Chuanshi Tidal Gauge Station in the ME. The high-SSSC area shifted to the river first and then to the sea; this is mainly due to changes in the transport of water and sediment from the estuary under the influences of natural evolution and human activities, estuary engineering, and instantaneous tidal levels during image acquisition.
(2) During flood tide in the flood season in the last 35 years, the TMZ in the ME waterway channel exhibited notable migration to the sea, which was caused by the waterway regulation project, with the landward boundary moving 2.5 km seaward and the seaward boundary moving 3 km toward the sea. The main distribution area had moved from the vicinity of Jinpaimen to the section from the Chuanshi Waterway to the mouth of the ME. The migration of the TMZ affects the formation and development of estuarine shoals and may affect the layout of waterway regulation projects.
(3) Under the interactions between nature and human intervention, the flow regime of the ME in the flood season tended to converge, and the tidal current tended to be straighter. The above phenomena show that regulation was effective after the waterway regulation project and the entrance bar were implemented, ultimately improving the problem related to flow path divergence in the waterway.
Therefore, human activities, such as waterway regulation projects and reservoir construction, significantly impacted the long-term evolution of the TMZ in the ME.

Acknowledgments

We acknowledge State Key Laboratory of Estuarine and Coastal Research (SKLEC) of East China Normal University for supplying field measurements for water level, turbidity, velocity and flow direction in the Minjiang Estuary and we thank Zhang Jing, Zhang Wenxiang, Yu Haisheng, Liu Xiaoqiang and others from SKLEC and Yu Junjie from Nanjing Geological Survey Center, China Geological Survey for facilitating and/or assisting with fieldwork.
[1]
Abascal-Zorrilla N, Vantrepotte V, Huybrechts N et al., 2020. Dynamics of the estuarine turbidity maximum zone from Landsat-8 data: The case of the Maroni River Estuary, French Guiana. Remote Sensing, 12(13): 2173.

DOI

[2]
Azhikodan G, Yokoyama K, 2021. Erosion and sedimentation pattern of fine sediments and its physical characteristics in a macrotidal estuary. Science of the Total Environment, 753(1): 142025.

DOI

[3]
Bao H, Lee T, Huang J et al., 2015. Importance of oceanian small mountainous rivers (SMRs) in global land-to-ocean output of lignin and modern biospheric carbon. Scientific Reports, 5(1): 16217.

DOI

[4]
Boyd D S, 2009. Remote sensing in physical geography: A twenty-first-century perspective. Progress in Physical Geography, 33(4): 451-456.

[5]
Chen H, 2008. Safety assessment for navigational environment of Fuzhou Port Minjiang Seaward Channel. Navigation of China, 31(1): 63-66. (in Chinese)

[6]
Chen J, Yu X G, Li D Y et al., 2010. Submarine geomorphic evolution and genesis of Minjiang Estuary in recent 100 years. Ocean Engineering, 28(2): 82-89. (in Chinese)

[7]
Dunn R J K, Glen J, Lin H et al., 2021. Observations of suspended particulate matter concentrations and particle size distributions within a macrotidal estuary (Port Curtis Estuary, Australia). Journal of Marine Science and Engineering, 9(12): 1385.

DOI

[8]
Glangeaud L, 1938. Transport of sedimentation Chlans l'estuare et l'embouchure de La Girronde. Bulletin of Geological Society of France, 109(8): 599-630.

[9]
Gong S B, Gao A G, Lin J J et al., 2017. Temporal and spatial distribution characteristics and influencing factors of suspended solids in the lower reaches of Minjiang River and its estuary. Journal of Geoscience and environment, 39(6): 826-836. (in Chinese)

[10]
Han Z, Jin Y Q, Yun C X, 2006. Suspended sediment concentrations in the Yangtze River estuary retrieved from the CMODIS data. International Journal of Remote Sensing, 27(19): 4329-4336.

DOI

[11]
Jalón Rojas I, Dijkstra Y M, Schuttelaars H M et al., 2021. Multidecadal evolution of the turbidity maximum zone in a macrotidal river under climate and anthropogenic pressures. Journal of Geophysical Research: Oceans, 126(5): e2020JC016273.

[12]
Jiang C J, Zheng H Z, 1997. Preliminary study on the causes of upward extension change of tidal zone in Minjiang Estuary. Water Conservancy Science and Technology, 20(4): 48-50, 23. (in Chinese)

[13]
Jiang W F, 2007. Deepening regulation project of Minjiang Estuary barrage channel. Port & Waterway Engineering, 32(12): 80-84. (in Chinese)

[14]
Jiang X Z, Lu B, He Y H, 2013. Response of the turbidity maximum zone to fluctuations in sediment discharge from river to estuary in the Changjiang Estuary (China). Estuarine Coastal and Shelf Science, 131(10): 24-30.

DOI

[15]
Kao S J, Hilton R G, Selvaraj K et al., 2014. Preservation of terrestrial organic carbon in marine sediments offshore Taiwan: mountain building and atmospheric carbon dioxide sequestration. Earth Surface Dynamics, 2(1): 127-139.

DOI

[16]
Le Xuan T, Vo Q T, Reyns J et al., 2019. Sediment transport and morphodynamical modeling on the estuaries and coastal zone of the Vietnamese Mekong Delta. Continental Shelf Research, 186(9): 64-76.

DOI

[17]
Lei S Q, 2018. Evaluation on the safety of vessel traffic in Minjiang channel of Fuzhou port[D]. Xiamen: Jimei University. (in Chinese)

[18]
Li D Y, Chen J, Wang A J et al., 2008. Recent progress in sediment transport research in minjiang estuary. Marine Science Bulletin, 27(2): 111-116. (in Chinese)

[19]
Li D Y, Chen J, Wang A J et al., 2009. Suspended sediment characteristics and transport in the Minjiang Estuary during flood seasons. Ocean Engineering, 27(2): 70-80. (in Chinese)

[20]
Li J F, Zhang C, 1998. Sediment resuspension and implications for turbidity maximum in the Changjiang Estuary. Marine Geology, 148(3/4): 117-124. (in Chinese)

DOI

[21]
Liu C Z, Jia H L, Chen X F, 2001. Sedimentary texture and sedimentation in the Minjiang River Estuary. Oceanologia et Limnologia Sinica, 32(2): 177-184. (in Chinese)

[22]
Liu R Q, Xu H, Li J L et al., 2020. Ecosystem service valuation of bays in East China Sea and its response to sea reclamation activities. Journal of Geographical Sciences, 30(7): 1095-1116.

DOI

[23]
Liu W, Fan D D, Tu J B et al., 2018. Study on suspended sediment transport characteristics and flux mechanism in Jiaojiang Estuary in spring. Marine Geology & Quaternary Geology, 38(1): 41-51. (in Chinese)

[24]
Luo W, Shen F, He Q et al., 2021. Changes in suspended sediments in the Yangtze River Estuary from 1984 to 2020: Responses to basin and estuarine engineering constructions. Science of the Total Environment, 805(1): 150381.

DOI

[25]
Milliman J, Syvitski J, 1992. Geomorphic tectonic control of sediment discharge to ocean: The importance of small mountainous rivers. Journal of Geology, 100(5): 525-544.

DOI

[26]
Novoa S, Doxaran D, Ody A et al., 2017. Atmospheric corrections and multi-conditional algorithm for multi-sensor remote sensing of suspended particulate matter in low-to-high turbidity levels coastal waters. Remote Sensing, 9(1): 61.

DOI

[27]
Pan D A, Xie Y L, Shen H T, 1991. Analysis on the hydrographic factors, sediments features and origin of the inner mouth-bar of the Chuanshi Channel in the Minjiang River mouth. Journal of East China Normal University (Natura Science), 37(1): 87-96. (in Chinese)

[28]
Qiao Y Y, Cheng H Q, Song Z K et al., 2014. Research on infornation semi-quantitation of estuarine flow pattern based on TM remote sensing image. Bulletin of Soil and Water Conservation, 34(5): 118-123.

[29]
Schubel J R, 1968. Turbidity maximum of the northern Chesapeake Bay. Science, 161(3845): 1013-1015.

PMID

[30]
Shen H T, He S L, Mao Z C et al., 2001. On the turbidity maximum in the Chinese estuaries. Journal of Sediment Research, 46(1): 23-29. (in Chinese)

[31]
Shen Q, Huang W, Wan Y et al., 2020. Observation of the sediment trapping during flood season in the deep-water navigational channel of the Changjiang Estuary, China. Estuarine Coastal and Shelf Science, 237(5): 106632.

DOI

[32]
Shi W R, Shen H T, Li J F, 1993. Review on the formation of estuarine turbidity maximum. Advance in Earth Sciences, 8(1): 8-13. (in Chinese)

[33]
Teng L Z, Cheng H Q, de Swart H E et al., 2021. On the mechanism behind the shift of the turbidity maximum zone in response to reclamations in the Yangtze (Changjiang) Estuary, China. Marine Geology, 440(4): 106569.

DOI

[34]
Teng L Z, Cheng H Q, Qiao Y Y, 2018. Analysis of flow regime in the turbidity maximum zone of Yangtze estuary based on texture features of Tiangong-2 remote sensing images. Proceedings of the Tiangong-2 Remote Sensing Application Conference, 541(12): 312-322.

[35]
Uncles R J, Stephens J A, Law D J, 2006. Turbidity maximum in the macrotidal, highly turbid Humber Estuary, UK: Flocs, fluid mud, stationary suspensions and tidal bores. Estuarine Coastal and Shelf Science, 67(1/2): 30-52.

DOI

[36]
Wackerman C, Hayden A, Jonik J, 2017. Deriving spatial and temporal context for point measurements of suspended-sediment concentration using remote-sensing imagery in the Mekong Delta. Continental Shelf Research, 147(SI):231-245.

DOI

[37]
Wang C Y, Zhou C H, Chen S S et al., 2021. Retrospect and perspective of the estuarine turbidity maximum zone researches. Chinese Science Bulletin, 66(18): 2328-2342. (in Chinese)

[38]
Wang W, Wang T Y, Cui W et al., 2021. Changes of flow and sediment transport in the lower Min River in southeastern China under the impacts of climate variability and human activities. Water, 13(5): 673.

DOI

[39]
Wen X L, Xu H Q, 2009. Remote sensing analysis of the spatial-temporal variations of suspended sediment in the lower Min River (Fuzhou portion) during the last two decades. Acta Scientiae Circumstantiae, 29(3): 648-654. (in Chinese)

[40]
Wu J X, Liu J T, Wang X, 2012. Sediment trapping of turbidity maxima in the Changjiang Estuary. Marine Geology, 303- 306(3): 14-25.

[41]
Yang Y, Deng J, Zhang M et al., 2015. The synchronicity and difference in the change of suspended sediment concentration in the Yangtze River Estuary. Journal of Geographical Sciences, 25(4): 399-416.

DOI

[42]
Yang Y, Li Y, Sun Z et al., 2014. Suspended sediment load in the turbidity maximum zone at the Yangtze River Estuary: The trends and causes. Journal of Geographical Sciences, 24(1): 129-142.

DOI

[43]
Zhang X Z, Chen X, Dou X P et al., 2019. Study on formation mechanism of turbidity maximum zone and numerical simulations in the macro tidal estuaries. Advances in Water Science, 30 (1): 84-92. (in Chinese)

[44]
Zhao D M, Gao A G, Li C et al., 2012. Distribution patterns of suspended particulate matters in the lower reach and estuary of the Minjiang River. Marine Geology Frontiers, 28(6): 35-39. (in Chinese)

[45]
Zheng B Y, 2005. Preliminary analysis on channel regulation project and effect of inner sand shoal at Minjiang Estuary in Fuzhou. China Ports, 20(3): 47. (in Chinese)

[46]
Zheng M F, 2005. Analysis on division ratio of bifurcated channel and riverbed evolvement of Minjiang River[D]. Nanjing: Hohai University. (in Chinese)

[47]
Zhu Y K, 1986. Some characteristics of the Jiaojiang mountain river estuary under strong tides in Zhejiang Province. Geographical Research, 5(1): 21-31. (in Chinese)

[48]
Zhu Y K, 1991. Characteristics, types and causes of braided riverbed in Minjiang Estuary. Acta Oceanica Sinica, 13(3): 363-370. (in Chinese)

Outlines

/