Research Articles

Latitudinal differentiation and patterns of temperate and subtropical plants in the Qinling-Daba Mountains

  • LIU Junjie , 1, 2 ,
  • ZHANG Baiping , 1, * ,
  • YAO Yonghui 1 ,
  • ZHANG Xinghang 1, 2 ,
  • WANG Jing 1, 2 ,
  • YU Fuqin 1, 2 ,
  • LI Jiayu 1, 2
Expand
  • 1. State Key Laboratory of Resources and Environmental Information System, Institute of Geographic Sciences and Natural Resources Research, CAS, Beijing 100101, China
  • 2. University of Chinese Academy of Sciences, Beijing 100049, China
*Zhang Baiping (1963-), Professor, specialized in physical geography and applied GIS. E-mail:

Liu Junjie (1995-), PhD Candidate, specialized in mountain geography and ecological environment. E-mail:

Received date: 2022-12-13

  Accepted date: 2023-01-30

  Online published: 2023-05-11

Supported by

National Scientific and Technological Basic Resources Investigation Project(2017FY100900)

Abstract

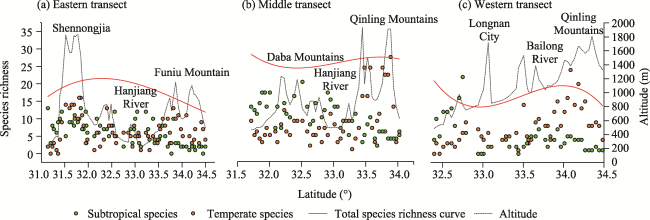
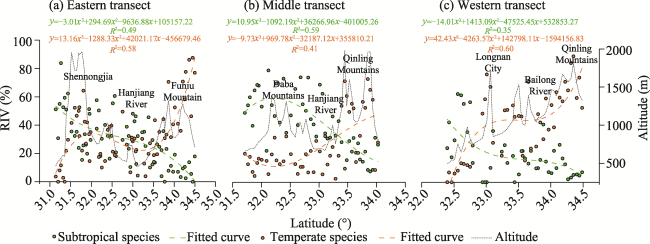
Geographically, the Qinling-Daba Mountains serve as the main body of the north-south transitional zone of China. However, the transitional patterns of their plant species still need to be clarified. This study analyzed latitudinal variations of plant species richness, relative importance values (RIV), and plant species abundance based on plant community field survey data for 163 sample sites along three north-south transect lines in the eastern, middle, and western parts of the study areas. The difference in RIV between subtropical and temperate species (SND-RIV) was selected to reveal the latitudinal interlacing pattern of northern and southern plant species. Along the eastern (Sanmenxia-Yichang), middle (Xi’an-Dazhou), and western (Tianshui-Guangyuan) transects, the richness and RIV of subtropical plant species increased while those of temperate plant species decreased from north to south. In the eastern transect, temperate plant species richness and RIV were the highest at Shennongjia and Funiu Mountain, respectively, because of their high elevations. In the middle transect, subtropical plant species richness and RIV were the highest in the Daba Mountains. In the western transect, richness and RIV were higher for subtropical than temperate plant species from the south of Longnan. The crisscrossing areas of northern and southern plant species were ~180 km, ~100 km, and ~60 km wide for the eastern, middle, and western transects, respectively, showing a narrowing trend from east to west. For the eastern and western transects, decreases in subtropical plant species distribution from south to north could be attributed to a decrease in mean annual precipitation in the same direction. However, for the middle transect, mean annual temperature had a slightly greater influence on plant species’ latitudinal distribution than the moisture index. This study provides a more solid scientific basis for future investigations of this key geographical boundary in China.

Cite this article

LIU Junjie , ZHANG Baiping , YAO Yonghui , ZHANG Xinghang , WANG Jing , YU Fuqin , LI Jiayu . Latitudinal differentiation and patterns of temperate and subtropical plants in the Qinling-Daba Mountains[J]. Journal of Geographical Sciences, 2023 , 33(5) : 907 -923 . DOI: 10.1007/s11442-023-2112-z

1 Introduction

The Qinling-Daba Mountains are the main body of the north-south transition zone of China that spans warm temperate and subtropical zones and is described as “transitional, complex, and diverse.” The regional plants and climates present with multidimensional zonal differentiation due to their particular geographic location and complex mountain topography (Zhang, 2019).
There has been a longstanding controversy regarding the delineation and local position of the geographic boundary between the warm temperate and subtropical zones in China. Zhu (1958) took the Qinling-Huaihe line as the conceptual boundary between the subtropical and warm temperate zones, roughly the 4500℃ isoline of accumulated temperature for the period with average daily temperature ≥ 10℃ (Zhu, 1958). However, subsequent investigations revealed limitations of using accumulated temperature as the main division criterion (Zhang, 2019). Fang et al. (2002) considered the Qinling-Huaihe line an important moisture boundary rather than a temperate limit (Fang et al., 2002). Subsequent researchers used more stable climate indicators such as the number of days with an average daily temperature ≥ 10℃ (Zheng et al., 2008), the warm index (Hong and Li, 1981; Fang, 1991; 2001), the cold index (Hong and Li, 1981), mountain altitudinal belt spectrum, vegetation type, and floral community, to determine the boundary between warm temperate and northern subtropical zones. Several dividing lines have been proposed, including the northern slope of the Qinling Mountains (Huang, 1959; Kuang et al., 1961; Hou, 1963; 1964), the main ridge line (Zhu, 1958; Wu and Hou, 1980; Liu, 1981), the southern slope of the Qinling Mountains (Qian et al., 1956; Zhang and Cui, 1963; Zhou, 1965; Zhang and Zhang, 1979; Zhang, 1981; Lei, 1999; Kang and Zhu, 2007; Wang et al., 2010), the Daba Mountains (Fang, 1991; Zhao et al., 2020), and the Yangtze River (EBAGS, 1959; Ying et al., 1990; Song, 1999; Fang, 2001). Most vegetation and climate data used in these studies were obtained before the 1980s or 1990s and were fragmented. Therefore, they can not reflect current vegetation and climate distributions in the context of global climate change (Fang et al., 2002).
Plant distribution patterns can reflect changes in temperature and precipitation and disclose the high-degree heterogeneity of mountain environments (Fang, 1991; Song, 1999; Fang et al., 2002; Song, 2016). The average north-south width of the Qinling-Daba Mountains is ~300 km, and the mean east-west length is ~1000 km. Latitudinal, longitudinal, altitudinal, and slope differentiation superimpose onto and interact with each other (Zhang, 2019), forming complex, diverse mountain plant communities and their transitional mosaic patterns (Ying et al., 1990; Jin-Hu and Tang, 2004; Chen et al., 2014; Yao et al., 2020; Zhang et al., 2021). The latitudinal transition patterns of species composition, dominant plant species, plant community abundance, and species diversity are important manifestations of the transition from warm temperate to subtropical zones (Zhang, 2004; Song, 2016). Recent studies on the transitional characteristics of flora, community structure (Fan et al., 2015; Chen et al., 2017), and species diversity (Qin, 2011) confirmed that plants species are diverse and have transitional properties (Ye et al., 1992; Xu, 2005) in the Qinling-Daba Mountains. However, previous studies were scattered and sporadic, mainly focusing on local areas or a short transect of the Qinling-Daba Mountains. There has been no detailed exploration of the climate and plant distribution patterns across the entire Qinling-Daba Mountain range.
The present study uses detailed north-south transect survey data to study the north-south transitional patterns of temperate and subtropical plants for the eastern, middle, and western sections of the Qinling-Daba Mountains. In this way, we can scientifically and comprehensively understand the transitional characteristics between subtropical and warm temperate zones and identify the factors driving plant species differentiation in the region to provide a solid scientific basis for future investigations of this key geographical boundary in China.

2 Data and methods

2.1 Data

The data used in the present study were obtained from a field survey conducted in the Qinling-Daba Mountains from 2017-2019, including 163 sampling points with an interval of about 5 km along three north-south transects in the eastern, middle, and western sections in the Qinling-Daba Mountains (Figure 1). The sampling quadrat was 20 m × 20 m. All sample points had low human disturbance, were readily accessible, and could represent the local plant species well by conforming to the zonal vegetation distribution (Fang et al., 2009). The recorded data were species name, the number of individuals, tree height, diameter at breast height (DBH), crown width, coverage, longitude, latitude, and other parameters of tree and shrub layers. Along the eastern transect, there were 69 sampling points containing 283 plant species (161 trees and 122 shrubs). The middle transect involved 50 sample points with 228 plant species (152 trees and 76 shrubs). The western transect contained 44 sampling points that included 201 plant species (114 trees and 87 shrubs). The total data set contained 241 tree and 193 shrub species.
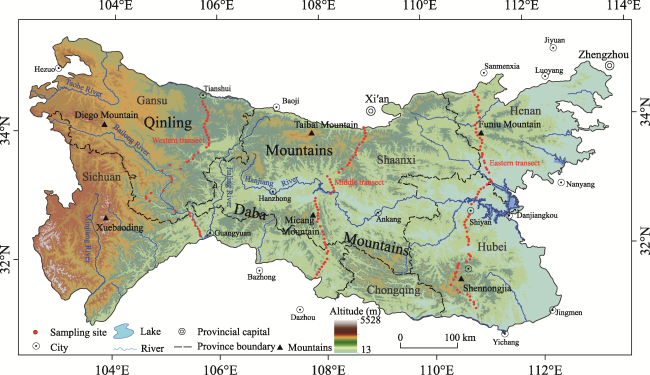
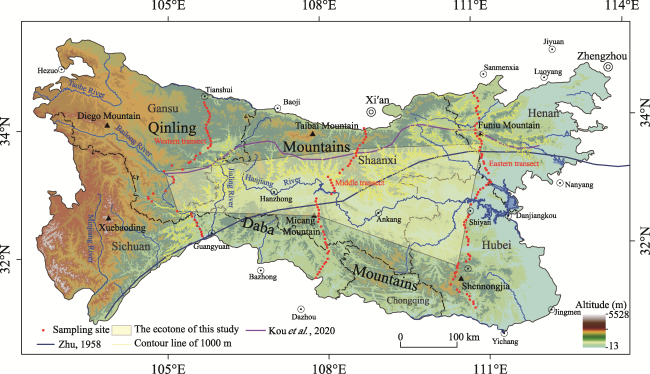
Figure 1 Distribution of sampling sites in the eastern, middle, and western Qinling-Daba Mountains
The meteorological data were obtained from the China Meteorological Background datasets (http://www.resdc.cn/). The dataset was based on meteorological data compiled from 1,915 stations in China. Mean annual temperature, mean annual precipitation, and accumulated temperatures for the periods with average daily temperature ≥ 0℃ and ≥ 10℃ were calculated and interpolated with the inverse distance weight (IDW) method to produce spatial data with a resolution of 500 m × 500 m. The moisture index dataset was interpolated using the Thornthwaite method (Xu and Zhang, 2017).

2.2 Research methods

2.2.1 Quantitative plant community characteristics

Species richness and relative importance value (RIV) were selected to describe plant variation and quantify species composition. The importance value (Iv; Eq. 1) was calculated based on the relative density (Dr; the ratio of the number of plants of a certain species to the total number of plants of all species), the relative frequency (Fr; the ratio of the frequency of a certain species to the total frequency of all species), and the relative prominence (Pr; the ratio of basal area of a certain species to the total basal area of all species) (Monk, 1966; Song et al., 2014). For the convenience of calculation and comparison, the RIV (Eq. 2) is often used. It is the importance value of each species divided by three (Song, 2016):
$Iv=Dr+Fr+Pr$
$RIV=~\frac{Iv}{3}\text{ * }100$

2.2.2 Determination of plant species distribution types

It is impractical to apply the distribution type of a genus to the distribution type for each species within that genus (Zhu, 2007). Therefore, the plant family and genus distribution types cited here were based on the Flora of China (Luo et al., 2012; EBCF, 1988), the areal-types of Chinese seed plant genera (Wu, 1991), Chinese Physical Geography and Plant Geography (Volume 1), and other literature sources (CPGC, 1983). All 434 plant species were individually queried, and the trees and shrubs of all three transect lines in the Qinling-Daba Mountains were divided into subtropical, temperate, widespread, and endemic species. The following classification system was used:
(1) Tropical and subtropical distribution genus. The distribution types of “the areal-types of Chinese genera of seed plants” are types 2-7. i) The plant species within genera such as Cinnamomum, Dalbergia, Pittosporum, Citrus, and Camellia are distributed in the subtropical region and strictly limited to the tropical and subtropical regions. These are classified under the subtropical distribution type. ii) The tropical plant genus distribution type is further extended to the northern temperate zone, and the distribution of each plant species within each genus is individually queried. The northernmost extension of the species distribution area into the temperate zone does not reach beyond Henan or Shaanxi Provinces, and the species include evergreen trees/shrubs such as Alangium chinense, Grewia biloba, Ilex chinensis, and Lindera communis. These are classified under the subtropical distribution type. Plant species such as Periploca sepium, Alangium platanifolium, Broussonetia papyrifera, and Albizia julibrissin extending to the temperate zone as far north as Heilongjiang, Jilin, and Liaoning Provinces or across northern and southern China are classified as widespread species, and most of them are deciduous trees/shrubs. Certain plant species distributed mainly in the northern Qinling-Daba Mountains are classified under the temperate distribution type. These include Indigofera bungeana and Ziziphus jujuba var. spinosa and others.
(2) Temperate distribution genus. The distribution types of “the areal-types of Chinese genera of seed plants” are types 8-12 and 14. Most species in these genera are classified under the temperate distribution type, with certain exceptions. i) Certain representative deciduous tree species are distributed in tropical and subtropical forests. These include Castanea seguinii, Sassafras tzumu, Fagus longipetiolata and others; coniferous tree species such as Pinus massoniana, Cupressus funebris and others; and evergreen trees/shrubs distributed in the southern Qinling-Daba Mountains such as Loropetalum chinense, Elaeagnus pungens, Eriobotrya japonica, Trachycarpus fortunei and others. These are classified under the subtropical type. ii) Plant species with distribution areas in the northern and southern provinces of China or that originate across the country are classified as widespread species. These include Fraxinus chinensis, Koelreuteria paniculata, Salix matsudana, and Quercus aliena var. acutiserrata.
(3) Widespread and endemic distribution species. These differ from the globally widespread and Chinese endemic species reported in previous floristic studies. In the present study, “widespread species” refers to those that are widely distributed across northern and southern China, while “endemic species” refers to those indigenous to specific regions of China. i) The genera have global widespread and endemic distribution. The distribution types of “the areal-types of Chinese genera of seed plants” are types 1 and 15. The distribution areas of the plant species contained within these genera were individually queried. Most of them were classified either as widespread or endemic species, with certain exceptions. Though Cunninghamia lanceolata is endemic to China, it is also a subtropical tree species. Hence, it is classified under the subtropical distribution type. ii) The plant genera distribution types are tropical and temperate. The distribution types of “the areal-types of Chinese genera of seed plants” are 2-12 and 14. The distribution areas of the plant species contained within these genera were individually queried. Most species were classified as widespread according to the foregoing criteria. However, some were classified as regional endemic species including Acer cappadocicum, Ilex denticulata, Tilia oliveri, and Prunus szechuanica.
The distribution types with the largest numbers of tree and shrub species on all three transects of the Qinling-Daba Mountains were temperate, followed by subtropical. There were relatively fewer widespread species, and the endemic species were the fewest in number (Table 1). As there were comparatively few widespread and endemic species in the region and the three transects had only minor influences on their distribution patterns, the present study focused mainly on the changes and transition patterns of the plant species with subtropical and temperate distributions.
Table 1 Basic information and species type data for transect lines in eastern, middle, and western Qinling-Daba Mountains
Eastern transect Middle transect Western transect
Number of sampling sites 69 50 44
Sample range 31.13°N-34.50°N
110.33°E-111.21°E
31.71°N-34.03°N
106.79°E-108.85°E
32.39°N-34.48°N
104.61°E-105.83°E
Elevation range (m) 213-1834 447-1893 489-1809
Tree Subtropical 53 43 38
Temperate 68 66 48
Widespread 27 26 23
Endemic 13 17 5
Total 161 152 114
Shrub Subtropical 48 30 36
Temperate 40 31 35
Widespread 20 10 12
Endemic 14 5 4
Total 122 76 87

2.2.3 Selection of typical species

Variations in the abundance of typical species along the eastern, middle, and western transect lines of the Qinling-Daba Mountains can disclose the transition from subtropical to temperate plants. Here, variations in the abundance of typical species from south to north were analyzed using kite maps. The selection of typical species was determined according to their degree of dominance or the relative basal area of the trees and the abundance of the shrubs. Plant species with the highest degree of dominance at each transect point in the eastern, middle, and western transect lines were selected. After selection, there was 8-12 subtropical, temperate, and widely distributed species per line. No endemic species dominated any plot. Species with subtropical distribution included Platycarya strobilacea, Dalbergia hupeana, Pinus massoniana, Castanea seguinii, Cunninghamia lanceolata, Vernicia fordii, Lindera glauca, Quercus glauca, Lindera communi, Trachycarpus fortuna, and Coriaria nepalensis. Species with temperate distribution included Robinia pseudoacacia, Ziziphus jujuba var. spinosa, Pinus tabuliformis, Populus tomentosa, Morus alba, and Ulmus glaucescens. Species widely distributed in China included Quercus variabilis, Quercus serrata, Platycladus orientalis, Quercus aliena var. acutiserrata, Toona sinensis, Ailanthus altissima, Juglans mandshurica, and Koelreuteria paniculata.

2.2.4 Analyses of the change patterns and factors influencing the degree of plant dominance

Differences in the RIV between subtropical and temperate species (SND-RIV) were selected to reflect the changes in the degree of plant dominance from south to north. SND-RIV was calculated as shown in Eq. 3:
$SND-RIV=~RI{{V}_{\text{subtropical}\ \text{species}}}-RI{{V}_{\text{temperate}\ \text{species}}}$
where$RI{{V}_{\text{subtropical}\ \text{species}}}$is the sum of the RIV for all subtropical species per plot and $RI{{V}_{\text{temperate}\ \text{species}}}$is the sum of the RIV for all temperate species per plot.
Pearson’s correlation analysis (Pearson, 1920) was used to evaluate the associations between the geographic factors (latitude and altitude) and the meteorological factors (mean annual temperature, mean annual precipitation, accumulated temperatures for the periods with average daily temperature ≥ 0℃ and ≥ 10℃, aridity index, and moisture index) and establish the influences of plot latitude and altitude on the above mentioned meteorological factors in the Qinling-Daba Mountains. SND-RIV was the dependent variable, and stepwise regression analysis was used (You and Yan, 2017) to explore the relationships between the degree of plant dominance and the meteorological factors.

3 Results

3.1 Quantitative characteristics of the latitudinal pattern of plant communities in the Qinling-Daba Mountains

3.1.1 Latitudinal pattern of species richness

The total species richness curve shows is an increase of 5-10 species along the eastern transect from the southern slope of the Qinling Mountains to the northern slope of Shennongjia. The total species richness was stable for the middle transect. Along the western transect, about 15-20 species was recorded on the southern slope of the Qinling Mountains but only ~10-15 species in the southern Longnan region (Figure 2). The subtropical species richness increased from north to south, whereas the temperate species richness decreased from north to south for all three transects. In the eastern transect, the subtropical species richness increased from 3 to 5 species in the north and from 10 to 15 species in the south. In the middle transect, the subtropical species richness sharply increased from the north to the Hanjiang River, increased more gradually thereafter, and stabilized at ~15 species. The subtropical species richness of the western transect increased from north to south in a concave upward curve and sharply increased from ~5 to ~15 species in the southern Longnan region. The species richness in the temperate zone of the eastern transect was relatively high in Funiu Mountain and Shennongjia because of the influence of altitude there. The species richness in the temperate zone of Shennongjia (~15 species) was higher than that in Funiu Mountain (~10 species). The species richness in the temperate zone of the middle transect reached a maximum of ~20-25 species in the Qinling Mountains, was markedly lower in the Hanjiang River (~eight species), and stabilized at 5-10 species south of the Hanjiang River. The temperate species richness of the western transect decreased from 15-20 species to ~2 species in a north-to-south direction.
Figure 2 Species richness variations in the eastern, middle, and western Qinling-Daba Mountains

3.1.2 Latitudinal pattern of RIV

The north-to-south variation in RIV and the polynomial fitting curve are shown in Figure 3. Subtropical species RIV in the eastern transect increased from 0-10% in the north to 4%-60% in the south. The incline of the fitted curve increased steadily. The temperate species RIV decreased substantially from 90% to 30%-40% from the Qinling Mountains to the Hanjiang River, stabilized at 30%-40% from the Hanjiang River to Shennongjia, and significantly decreased from 40% to ~5% south of Shennongjia. The slope of the fitted curve decreased considerably from north to south, stabilized, and decreased sharply thereafter. The subtropical and temperate species RIV fitting curves were in close proximity between 31.80°N and 33.70°N.
Figure 3 RIV variations and curve fitting for the eastern, middle and western Qinling-Daba Mountains
The subtropical species RIV in the middle transect increased from 10% to ~60% from north to south, reached a maximum of 60%-80% in the Daba Mountains, and stabilized thereafter. The fitted curve rose from the north to the south and uplifted in the Daba Mountains. The temperate species RIV decreased from 60%-70% in the Qinling Mountains to ~20% in the Daba Mountains. The fitted curve declined from north to south and stabilized thereafter. The fitted curves for the subtropical and temperate species RIV intersected at 33.30°N.
The subtropical species RIV in the western transect steadily increased from north (10%) to south (40%-60%), and the fitted curve had a nearly linear upward trend. The temperate species RIV decreased from north (~90%) to south (~60%) in the Bailong River, stabilized, and then decreased to ~10%-20% south of Longnan. The fitted curve initially decreased, stabilized, and sharply decreased thereafter. The fitted curves for the subtropical and temperate species RIV intersected at 32.75°N.

3.2 Latitudinal pattern of typical species abundance

The locations and ranges of the temperate and subtropical species ecotone zones differed among the eastern, middle, and western transects in the Qinling-Daba Mountains. The eastern transect line ecotone zone was the widest, whereas the middle and western transect ecotone zones were relatively narrow (Figure 4). The eastern transect was dominated by temperate species north of the Hanjiang River. However, subtropical species such as Platycarya strobilacea, Dalbergia hupeana, Vernicia fordii, Triadica sebifera, and Celtis sinensis started appearing on the southern slope of the Qinling Mountains (33.70°N). The subtropical and temperate species ecotone zone stretched from the southern slope of Funiu Mountain (33.70°N) to Shennongjia (31.80°N) and was ~180 km wide. The main subtropical species included Platycarya strobilacea, Dalbergia hupeana, Castanea seguinii, Lindera glauca, and Coriaria nepalensis. The main temperate species included Cotinus coggygria var. pubescens and Pinus tabuliformis. South of the ecotone zone there were the subtropical species, including Pinus massoniana, Dalbergia hupeana, and Lindera glauca. Quercus variabilis, Quercus aliena var. acutiserrata and others were widespread, but there were few temperate species. Platycarya strobilacea and Dalbergia hupeana appeared from the southern slope of the Qinling Mountains (33.70°N) in the middle transect. There was a ~100-km ecotone zone from the southern slope of the Qinling Mountains (33.70°N) to the northern slope of the Daba Mountains (32.80°N) in the middle transect. It contained the subtropical species Platycarya strobilacea, Dalbergia hupeana, Pinus massoniana, Vernicia fordii, Trachycarpus fortunei and others, as well as the temperate species Robinia pseudoacacia, Pinus tabuliformis and others. The western transect was a ~60 km ecotone zone between 32.75°N and 33.40°N and included mainly temperate species such as Robinia pseudoacacia, and Ziziphus jujuba var. spinosa. Populus davidiana, Ailanthus altissima, Juglans mandshurica and others were widespread but there were few subtropical species, such as Olea europaea or Melia azedarach. The subtropical species started to predominate south of the ecotone zone and included Platycarya strobilacea, Dalbergia hupeana, Quercus glauca, Pinus massoniana, and Lindera communis.
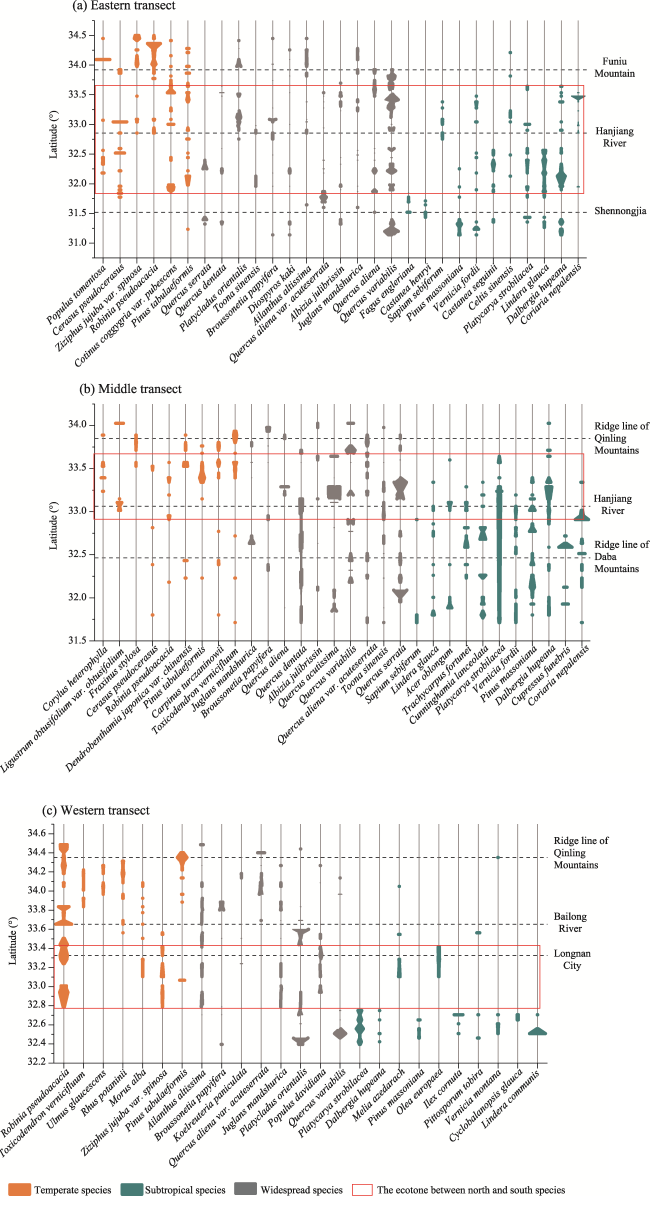
Figure 4 Kite diagram of species abundance in a north-south direction. Kite width is proportional to species abundance.

3.3 Transitional patterns and factors influencing species dominance in the Qinling- Daba Mountains

3.3.1 Latitudinal patterns of SND-RIV

The SND-RIV of the eastern, middle, and western transects in the Qinling-Daba Mountains increased with latitude and from north to south. Nevertheless, the change trends differed among transects (Figure 5). The SND-RIV of the eastern transect initially increased, then stabilized, and increased thereafter. The SND-RIV increased from the northern slope of the Qinling Mountains to the southern slope of the Funiu Mountains (33.70°N; 600 m a.s.l. on the southern slope of the Eastern Qinling Mountains) but was < 0. From the southern slope of Funiu Mountain to Shennongjia (31.80°N), the SND-RIV was ~0. Hence, the subtropical and temperate species stably co-dominated there. The SND-RIV in Shennongjia and south of Shennongjia was >0 and increased from north to south. Hence, subtropical species predominated there. In the middle transects, the dominance of temperate species decreased from north to south and the SND-RIV was > 0 on the southern slope of the Qinling Mountains (~33.30°N; 800-1000 m a.s.l.). The SND-RIV increased southward and reached a maximum at Daba Mountain (32.80°N). The SND-RIV of the western transect increased linearly from north to south except at four points near 33.00°N. Temperate species predominated from north to south, whereas subtropical species predominated south of Longnan at 32.75°N.
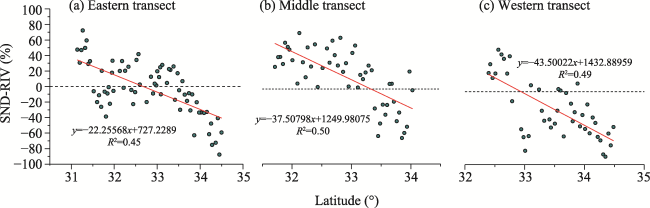
Figure 5 Relationships between SND-RIV and latitude in the eastern, middle, and western Qinling-Daba Mountains

3.3.2 Factors driving SND-RIV patterns

The correlations among geographic and meteorological factors in the Qinling-Daba Mountains are shown in Table 2. The latitude of the eastern transect was negatively correlated with mean annual precipitation (-0.918**) and the moisture index (-0.756**) but positively correlated with the aridity index (0.292*). Altitude was negatively correlated with mean annual temperature (-0.928**) and accumulated temperature (-0.933**, -0.915**) and positively correlated with the aridity index (0.457**). Moisture decreased with increasing latitude, whereas temperature decreased with increasing altitude.
Table 2 Correlations among geographical and meteorological factors in the Qinling-Daba Mountains
Altitude Latitude Mean
annual temperature
Mean
annual
precipitation
Moisture index Aridity index Accumulated temperature ≥ 10℃ Accumulated temperature ≥ 0℃
Latitude Eastern transect -0.206 1 0.005 -0.918** -0.756** 0.292* 0.089 0.001
Middle transect 0.486** 1 -0.620** -0.905** -0.792** 0.773** -0.606** -0.616**
Western transect 0.841** 1 -0.889** -0.571** -0.305* 0.313* -0.857** -0.881**
total 0.264** 1 -0.356** -0.705** -0.495** 0.398** -0.337** -0.353**
Altitude Eastern transect 1 -0.206 -0.928** 0.147 0.186 0.457** -0.933** -0.915**
Middle transect 1 0.486** -0.895** -0.386** -0.267 0.513** -0.870** -0.880**
Western transect 1 0.841** -0.896** -0.636** -0.440** 0.480** -0.872** -0.891**
Total 1 0.264** -0.865** -0.320** -0.191* 0.407** -0.873** -0.855**

**Correlation significant at 0.01 level (two-tailed); *Correlation significant at 0.05 level (two-tailed)

The latitude and altitude of the middle transect were negatively correlated with mean annual temperature (-0.620**, -0.895**), mean annual precipitation (-0.905**, -0.386**), and accumulated temperature (-0.606**, -0.616**, -0.870**, -0.880**), positively correlated with the aridity index (0.773**, 0.513**), and negatively correlated with the moisture index (-0.792**). Both altitude and latitude significantly affected temperature and precipitation. Precipitation decreased with increasing latitude, whereas temperature decreased with increasing altitude.
Both the latitude and altitude of the western transect markedly influenced temperature. The correlation coefficients between latitude and mean annual temperature, accumulated temperature ≥ 10℃, and accumulated temperature ≥ 0℃ were -0.889**, -0.857** and -0.881**, respectively. The correlation coefficients between altitude and mean annual temperature, accumulated temperature ≥ 10℃, and accumulated temperature ≥ 0℃ were -0.896**, -0.872** and -0.891**, respectively. Latitude and altitude also impacted precipitation.
Overall, the altitudes of all three transects strongly affected temperature. The correlation coefficients between altitude and mean annual temperature, accumulated temperature ≥ 10℃, accumulated temperature ≥ 0℃ were -0.865**, -0.873** and -0.855**, respectively. Latitude strongly affected mean annual precipitation, and the moisture index and the correlation coefficients were -0.705** and -0.495**, respectively.
The R2 in the stepwise linear regression model (Table 3) of SND-RIV and the meteorological factors in the eastern, middle, western, and total transect plots in the Qinling-Daba Mountains, were 0.687, 0.702, 0.729, and 0.746, respectively. The contribution rates of the mean annual precipitation and the mean annual temperature in the eastern transect were 0.62 and 0.38, respectively. In the middle transect, the contribution rates of the mean annual temperature and the moisture index were 0.60 and 0.40, respectively. The contribution rates of the mean annual precipitation and the mean annual temperature in the western transect were 0.64 and 0.36, respectively. However, there was collinearity between the accumulated temperature ≥ 0℃ and the other meteorological factors. Hence, the former was excluded from the total linear regression model of the three transects. The contribution rates of the mean annual temperature, the mean annual precipitation, the moisture index, the accumulated temperature ≥ 10℃, and the aridity index were 0.25, 0.26, 0.20, 0.19, and 0.10, respectively.
Table 3 Stepwise regression analysis of SND-RIV and meteorological factors in the Qinling-Daba Mountains
Equation R2 Rate of contribution
Mean annual temperature (x1) Mean annual precipitation (x2) Moisture index (x3) Accumulated temperature ≥ 10℃ (x4) Aridity index (x5)
Eastern
transect
y = 4.878x1 + 0.191x2 - 223.589 0.687 0.38 0.62 / / /
Middle
transect
y = 8.253x1 + 0.696x3 - 106.501 0.702 0.60 / 0.40 / /
Western
transect
y = 4.604x1 + 0.169x2 - 188.391 0.729 0.36 0.64 / / /
Total y = 13.845x1 + 0.196x2 - 1.438x3 - 0.035x4 - 69.474x5 - 110.054 0.746 0.25 0.26 0.20 0.19 0.10

4 Discussion and conclusions

4.1 Discussion

4.1.1 Patterns and driving factors of plant species latitudinal pattern in the Qinling-Daba Mountains

Correlation and stepwise regression analyses revealed that latitude and altitude influenced temperature and precipitation and, by extension, plant species and their quantitative characteristics in the eastern, middle, and western transects. Temperature decreased with increasing altitude in the eastern, middle, and western Qinling-Daba Mountains. Precipitation decreased with increasing latitude in the eastern and middle Qinling-Daba Mountains. Temperature and, to a certain extent, precipitation also decreased with increasing latitude in the western Qinling-Daba Mountains. Low temperatures, high wind velocity, and drought can limit plant growth (Troll, 1973). The decrease in precipitation with increasing latitude explained the latitudinal transition pattern observed in the plants of the eastern transect. Hence, the abundances of subtropical and temperate plants decreased and increased, respectively, from south to north. Shennongjia is located in the southern section of the eastern transect and has adequate precipitation. However, the proportion of temperate plants increased with rising altitudes and falling temperatures. The combined influences of latitude and altitude widened the plant ecotone zone in the eastern Qinling-Daba Mountains. Increases in latitude from south to north in the middle and western Qinling-Daba Mountains were accompanied by increases in altitude and corresponding decreases in temperature and precipitation. In that region, the dominance of subtropical plants decreased while that of temperate plants increased, and the ecotone was clear and narrow.

4.1.2 Latitudinal transitional pattern of plant species and the warm temperate-subtropical boundary

In this study, we obtained continuous data for the latitudinal variation in the plant species of the Qinling-Daba Mountains and analyzed the Qinling-Daba Mountains as a complete geographic and geomorphic unit. We obtained the north-to-south plant ecotone zone ranges for the eastern, middle, and western Qinling-Daba Mountains (Figure 6). The results of the present study partially validated those of previous investigations and provided a scientific basis for determining the North-South boundary in China. Analysis of the latitudinal variation in plant species on three north-south transects verified that the North-South Boundary of China is not a simple geometric line but rather a transition region of a certain defined width. Moreover, it was established that the latitudinal spans of the transition region differed among the eastern, middle, and western Qinling-Daba Mountains. The eastern ecotone was the widest and was situated between the southern slope of Funiu Mountain (33.70°N) and Shennongjia (31.80°N). The middle ecotone zone was located between the southern slope of the Qinling Mountains (33.70°N) and the northern slope of the Daba Mountains (32.80°N). The western ecotone was situated between 32.75°N and 33.40°N. The northern boundary of the distribution of evergreen broadleaf woody plants or southern species corresponded to the northern boundary of the subtropical zone. Previous studies delineated the boundary on the southern slope or at the southern slope altitude of 800-1000 m of the Qinling Mountains (Zhang and Zhang, 1979; Kang and Zhu, 2007; Zhang et al., 2021). The contour of the Qinling Mountains at 1000 m (Figure 6). Zhu (1958) used climate indexes such as isoline of accumulated temperature ≥ 10℃ and isotherm of the mean temperature of the coldest month 0℃ to define the boundary between the warm temperate and subtropical zones in China (Figure 6). The eastern and middle parts of this boundary are within the ecotone zone; only the western part is located on the south side of the ecotone zone in our study (Zhu, 1958). Zhao et al. (2020) reported that the transition between the north subtropical and the warm temperate zone was reflected in the base zone of the mountain altitudinal belt spectrum from the southern slope of Funiu Mountain to the northern slope of Shennongjia in the eastern Qinling-Daba Mountains, from the southern slope of Taibai Mountain to the northern slope of the Micang Mountain in the middle, and from south of the Baishui River Nature Reserve in the west (Zhao et al., 2020). Kou et al. (2020) used several climate indicators to locate the northern boundary of the subtropical zone with reference to vegetation and soil data (Kou et al., 2020). Here, the northern boundary of the ecotone did not markedly differ from that of the northern subtropical zone proposed by a previous study. However, the ecotone was further extended in the present study. This discovery provides additional data supporting the boundary between the warm temperate and subtropical zones as well as comprehensive geographic regionalization in China.
Figure 6 Crisscrossing areas of temperate and subtropical species in the Qinling-Daba Mountains
Prior studies investigating the boundary used different indices, subjects, research scales, and differentiation criteria, and the resulting position of the boundary differed considerably. Another key reason is that the local differentiation of climate and vegetation in the interior of the, on average, 300-km wide Qinling-Daba Mountains was poorly understood. This study only used community survey data along three north-south transects and got a deeper understanding of the inner complexity of the Qinling-Daba Mountains. Considering the species data of the approximately 40 nature reserves in the Qinling-Daba Mountains will provide a more solid basis for delineating the North-South boundary. Future research should also incorporate high-resolution climatic data, intensive plant species data, and even soil data to more precisely explain the warm temperate-subtropical boundary of China.

4.2 Conclusions

The present study analyzed vegetation field survey data for 163 plots across three north-south transects in the eastern, central, and western Qinling-Daba Mountains, and summarized the latitudinal patterns of plant species and RIV across the entire mountain range.
(1) The species ecotone between the subtropical and temperate zones of China is the widest (~180 km) in the eastern Qinling-Daba Mountains from Funiushan to Shennongjia, followed by the middle transect from Xi’an to Dazhou (~100 km), and the western transect (only ~60 km).
(2) For the eastern transect from Yichang to Sanmenxia, the observed decrease in subtropical species from south to north corresponded to a decrease in mean annual precipitation in the same direction; for the middle transect from Dazhou to Xi’an, plant species distribution patterns were correlated with both precipitation and temperature, with the latter slightly more significant than the former; and for the western transect from Guangyuan to Tianshui, the latitudinal transitional pattern of temperate and subtropical plant species is associated merely with changes in mean annual precipitation.
(3) Considering that there exists a wide crisscrossing area between temperate and subtropical species, it is reasonable for the so-called “north-south dividing line of China” be renamed the “north-south transitional zone of China.”
[1]
Chen Y, Guo L, Yao C et al., 2017. Community characteristics of a deciduous broad-leaved forest in a temperate-subtropical ecological transition zone: Analyses of a 5-hm2 forest dynamics plot in Baiyunshan Nature Reserve, Henan Province. Acta Ecologica Sinica, 37(17): 5602-5611. (in Chinese)

[2]
Chinese Physical Geography Committee CPGC of Chinese Academy of Sciences, 1983. Chinese Physical Geography and Plant Geography. Beijing: Science Press. (in Chinese)

[3]
Editorial Board of Acta Geographica Sinica EBAGS, 1959. Summary of Soviet experts’ opinions on “Draft Comprehensive Physical Regionalization of China”. Acta Geographica Sinica, 25(3): 240-247. (in Chinese)

[4]
Editorial Board of Chinese Flora EBCF, 1988. Flora of China. Beijing: Science Press. (in Chinese)

[5]
Fan Y L, Hu N, Ding S Y et al., 2015. Population dynamics of dominant species in the forest ecosystem at Funiu Mountain National Nature Reserve. Journal of Northwest Forestry University, 30(4): 14-20. (in Chinese)

[6]
Fang J, Wang X, Shen Z et al., 2009. Methods and protocols for plant community inventory. Biodiversity Science, 17(6): 533-548. (in Chinese)

DOI

[7]
Fang J Y, 1991. Eco-climatic analysis of forest zones in China. Acta Ecologica Sinica, 11(4): 377-387. (in Chinese)

[8]
Fang J Y, 2001. Re-discussion about the forest vegetation zonation in eastern China. Chinese Bulletin of Botany, 43(5): 522-533. (in Chinese)

[9]
Fang J Y, Song Y C, Liu H Y et al., 2002. Vegetation-climate relationship and its application in the division of vegetation zone in China. Acta Botanica Sinica, 44(9): 1105-1122. (in Chinese)

[10]
Hong B G, Li S Z, 1981. The preliminary study of the correlations between the distribution of main everygreen broadleaf tree species in Jiangsu and climate. Acta Ecologica Sinica, 1(2): 105-111. (in Chinese)

[11]
Hou X Y, 1963. A discussion on the controversial issues in scheme for vegetation regionalization of China. Chinese Journal of Plant Ecology, 1(1/2): 1-23. (in Chinese)

[12]
Hou X Y, 1964. Discussion on the principle, basis and the system unit for vegetation regionalization of China. Chinese Journal of Plant Ecology, 2(2): 153-179. (in Chinese)

[13]
Huang B W, 1959. Draft of the complex physical geographical division of China. Chinese Science Bulletin, 18: 594-602. (in Chinese)

[14]
Kang M Y and Zhu Y, 2007. Discussion and analysis on the geo-ecological boundary in Qinling range. Acta Ecologica Sinica, 27(7): 2774-2784. (in Chinese)

[15]
Kou Z X, Yao Y H, Hu Y F, 2020. Delimitation of the northern boundary of the subtropical zone in China by geodetector. Geographical Research, 39(12): 2821-2832. (in Chinese)

DOI

[16]
Kuang S S, Pei Y R, Wang X H et al., 1961. Geobotanical zone of Henan Province, discussion on the division between north subtropical zone and south warm temperate zone. Journal of Henan Normal University (Natural Science Edition), (2): 1-10. (in Chinese)

[17]
Lei M D, 1999. Shanxi Vegetation. Beijing: Science Press. (in Chinese)

[18]
Liu H X, 1981. The vertical zonation of mountain vegetation in China. Acta Geographica Sinica, 36(3): 267-279. (in Chinese)

[19]
Luo Y, He Y, Li D et al., 2012. A comparison of classifications of families of Chinese vascular plants among flora Republicae Popularis sinicae, flora of China and the new classifications. Plant Diversity and Resources, 34(3): 231-238. (in Chinese)

DOI

[20]
Monk C D, 1966. An ecological significance of evergreenness. Ecology, 47(3): 504-505. https://doi.org/10.2307/1932995.

DOI

[21]
Pearson K, 1920. Notes on the history of correlation. Biometrika, 13(1): 25-45. https://doi.org/10.1093/biomet/13.1.25.

DOI

[22]
Qian C S, Wu Z Y, Chen C D, 1956. The vegetation types of China. Acta Geographica Sinica, 22(1): 37-92. (in Chinese)

DOI

[23]
Qin Y F, 2011. The plant communities’ vertical distribution and the species’ diversity in Funiu mountain nature reserve. Chinese Horticulture Abstracts, 27(1): 186-187. (in Chinese)

[24]
Song K, Kohyama T S, Da L J, 2014. Transition patterns across an evergreen-deciduous broad-leaved forest ecotone: The effect of topographies. Journal of Vegetation Science, 25(5): 1257-1266.

DOI

[25]
Song Y C, 1999. Perspective of the vegetation zonation of forest region in eastern China. Acta Botanica Sinica, 41(5): 541-552. (in Chinese)

[26]
Song Y C, 2016. Vegetation Ecology. 2nd ed. Beijing: Higher Education Press. (in Chinese)

[27]
Tang Z Y, Ke J H, 2004. Altitudinal patterns of plant species diversity in Mt. Niubeiliang, Qinling Mountains. Biodiversity Science, 12(1): 108-114. (in Chinese)

DOI

[28]
Troll C, 1973. The upper timberlines in different climatic zones. Arctic and Alpine Research, 5(Suppl. 3): A3-A18.

[29]
Wang J L, Liu Q R, Meng S Y et al., 2010. Division of the geo-ecological boundary in Qinling Mountain range based on the composition and geographical elements of its Pteridophyta flora. Geographical Research, 29(9): 1629-1638. (in Chinese)

[30]
Wu Z Y, 1991. The areal types of Chinese genera of seed plants. Acta Botanica Yunnanica, (Suppl.4): 1139. (in Chinese)

[31]
Wu Z Y, Hou X Y, 1980. Vegetation of China. Beijing: Science Press. (in Chinese)

[32]
Xu D Y, 2005. Preliminary investigation on the vegetation of Dabashan nature reserve and its characteristics. Journal of Anhui Agricultural University, 32(3): 332-335. (in Chinese)

[33]
Xu X L, Zhang Y Q, 2017. China meteorological background dataset: Data registration and publishing system of resource and environmental science data center[D]. Beijing: Chinese Academy of Sciences. (in Chinese)

[34]
Yao Y H, Kou Z X, Hu Y F et al., 2020. Spatial distribution patterns of Pinus tabulaeformis forest and Pinus massoniana forest in Qinling-Daba Mountains and the boundary of subtropical and warm temperate zones. Acta Geographica Sinica, 75(11): 2298-2306. (in Chinese)

[35]
Ye Y Z, Wang S Y, Li P X, 1992. A study on the spermatophyta flora in the Jigongshan natural sanctuary in south Henan. Plant Science Journal, 10(1): 25-34. (in Chinese)

[36]
Ying J S, Feng L Y, Feng G L et al, 1990. Observations on the flora and vegetation of Taibaishan, Qinling Mountain range, southern Shaanxi, China. Acta Phytotaxonomica Sinica, 28(4): 261-293. (in Chinese)

[37]
You S B, Yan Y, 2017. Stepwise regression analysis and its application. Statistics and Decision, (14): 31-35. (in Chinese)

[38]
Zhang B P, 2019. Ten major scientific issues concerning the study of China’s north-south transitional zone. Progress in Geography, 38(3): 305-311. (in Chinese)

DOI

[39]
Zhang J Q, 1981. Division between subtropical zone and temperate zone in Henan province according to geobotany. Acta Geographica Sinica, 36(2): 216-222. (in Chinese)

[40]
Zhang J T, 2004. Numerical Ecology. Beijing: Science Press. (in Chinese)

[41]
Zhang X H, Zhang B P, Wang J et al., 2021. North-south transect series in vegetation of eastern China’s north-south transitional zone and their significance for determining climate dividing line. Acta Geographica Sinica, 76(1): 30-43. (in Chinese)

[42]
Zhang X Z, Zhang Z Y, 1979. A preliminary discussion on the northern boundary of subtropical zone in China: Based on the distribution of broadleaf woody evergreens on the Qinling Mountain. Acta Geographica Sinica, 34(4): 342-352. (in Chinese)

[43]
Zhang Z W, Cui Y W, 1963. Vegetation regionalization in Qinling Mountains (draft). Chinese Journal of Plant Ecology, 1(Suppl.1): 161-162. (in Chinese)

[44]
Zhao F, Liu J J, Zhu W B et al., 2020. Spatial variation of altitudinal belts as dividing index between warm temperate and subtropical zones in the Qinling-Daba Mountains. Journal of Geographical Sciences, 30(4): 642-656. https://doi.org/10.1007/s11442-020-1747-2.

DOI

[45]
Zheng D, Yang Q Y, Wu S H et al., 2008. Study on Ecogeographic Regional System of China. Beijing: The Commercial Press. (in Chinese)

[46]
Zhou G Y, 1965. The transitional characteristics of vegetation and the boundary between north and south in Huaihe River Basin. Chinese Journal of Plant Ecology, 3(1): 131-137. (in Chinese)

[47]
Zhu H, 2007. Some problems in references on floristic studies in China. Plant Diversity and Resources, 29(5): 489-491. (in Chinese)

[48]
Zhu K Z, 1958. Subtropics of China. Chinese Science Bulletin, 17: 524-528. (in Chinese)

[49]
Zhu Y, Liang J, Sun Z et al., 2014. Numerical classification, ordination and species diversity along elevation gradients of the forest community in Xiaoqinling. Acta Ecologica Sinica, 34(8): 2068-2075. (in Chinese)

Outlines

/