
Journal of Geographical Sciences >
Jiaoyufication as an education-driven gentrification in urban China: A case study of Nanjing
|
Song Weixuan (1981-), PhD and Associate Professor, specialized in urban social geography. E-mail: wxsong@niglas.ac.cn |
Received date: 2023-02-05
Accepted date: 2023-03-30
Online published: 2023-05-11
Supported by
National Natural Science Foundation of China(42171234)
National Natural Science Foundation of China(41901215)
National Natural Science Foundation of China(42271245)
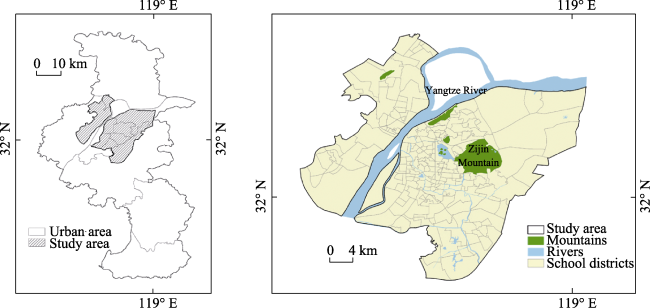
As a type of urban gentrification oriented by high-quality educational resources, jiaoyufication is a socio-spatial process that refers to the middle-class group that attaches importance to education realizes the agglomeration in famous school districts by purchasing high-price school district houses. Based on the theoretical analysis of jiaoyufication conducted by Chinese and foreign scholars, this paper takes Nanjing as a case city, applies multi-source data like POIs (points of interest), real estate market data, mobile-phone user portraits and questionnaires, and develops a composite measurement of jiaoyufication to identify jiaoyufied school district, jiaoyufied group & its spatial characteristics, and discusses the causal mechanisms and effects of jiaoyufication. With the GIS-entropy-TOPSIS model, this paper evaluates the jiaoyufication level of public primary school districts in the main urban area of Nanjing. The result show that 218 primary school districts are categorized into four types, i.e., high jiaoyufied school district, mid-high jiaoyufied school district, medium jiaoyufied school district, and low jiaoyufied school district. The high jiaoyufied school districts are closely associated with the institutional system. In the high jiaoyufied school districts, many middle-class families have abundant social, economic, and cultural capital. They purchase and move to houses with lower living quality in school districts to pursue high-quality education for their children. The strict school district system, soaring school district housing prices, and intense educational competition continuously solidify the jiaoyufication levels of famous school districts and lock the opportunities for high-quality education in specific school-district spaces and classes or groups. The phenomenon of this socio-spatial reconstruction process, which results from the unequal distribution of high-quality educational resources, tends to aggravate the rich-poor gap and social segregation in cities. It is suggested that equalization of compulsory education services should be effectively carried forward as soon as possible.
SONG Weixuan , CAO Hui , TU Tangqi , SONG Zhengna , CHEN Peiyang , LIU Chunhui . Jiaoyufication as an education-driven gentrification in urban China: A case study of Nanjing[J]. Journal of Geographical Sciences, 2023 , 33(5) : 1095 -1112 . DOI: 10.1007/s11442-023-2121-y
Figure 1 Study area (Nanjing) and subjects |
Table 1 The identification factors and description of jiaoyufication in Nanjing |
| Characteristic & Type | Identification factor | Variable description | Note |
|---|---|---|---|
| School attribute | Teaching quality | The ranking of school education quality | According to the number of students enrolled by Junior Middle Department of Nanjing Foreign Language School |
| Community attribute | Housing price | Housing price per unit area (yuan/m2) | Average listing price calculated based on residential community |
| Resident attribute | Age structure | The proportion of the group aged 30-50 (%) | Identity information provided by mobile phone users when registering APPs |
| Family structure | The proportion of parents of primary school students (%) | According to the type and activity of mobile APPs | |
| Occupational type | The proportion of white-collar group (%) | According to mobile phone positioning and in combination with online and offline behavior characteristics | |
| Consumption level | The proportion of high consumption group (%) | According to consumption habits, equivalent to monthly income of more than 20,000 yuan |
Data source: China Housing Price Market Platform (https://www.creprice.cn/), AMAP (https://amap.com/), and Getui big data platform (https://www.getui.com/) |
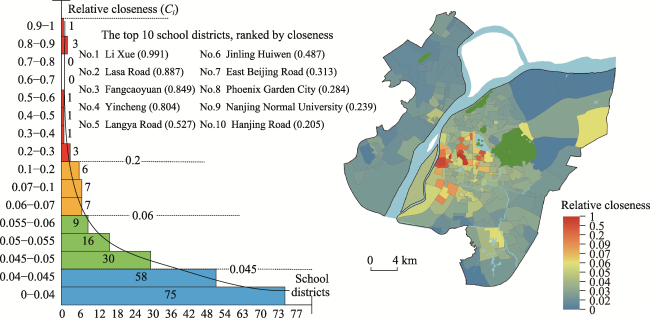
Figure 2 The evaluation results and spatial distribution of the jiaoyufication level in school districts in the main urban areas of Nanjing |
Table 2 The comparison of resident’s socioeconomic attributes in high & low jiaoyufied school districts (%) |
| Socioeconomic attribute | High jiaoyufied school district | Low jiaoyufied school district | Socioeconomic attribute | High jiaoyufied school district | Low jiaoyufied school district | ||
|---|---|---|---|---|---|---|---|
| Age structure | 18-29 | 23.75 | 37.05 | Consumption capability | High level | 35.64 | 28.18 |
| 30-39 | 24.33 | 22.70 | Medium level | 50.60 | 54.54 | ||
| 40-49 | 22.75 | 17.64 | Low level | 12.18 | 17.23 | ||
| 50-59 | 14.33 | 13.39 | Annual household income (yuan) | < 200,000 | 33.73 | 59.70 | |
| ≥60 | 12.74 | 8.21 | 200,000-400,000 | 36.14 | 28.19 | ||
| Family size | 1-2 | 14.05 | 22.88 | 400,000-600,000 | 14.86 | 7.26 | |
| 3 | 38.15 | 37.15 | 600,000-1,000,000 | 9.24 | 2.83 | ||
| 4 | 27.71 | 20.18 | ≥ 1,000,000 | 6.02 | 2.02 | ||
| 5 | 14.86 | 13.63 | Residential area (m2) | < 50 | 6.83 | 11.37 | |
| ≥6 | 5.22 | 6.16 | 50-59 | 10.84 | 5.70 | ||
| Parent’s attribute | Parents of a preschool student | 6.01 | 4.43 | 60-69 | 14.86 | 9.60 | |
| Parent of primary school student | 15.04 | 9.88 | 70-79 | 9.64 | 7.29 | ||
| Parents of middle school student | 12.06 | 6.97 | 80-99 | 19.68 | 26.45 | ||
| Educational level | High school and below | 9.24 | 22.60 | 100-119 | 19.28 | 18.48 | |
| Associate degree | 13.65 | 24.19 | ≥120 | 18.88 | 21.11 | ||
| Undergraduate | 47.79 | 38.95 | Housing attribute | Purchased commercial housing | 65.06 | 52.58 | |
| Master | 18.88 | 9.14 | Renting | 13.25 | 19.83 | ||
| PhD and above | 10.44 | 5.13 | Public house | 5.62 | 2.51 | ||
| Occupational structure | Employee in governmental department, enterprise and public institution | 25.70 | 16.50 | Original private house | 2.41 | 3.68 | |
| Professional and technical personnel | 24.90 | 24.08 | Demolition & resettlement house | 3.21 | 7.01 | ||
| Staff | 8.03 | 8.50 | Self-purchased affordable housing | 0.00 | 3.12 | ||
| Private businessman | 2.01 | 3.68 | Self-purchased house with limited property rights | 2.01 | 3.01 | ||
| Individual businessman | 2.41 | 2.94 | Reformed public house | 3.61 | 2.41 | ||
| Business service personnel | 5.22 | 9.38 | Self-built house | 4.42 | 4.85 | ||
| Industrial worker | 1.61 | 6.37 | Housing age | Before 1980 | 7.23 | 2.90 | |
| Agricultural laborer | 0.00 | 0.64 | 1980-1989 | 15.66 | 5.95 | ||
| Student | 15.66 | 11.93 | 1990-1999 | 20.48 | 12.11 | ||
| Freelance | 9.24 | 8.22 | 2000-2009 | 36.55 | 37.00 | ||
| Retired and unemployed | 5.22 | 7.75 | After 2010 | 20.08 | 42.03 | ||
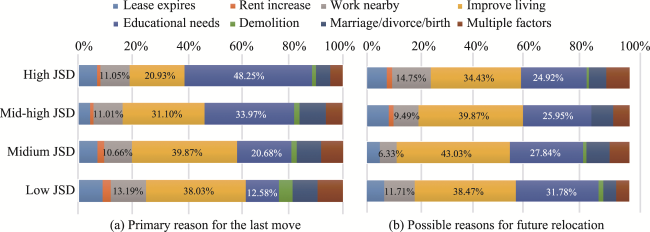
Figure 3 The main reasons why families move to their current residences and future residences |
Table 3 Basic information of high jiaoyufied school districts (schools) |
| No. | The name of primary school | Administrative district | The area of school district (km2) | Housing price in school district (yuan/m2) | The ranking of housing price | Campus or headquarters |
|---|---|---|---|---|---|---|
| 1 | Lixue Primary School | Gulou | 0.84 | 87,666 | 1 | Headquarters |
| 2 | Lasa Road Primary School | Gulou | 0.70 | 74,713 | 4 | Headquarters |
| 3 | Fangcaoyuan Primary School | Gulou | 0.25 | 71,958 | 5 | Headquarters |
| 4 | Yincheng Primary School | Gulou | 1.32 | 64,450 | 7 | Campus of Lasa Road Primary School |
| 5 | Langya Road Primary School | Gulou | 0.50 | 83,654 | 2 | Headquarters |
| 6 | Jinling Huiwen Primary School | Gulou | 0.92 | 70,112 | 6 | Campus of Lasa Road Primary School |
| 7 | East Beijing Road Primary School | Xuanwu | 0.69 | 63,869 | 8 | Headquarters |
| 8 | Phoenix Garden City Primary School | Gulou | 0.39 | 50,673 | 19 | Campus of Lixue Primary School |
| 9 | Primary School Attached to Nanjing Normal University | Xuanwu | 0.53 | 56,626 | 11 | Headquarters |
| 10 | Hanjiang Road Primary School | Gulou | 0.56 | 50,673 | 20 | Campus of Langya Road Primary School |
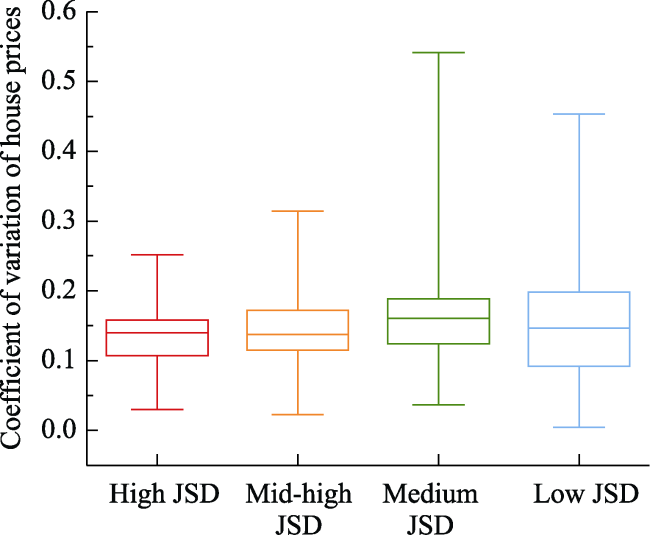
Figure 4 The coefficients of variation of housing prices in different types of school districts |
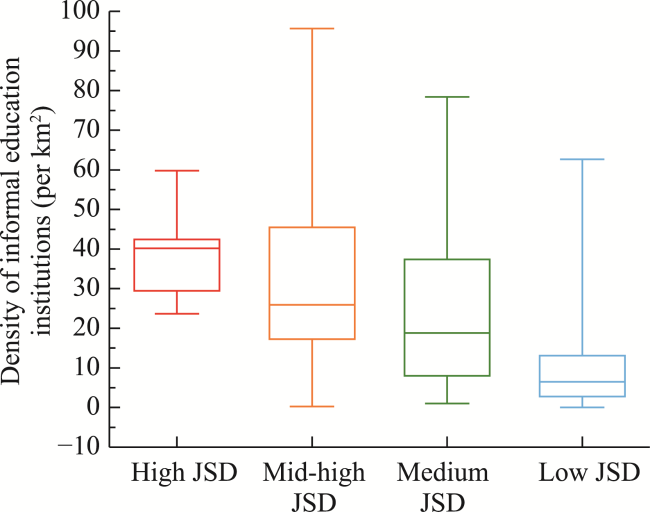
Figure 5 The density of non-governmental educational institutions in different types of school districts |
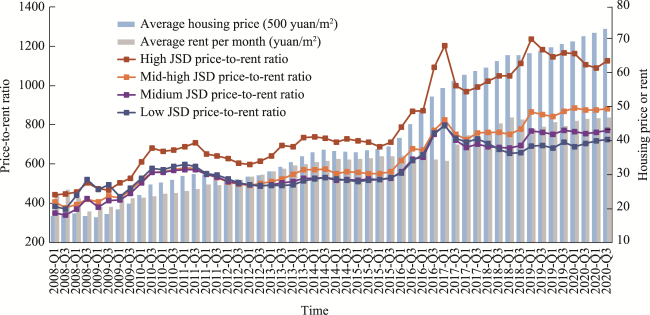
Figure 6 The change in average “price to rent ratio” of residences in different types of jiaoyufied school districts from 2008 to 2020 |
| [1] |
|
| [2] |
|
| [3] |
|
| [4] |
|
| [5] |
|
| [6] |
|
| [7] |
|
| [8] |
|
| [9] |
|
| [10] |
|
| [11] |
|
| [12] |
|
| [13] |
|
| [14] |
|
| [15] |
|
| [16] |
|
| [17] |
|
| [18] |
|
| [19] |
|
| [20] |
|
| [21] |
|
| [22] |
|
| [23] |
|
| [24] |
|
| [25] |
|
| [26] |
|
| [27] |
|
| [28] |
|
| [29] |
|
| [30] |
|
| [31] |
|
| [32] |
|
| [33] |
|
| [34] |
|
| [35] |
|
/
| 〈 |
|
〉 |