
Journal of Geographical Sciences >
Spatiotemporal interaction pattern of the Beijing agricultural product circulation
|
Zhao Yibo, PhD Candidate, specialized in spatiotemporal data mining. E-mail: zhaoyb@lreis.ac.cn |
Received date: 2022-07-27
Accepted date: 2022-11-24
Online published: 2023-05-11
Supported by
Innovation Project of LREIS(KPI003)
National Natural Science Foundation of China(42101423)
Strategic Priority Research Program of the Chinese Academy of Sciences(XDA23010202)
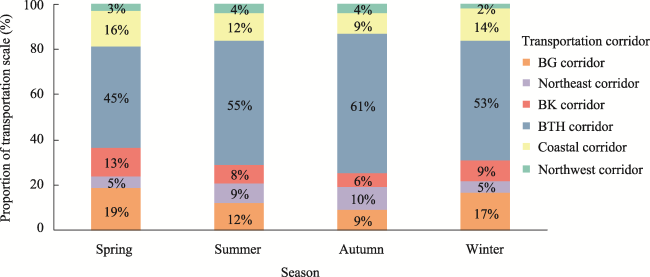
Identifying the spatiotemporal interaction pattern of agricultural product circulation (APC) is crucial for agricultural resource adjustment and food security. Current studies are mostly based on static statistical data over an entire year or a specific period, which cannot describe the spatial pattern of APC and its seasonal variation on a fine spatiotemporal scale. Thus, this study extracts an APC trip chain based on national truck trajectory data and constructs the flow network of the Beijing APC with the city as the spatial unit and the season as the temporal unit. The spatial interaction pattern and seasonal variation in APC are then analyzed from the network spatial form, city node function role, and transportation corridors. The results are as follows: (1) Compared with methods based on static statistical data, the proposed method provides a more complete and refined depiction of the spatiotemporal interaction pattern of APC. (2) The flow network of the Beijing APC involves 316 cities in China, of which 143 cities play a major role with typical seasonal characteristics. These cities can be divided into perennial core cities, perennial major cities, core cities in winter-spring, major cities in winter-spring, core cities in summer-autumn, and major cities in summer-autumn, contributing 2.6%-40.3% to the Beijing APC. (3) There are 6 transportation corridors for the Beijing APC. The Beijing-Tianjin-Hebei corridor and coastal corridor contribute 53.5% and 12.8% of the annual supply, respectively, with a balanced supply in all seasons. The Beijing-Kunming corridor and Beijing-Guangzhou corridor contribute 14.3% and 9.0%, respectively, with much higher supplies in winter and spring. The northeast and northwest corridors contribute 7.3% and 3.3%, respectively, mainly in the summer and autumn. These results help deepen the understanding of agricultural product supply patterns and provide a reference for the design and optimization of agricultural product transportation routes.
ZHAO Yibo , CHENG Shifen , LU Feng . Spatiotemporal interaction pattern of the Beijing agricultural product circulation[J]. Journal of Geographical Sciences, 2023 , 33(5) : 1075 -1094 . DOI: 10.1007/s11442-023-2120-z
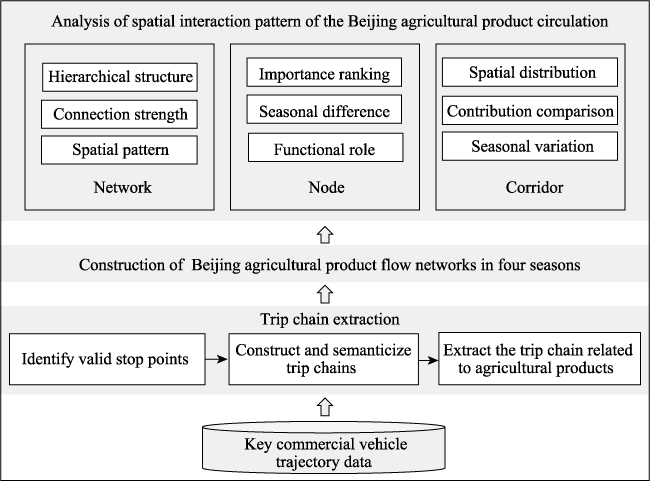
Figure 1 Analytical framework for the spatiotemporal interaction pattern of the Beijing agricultural product circulation |
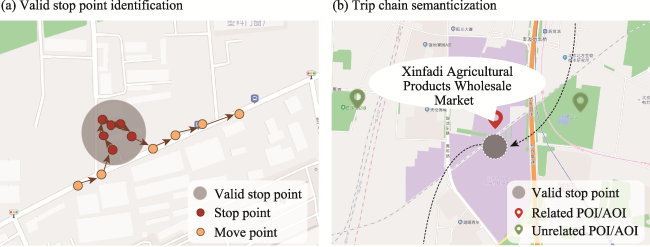
Figure 2 Trip chain extraction for agricultural product transportation |
Table 1 Relationship between POI/AOI category, activity purpose, and activity content (POI, Point of Interest; AOI, Area of Interest) |
| POI/AOI name | POI/AOI category | Activity purpose | Activity content |
|---|---|---|---|
| Mengrun Farm | Enterprises | Work | Loading/Unloading |
| Lvpin Zhigu Industrial Park | Commercial house | Work | Loading/Unloading |
| Xinfadi Agricultural Products Wholesale Market | Shopping | Work | Loading/Unloading |
| Renqiu Service Area Gas Station | Auto service | Rest | Refueling |
| Lingshi Service Area | Road furniture | Rest | Dining/Resting |
| … | … | … | … |
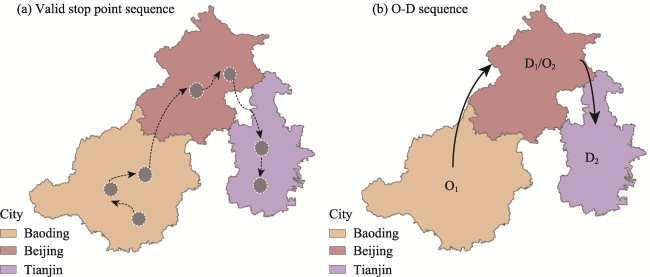
Figure 3 O-D sequence construction from valid stop point sequences |
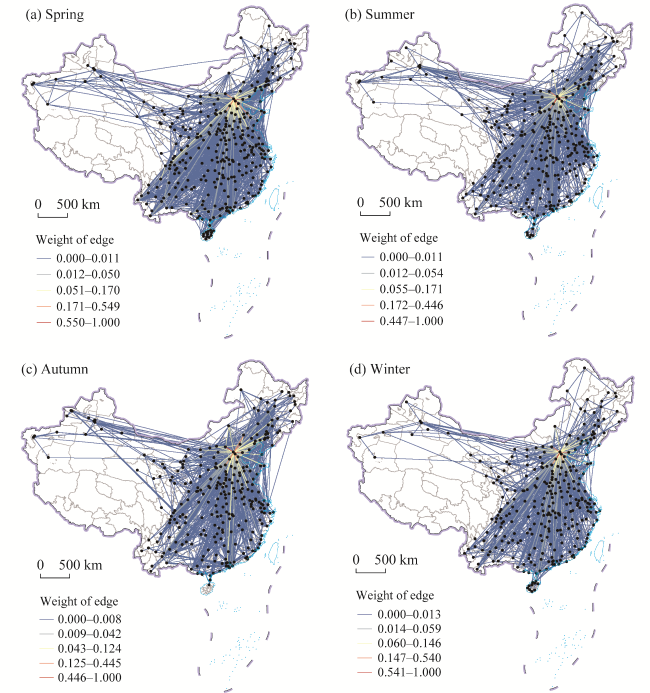
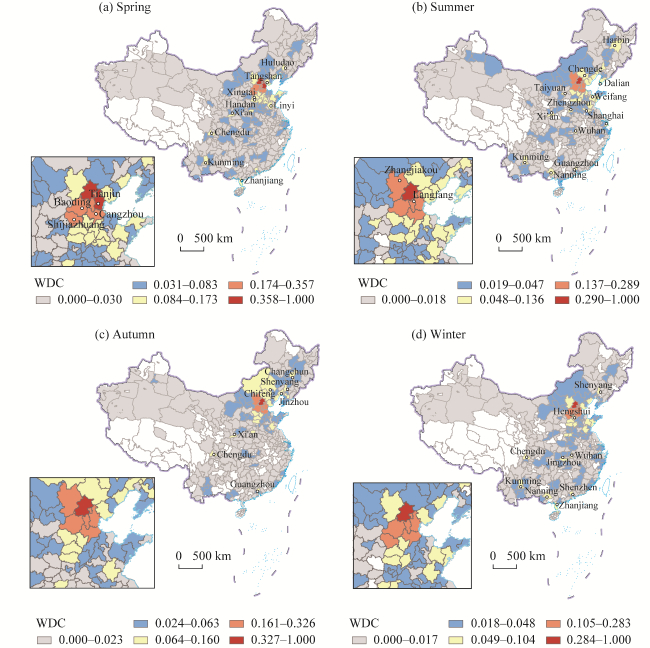
Figure 4 Flow networks of Beijing agricultural product circulation in four seasons |
Table 2 Statistical characteristics of flow networks of Beijing agricultural product circulation |
| Season | Number of cities | Freight scale | Average WDC | Maximum WDC | Average CV | Zipf | Goodness of fit (R2) |
|---|---|---|---|---|---|---|---|
| Spring | 305 | 6945 | 20.50 | 825.23 | 1.20 | 1.0927 | 0.833 |
| Summer | 295 | 5587 | 21.83 | 845.29 | 1.25 | 1.1017 | 0.863 |
| Autumn | 284 | 6541 | 23.97 | 904.85 | 1.24 | 1.2082 | 0.888 |
| Winter | 290 | 4460 | 18.75 | 742.53 | 1.25 | 1.0758 | 0.868 |
Figure 5 Spatial distribution of city ranks for Beijing agricultural product flow in four seasons |
Table 3 Global Moran’s I of the spatial distribution of city ranks for Beijing agricultural product flow in four seasons |
| Season | Global Moran’s I | Z score |
|---|---|---|
| Spring | 0.212 | 20.054 |
| Summer | 0.226 | 18.338 |
| Autumn | 0.255 | 18.898 |
| Winter | 0.185 | 16.318 |
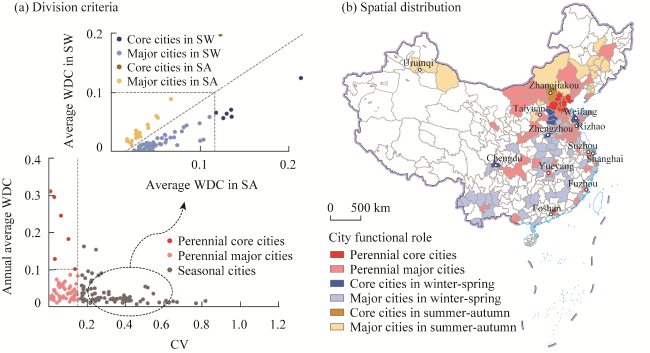
Figure 6 Division criteria and results of city functional role (SW: spring and Winter, SA: spring and autumn) |
Table 4 Seasonal contributions of cities to the Beijing agricultural product circulation |
| City role | Perennial core cities | Perennial major cities | Core cities in winter-spring | Major cities in winter-spring | Core cities in summer-autumn | Major cities in summer-autumn |
|---|---|---|---|---|---|---|
| Number of cities | 6 | 56 | 6 | 56 | 1 | 18 |
| Proportion | 40.27% | 22.82% | 6.65% | 13.34% | 2.62% | 5.17% |
| Contribution per city | 5.75% | 0.41% | 1.11% | 0.24% | 2.62% | 0.29% |
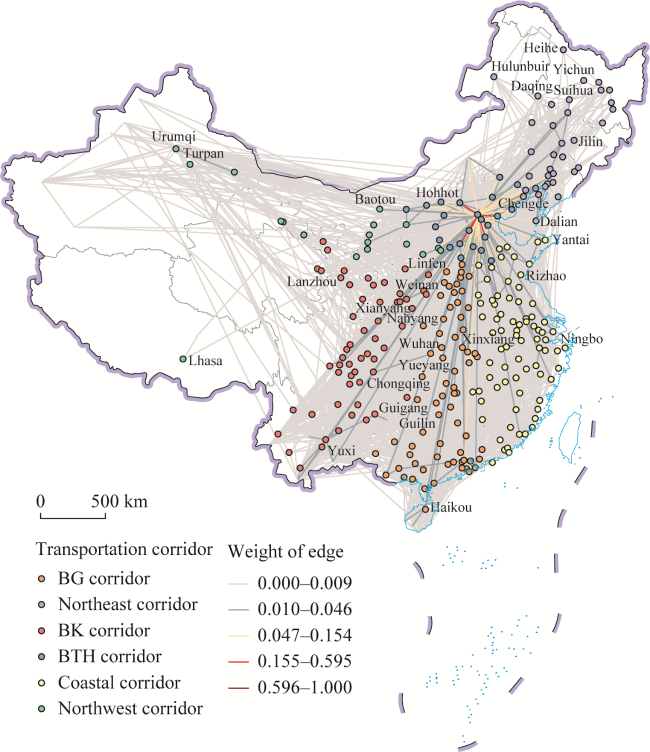
Figure 7 Spatial distribution of the Beijing agricultural product transportation corridor |
Table 5 Main cities of each transportation corridor |
| Corridor | Perennial core/major cities | Core/major cities in spring-winter | Core/major cities in summer-winter |
|---|---|---|---|
| BG corridor | Guangzhou, Wuhan, Dongguan, Puyang, Chongzuo, Foshan, Yueyang, Hebi, Yichang | Handan, Zhengzhou, Nanning, Zhanjiang, Haikou, Shenzhen, Changsha, Jingzhou, Kaifeng, Anyang, Guilin, Xinxiang, Nanyang, etc. | / |
| Northeast corridor | Shenyang, Huludao, Jinzhou, Dalian, Harbin | / | Changchun, Anshan, Yingkou, Songyuan, Tieling, Suihua, Siping, Tongliao, Liaoyang, Jilin |
| BK corridor | Xi’an, Yuncheng, Weinan, Chongqing, Yuxi, Lanzhou, Xianyang, Linfen, Ziyang | Chengdu, Kunming, Guiyang, Honghe Hani and Yi Autonomous Prefecture, Meishan, Hanzhong, Changde, Sanmenxia, Qujing, Xishuangbanna Dai Autonomous Prefecture, Chuxiong Yi Autonomous Prefecture, Ya’an, Dali Bai Autonomous Prefecture, Dehong Dai and Jingpo Autonomous Prefecture, Baoshan | / |
| BTH corridor | Langfang, Tianjin, Baoding, Cangzhou, Tangshan, Hengshui, Qinhuangdao, Dezhou, Jinan, Chifeng, Ulanqab, Hohhot, Baotou, Chaoyang, Datong | Shijiazhuang, Xingtai | Zhangjiakou, Chengde, Xilingol League, Shuozhou |
| Coastal corridor | Linyi, Xuzhou, Qingdao, Shanghai, Binzhou, Jining, Zhangzhou, Suzhou, Shangqiu, Suqian, Zaozhuang, Suzhou, Nanjing, Jinhua, Weihai, Jiaxing, Lianyungang, Ningbo, Fuzhou, Rizhao | Weifang, Liaocheng, Yantai, Heze, Hangzhou, Tai’an, Ganzhou, Hefei, Dongying, Wuxi, Fuzhou, Wenzhou, Quanzhou, Taizhou, Huai’an, Nanchang, Jiujiang | / |
| Northwest corridor | Taiyuan, Ordos, Jinzhong, Bayannur | / | Urumqi, Luliang, Changji Hui Autonomous Prefecture, Hami |
Figure 8 Proportion of transportation scale of each corridor in each season |
| [1] |
|
| [2] |
|
| [3] |
|
| [4] |
|
| [5] |
|
| [6] |
|
| [7] |
|
| [8] |
|
| [9] |
|
| [10] |
|
| [11] |
|
| [12] |
|
| [13] |
|
| [14] |
|
| [15] |
|
| [16] |
|
| [17] |
|
| [18] |
|
| [19] |
|
| [20] |
|
| [21] |
|
| [22] |
|
| [23] |
|
| [24] |
|
| [25] |
|
| [26] |
|
| [27] |
|
| [28] |
|
| [29] |
|
| [30] |
|
| [31] |
|
| [32] |
|
| [33] |
|
| [34] |
|
| [35] |
|
| [36] |
|
| [37] |
|
| [38] |
|
| [39] |
|
| [40] |
|
| [41] |
|
| [42] |
|
| [43] |
|
| [44] |
|
| [45] |
|
| [46] |
|
| [47] |
|
| [48] |
|
| [49] |
|
| [50] |
|
| [51] |
|
| [52] |
|
/
| 〈 |
|
〉 |